May 2, 2024

It Should Be A Very Merry Christmas For Gold Investors

In an interview with Bloomberg TV, Greg Smith, chairman of Global Commodities, is forecasting $2,000 gold by Christmas.

Long term investors in gold would have a very merry Christmas since a price of $2,000 would equate to a 2012 price gain of over 25% from gold’s opening price on January 3, 2012.

From today’s closing gold price, a $2,000 per ounce price by year end equates to a gain of $241 per ounce or 13.7%.  Aggressive investors have many different ways to leverage gains on a potential run up in gold by year end.  For example, a position in Pro Shares Ultra Gold (UGL) would yield a gain of about 27% if gold hits $2,000 by year end.

The UGL does not hold physical gold but rather invests in futures, forward contracts, options and swap agreements designed to yield gains of 200% of the daily performance of gold bullion.  Last summer when gold soared to an all time high, the UGL returned twice the gains of  the SPDR Gold Shares ETF (GLD).  Keep in mind that leverage works both ways – if gold declines, an investment in the UGL would produce twice the losses compared to holding physical gold or shares in the GLD.
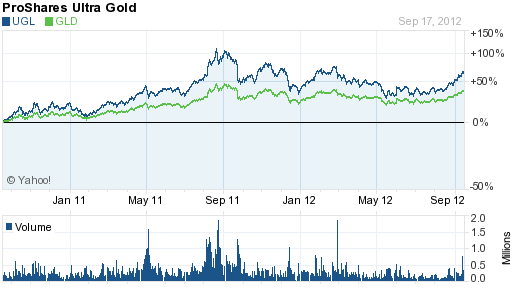
Courtesy: yahoo finance


Why Gold Will Outperform Bonds

By Vin Maru

This past week was a major catalyst for the precious metals, as they closed the week up strongly based on strong fundamentals for the sector. We have been anticipating the next catalyst for the PM sector to start making a strong advance, and we got it with a coordinated effort from central banks around the world. They will print whatever is necessary to fight off deflation and another financial collapse. Here are a few headlines we saw from the media lately:

“Gold Prices Gain on German Ruling”, “ECB to launch ‘outright monetary transaction’ plan”, andIMF’s Lagarde backs ECB-bond buying plan”

This afternoon, the FOMC meeting concluded and was followed by a press conference by Ben Bernanke. The precious metals market has been on a strong uptrend over the last month in anticipation of additional bond buying and stimulus (AKA Quantitative Easing).  Over the last month, the fed has hinted that they will stimulate if needed but never actually pulled the trigger. Precious metals still rose in anticipation of coming QE.  Well, he finally did it and the metal prices are up on this news, below is some commentary on what the fed announced. See Reuters article about this QE.

This looks to be stimulus like the original QE 1 and 2 and this is super bullish for gold, like it was back in 2009 and 2010.  This starts off another major uptrend for gold and it will be going to $3500 over the next few years.  Now is the time to be getting invested again, it’s almost an all in moment on any pullback and then its onwards and upwards from here.  We can expect this QE to last indefinitely just like we can expect a low interest rate environment for an extended period of time.  It’s QE to infinity and gold will definitely shine.

ECB Bond Buying Program

With headlines like these, the world markets are proven to be irrational in their approach to dealing with debts; the central banks around the world will print and by up bonds as needed. The West may have saved themselves for the moment, but this really opens up the door for moral hazard and the mindset that debts don’t matter has been rationalized around the world. The Western central planners rationalize their action by stating the bond buying program will be sterilized. The hazard is that other central bankers around the world will also engage in sterilized bond buying and supporting of governments, all of which is backed by nothing except faith. They claim the bond buying is sterilized because the central banks print money to buy bonds of the governments to keep yields low and then make up new bonds to sell to other central banks and all of this financial alchemy is based on buying and selling of foreign currency bonds. To learn more about currency intervention and how the bonds could be sterilized, you can read about it here.

They claim the net effect is there is no increase in the monetary base, but any rational human can see this is pure manipulation and gaming the system. With no new monetary base, the money supply in the system does not increase and it is very similar to Operation Twist. The net effect of the new bond buying program is there will be no direct stimulus to the economy and the governments will continue to be supported by the central banks. The new bonds issued by the government will carry lower interest rates, which will then be supposedly paid back to the CBs over an extended period of time. The old government debt will be rolled over and extended from this bond buying program and only small amounts of additional interest will be paid on these new bonds, which tax payers will eventually have to pay one way or another. The governments will then have to accommodate the additional interest payments on the new debt which could eat into budgets, so they will either tax more or reduce some of their spending. The paper currency Ponzi scheme will be allowed to continue and coup d’état over the financial system has been accomplished by the central bankers. The idea is that bad loans and debts do not matter anymore in an attempt to keep the system afloat, eventually that will fail and precious metals will prosper as a result.

With keeping interest rates low, bonds have virtually no upside from here since interest rates can’t go much lower from here.  Savers will be forced to speculate in order to create yield and precious metals will benefit over the next few years from a negative yield interest rate environment.  Business with tons of cash on the sidelines will be forced put that money to work in search of economic returns and banks with tons of cheap cash on hand will be loaning out more money to qualified people and businesses. Deflation and collapse is no longer an option, the system will be supported and soon the market will be talking about expansion and growth again. Money will be put to work even though the western economies may stagnate over the next decade. The market will soon look beyond the Euro and US mess and move forward in search of yield.  It may continue looking at emerging markets for growth and opportunities, but it definitely look to precious metals for safety from the depreciation of paper currencies.

Once we start seeing this money turning over in the system, the velocity of money will increase significantly which will then lead to higher inflation, this is when we can expect gold to really shine.  While the upside for bonds will be limited in a low interest rate environment, the upside for gold is unlimited from endless printing of fiat currencies and bonds by all central bankers and governments around the world.  The upside for the price of bonds is limited to interest rates going to zero and they can be printed to infinity.  The amount of gold available in the world is fixed to current inventory plus expected additional supply.  Because supply is limited, gold’s price could go to infinity to equally match the unlimited printing of bonds and currency units which are used to purchase them. So in the end, bond prices are limited on the upside while supply is infinite, while gold supply is limited and it’s price is limitless in a world based on fiat currencies—which would you rather own?

Gold Update

In the last 2 weeks, gold has made a great break out move above $1620 and then $1660-$1680. The price is now holding strong above $1720 as central bankers are planning on bond buying programs and additional stimulus in a coordinated effort to avoid a deflationary spiral. This opens up the door to QE to infinity, they will print since there is no other option and precious metals will benefit from this. Gold and silver are going much higher in the years to come, but it won’t be in a straight line. Expect volatile moves to the upside and swift corrections, but the general trend for the next few years is towards higher prices. Keep with the trend and buy the dips and sell into major strength if you plan on trading the paper markets. If you purchased the physical metals during this past summer, you may want to consider holding on to them, we may not see these prices again, ever.

The RSI is rising and starting to move above 80, which could be getting into overbought territory, however the MACD is in a slow steady trend higher over the last couple of months. Look for new support to be around $1680 (which would be a good opportunity to add to positions) and short term overhead resistance to be at $1780-1800 (sell trading positions currently open) which has been overhead resistance back in November and February, at which time we could see a significant correction. If the gold market clears $1800 and holds on a closing weekly basis, we could retest the previous highs and go on to make new highs .

The HUI Gold Miners Index

The HUI clearly broke the downtrend line by gapping up above it late last week. The RSI is still rising and so is the MACD. If gold makes a move to $1800, expect the HUI to rise towards 500 before taking a break and correction. This would be a great time to sell open trading position in the next few weeks, especially after any news from the Fed about stimulus and QE. The fact that gold and the HUI has risen so much in the last month based on expectations for QE and the indicators are getting close to  overbought territory.  We may see an initial jump in price for the HUI index after any announcement, then a minor correction as much of this news could be priced into the metals and the miners.  Watch the reaction of the metals and the HUI later this week and next, but if the advance higher starts stalling out, you may want to consider closing trading positions and book some profits.

More than likely towards the end of this month/early next month, we could start to see a minor correction going into October and November as election approach, the market may take a breather. We may also see some strong year end selling this year, especially coming from the US as their tax laws on capital gains are scheduled to change next year. It would be a good time to start new positions or add to current holdings during that correction.  We can expect the trend to continue higher as the metals go on to make higher highs and higher lows over the next 6 to 9 months.

If you enjoyed reading this article and are interested in protecting your wealth with precious metals, you can receive our free blog by visiting TDV Golden Trader.

India’s Attempt To Curb Gold Purchases Will Ultimately Fail

India may increase the import tax on gold for the third time this year in an attempt to shore up the weak rupee.  Purchases of gold and silver account for a huge 12.5% of all Indian imports and are contributing to a record current-account deficit according to Bloomberg.
“The government may look at increasing the duty to 7.5 percent,” Prithviraj Kothari, president of the Bombay Bullion Association, said in a phone interview. D.S. Malik, a finance ministry spokesman in New Delhi, declined to comment.

The tax on bars and coins was doubled to 4 percent in March after imports jumped to a record 969 metric tons in 2011. A further increase may deter jewelry buyers and investors during India’s festival season, which starts this month, as a decline in the rupee against the dollar boosts domestic gold prices to an all-time high. Imports plunged 42 percent to 340 tons in the first half, according to the producer-funded World Gold Council.

Curbing shipments of gold will help the country to narrow the current-account deficit as the drop in rupee boosts the cost of crude-oil purchases, according to the finance ministry. The shortfall widened to a record 4.2 percent of the gross domestic product in the year ended March from 2.7 percent in 2010-2011.

The rise in the deficit, the broadest measure of trade, was due to slower exports and so-called relatively inelastic imports of petroleum products, gold and silver amid a rally in global prices, Finance Minister P. Chidambaram said on Aug. 23.

Will India’s attempt to restrict import of precious metals be successful and what impact will this have on the price of gold and silver?  Let’s consider the following:

1.  The Indian government should know better.  In 1962, India passed the Gold Control Act which prohibited Indian citizens from owning gold bars and coins.  The result was the instant creation of a huge black market that continued to supply gold and silver throughout India.

The (Gold Act) legislation killed the official gold market and a large unofficial market sprung up dealing in cash only. The gold was smuggled in and sold through the unofficial channel wherein, many jewelers and bullian traders traded in smuggled gold. A huge black market developed for gold.

In 1990, India had a major foreign exchange problems and was on verge of default on external liabilities. The Indian Govt. pledged 40 tons gold from their reserves with the Bank of England and saved the day. Subsequently, India embarked upon the path of economic liberalization. The era of licencing was gradually dissolved. The gold market also benefited because the government abolished the 1962 Gold Control Act in 1992 and liberalized the gold import into India on payment of a duty of Rs.250 per ten grams. The government thought it more prudent to allow free imports and earn the taxes rather than to lose it all to unofficial channel.

2.  India should be more concerned with maintaining a currency that offers their population a stable store of value rather than depriving their citizens of viable alternate currencies such as gold and silver.

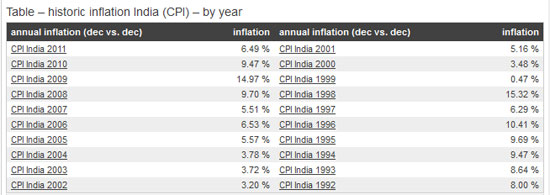
3.  The centuries old tradition in India of holding gold and silver as a source of liquidity and for capital preservation is unlikely to change.  The rupee, like most other paper currencies, has been systematically debased.  Inflation in India over the past decade has made holding rupees a losing proposition.

Courtesy: inflation.eu

4.  The reduction in gold demand during the first half of the year by both China and India has been widely touted in the mainstream press as a reason for a continued sell off in the precious metal markets.  Right.  Despite the reduction in gold demand by China and India, gold based out in the $1,600 range before rallying sharply to $1,697.   Gold is now $99 or 6.2%  higher than it was on the first trading day of 2012.

courtesy: stockcharts.com

5.  By attempting to restrict gold purchases, India has simply advertised the rupee’s intrinsic lack of value to their citizens which will ultimately create an even greater demand for gold and silver.

Gold and Silver Bullion Coin Sales Jump 25% In August, San Francisco Silver Eagle Set Sold Out

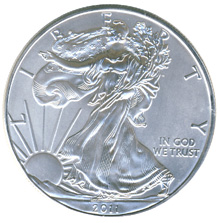
The latest sales figures from the U.S. Mint for August show a significant increase in sales of both gold and silver bullion coins.
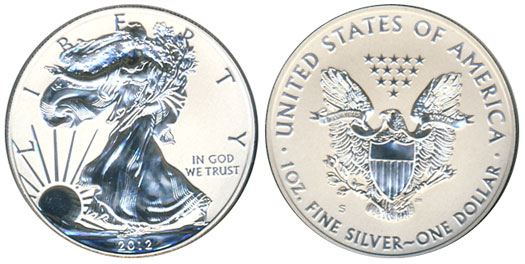
Sales of gold bullion coins during 2012 have varied dramatically from month to month with a high of 127,000 ounces in January to a low of only 20,000 ounces in April.  Monthly gold bullion sales through August have averaged 51,625 ounces.

Monthly sales of silver bullion coins have been more consistent during 2012.  The U.S. Mint sold over 6 million ounces of silver bullion coins in January, but the monthly pace has tapered off to under 3 million ounces.  The average monthly sales of silver bullion coins through August is 2,817,500.

American Eagle Gold Bullion Coin Sales

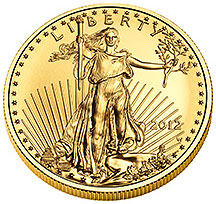
Total sales of the American Eagle Gold bullion coins during August totaled 39,000 ounces, up 27.9% from July’s total of 30,500 ounces.  Total sales of gold bullion coins by the U.S. Mint through August totaled 413,000 ounces, valued at approximately $700 million based on today’s closing gold price.

On an annualized basis, the U.S. Mint will sell almost 620,000 ounces of  gold bullion to investors this year valued at $1.0 billion if the price of gold remains at $1,692.  During 2009, the peak year of gold bullion coin sales by the U.S. Mint, investors purchased 1,435,000 ounces valued at $1.4 billion based on the average price of gold of $972 per ounce.

Investors who have reduced gold bullion purchases due to the increased cost per ounce will no doubt regret this decision as the price of gold continues to increase.  The value of gold should be viewed in the context of the reduced purchasing power of the dollar – as the Federal Reserve constantly destroys the purchasing power of the U.S. dollar, the “dollar cost” of gold will naturally increase.  The price of gold is merely reflecting the fact that paper dollars are worth less and less every day.

As the Fed continues to do what it does, expect the bull market in gold to continue.

Listed below are yearly sales figures for the American Eagle gold bullion coins since 2000.  Sales for 2012 are through August 31st.

Gold Bullion U.S. Mint Sales By Year
Year Total Sales Oz.
2000 164,500
2001 325,000
2002 315,000
2003 484,500
2004 536,000
2005 449,000
2006 261,000
2007 198,500
2008 860,500
2009 1,435,000
2010 1,220,500
2011 1,000,000
2012 413,000
Total 7,662,500

American Eagle Silver Bullion Coin Sales

Sales of the American Eagle Silver bullion coins by the U.S. Mint during August totaled 2,870,000 ounces, up 25% from the July total of 2,278,000 ounces.  Investor demand for silver has remained strong, with many investors taking the opportunity to purchase additional silver below the highs reached during 2011.  Sales of the silver bullion coins remain near record levels and total sales for 2012 should be well in excess of 30 million ounces for the third consecutive year.

Total annual sales by the U.S. Mint of the silver bullion coins since 2000 are shown below.  Sales for 2012 are through August.

American Silver Eagle Bullion Coins
YEAR OUNCES SOLD
2000 9,133,000
2001 8,827,500
2002 10,475,500
2003 9,153,500
2004 9,617,000
2005 8,405,000
2006 10,021,000
2007 9,887,000
2008 19,583,500
2009 28,766,500
2010 34,662,500
2011 39,868,500
Jul-12 22,540,000
TOTAL 220,940,500

U.S. Mint Numismatic American Eagle Gold and Silver Coins

Both the American Eagle gold and silver bullion coins can only be purchased from the U.S. Mint by Authorized Purchasers who in turn resell the coins to other dealers and the general public.  The numismatic versions of the American Eagle series coins can be purchased directly from the U.S. Mint.

Many of the numismatic silver coins produced by the U.S. Mint attract strong demand and often times, the coins will sell at a premium in the secondary market.  A recent example of this is the 2012 San Francisco Silver Eagle Set.  According to the Mint News Blog:

The 2012 San Francisco Silver Eagle Set was one of the United States Mint’s most anticipated product releases of the year. Each set contained one 2012-S Proof Silver Eagle and one 2012-S Reverse Proof Silver Eagle.

Product sales began on June 7, 2012 at 12:00 Noon ET with pricing of $149.95 per set. Rather than establishing a maximum product limit, as had been done for similar products in the past, the US Mint would accept orders during a four week ordering window and produce the sets to meet the total demand. A sales odometer which was updated daily gave collectors an indication of the progress of the offering. Sales officially closed on July 5, 2012 at 5:00 PM ET. The last indicated sales total was 251,302 sets.

On the secondary market, prices for the sets remain above the issue price. A quick survey of eBay auctions completed within the past few days show the prices realized for raw sets mostly falling into a range of $180 to $190, compared to the issue price of $149.95.

Sets which have been graded by PCGS or NGC and received the top grade of Proof-70 have sold for premiums above raw sets. Sets with the two coins graded PCGS PR70DCAM and PR70 have recently sold for prices around $425 to $450. Sets with the two coins graded NGC PF 70 Ultra Cameo and PF 70 have sold for prices around $300 to $325.

Buy The SPDR Gold Trust – You Don’t Argue With Paulson and Soros

Despite the correction in gold prices since last summer, investors in gold ETFs have increased their stakes.  Worldwide holdings of gold ETFs are now at a record 2,417 metric tons according to Bloomberg News.

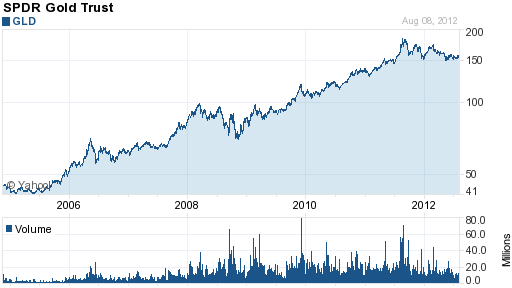
The SPDR Gold Trust (GLD) is the largest gold ETF and has returned a lustrous annual return of 18.4% since the fund’s inception on November 18, 2004.  The GLD currently holds 1,258.15 tonnes (40.45 million ounces) of gold in trust valued at $64.8 billion.  The all time record high holdings of the SPDR Gold Trust was 1,320.47 tonnes on June 29, 2010.

The slight decline from record gold holdings of the GLD do not represent a lessening of gold demand by investors.  Numerous competing gold trusts such as the iShares Gold Trust (IAU) which holds $9.3 billion of gold bullion have simply given investors a wider choice of options and expanded the overall market for gold ETFs.

Word that two of the world’s most successful investors have increased their stakes in the SPDR Gold Trust highlight the fact that the bull market in gold is far from over.   Billionaires John Paulson and George Soros, both long time investors in the GLD , both recently increased their holdings.

Courtesy yahoo finance

While Paulson has increased his massive stake in the GLD over time, Soros attempted to time the market.  In the first quarter of 2011, Soros sold 4.7 million shares of the GLD which brought his holdings down to a token 49,400 shares.  Subsequent to his sale, gold soared about $500 per ounce higher to $1,900 during August 2011.  Short term trading is difficult for anyone, including one of the world’s most successful investors.  Since the fundamental reasons for owning gold have only become more compelling, small investors would be best advised to hold long term instead of trying to trade a temporary price pullback.

Courtesy kitco.com

According to Bloomberg, Paulson and Soros Add Gold As Price Declines Most Since 2008.

Billionaire investors George Soros and John Paulson increased their stakes in the biggest exchange- traded fund backed by gold as prices posted the largest quarterly drop since 2008.

Soros Fund Management more than doubled its investment in the SPDR Gold Trust to 884,400 shares as of June 30, compared with three months earlier, a U.S. Securities and Exchange Commission filing for second-quarter holdings showed yesterday. Paulson & Co. increased its holdings by 26 percent to 21.8 million shares.

Paulson, 56, who became a billionaire in 2007 by betting against the U.S. subprime mortgage market, lost 23 percent in his Gold Fund through July as lower bullion prices and slumping mining stocks contributed to declines.

Still, prices have rallied for 11 consecutive years, gaining more than sevenfold, as investors snapped up the metal after government and central bank stimulus programs boosted speculation that inflation would accelerate. The metal is up 2.4 percent this year.

“People expect prices to rise in the third quarter since historically it has been proved that it’s one of the best periods for gold, and investors who see easing coming in from various central banks are either increasing or holding on to their positions,” Donald Selkin, the New York-based chief market strategist at National Securities Corp., which manages about $3 billion of assets, said by telephone.

Paulson’s increased stake in the GLD should come as no surprise.  In a previous post during July, it was noted that Paulson remained steadfastly bullish on gold with a $4,000 target.

Time To Buy The Summer Bottom In Gold

By Vin Maru

General Outlook for Gold and the Miners

It is our firm belief that the precious metals sector has bottomed out and the downside is very limited from here on out.  While there doesn’t seem to be an immediate rush back into the sector, now is a great time to be acquiring physical metals, but more importantly producers with growth profiles. That’s where we really see the value and upside potential.  Now would be a good time to start adding and scaling into any new positions you plan on taking.

If we would have to make a speculative/educated guess/evaluation, by looking at the charts and fundamentals for precious metals and the miners, we believe that the worst is over.  We are fairly certain that we have seen the bottom over this past summer and building a good position in the physical, ETFs, and select miners right now is looking very promising.

Support has pretty much held throughout the summer and it’s looking good going into the fall.  While we still may see one more down wave, it would be more of a fake breakdown below support just to scare the remaining weak hands.  If that happens, I would think backing up the truck is a good idea, and start getting aggressive in adding exposure to the sector.  Buying at support around $1570 is a good place to start adding to positions.  Over the next few weeks we expect gold to trade around $1600 (+ or – $30) in a sideways trading range.

The HUI is still lagging gold, but a solid base under 400 has been building and it looks like a good time to add at support around 390.  If you look at the chart below, it started a major correction back at the beginning of March (when we suggested selling) and made a bottom in the middle of May.  Since then the index has traded sideways between 390 and 460.  A particular item to note on the chart is a 3 fan formation that seems to be developing since March.  If the summer lows and support holds at 390, then a re-test of 420 and the 50 dma should come soon, this happens to be the top of 2nd fan line.  If it crosses above the 2nd fan line and holds above the 50 dma, it could trigger a move to 460 and overhead resistance, with a possible move to the 200 dma at 485.  This is something we will watch for and take one day at a time.

Juicing Profits with Covered Calls on the Senior Producers

If you are interested in options strategies for a flat market, you may want to consider writing calls against the shares you currently own or if you plan on take a position in the senior producers over the next few weeks.   This is great way to squeeze some extra money out of the market by writing covered calls while still maintaining a position in your favourite seniors.

If you own or are buying shares in major producers (which is a good idea as long as PM stay flat), make some extra money by selling call options slightly higher than market price (up to 20% higher is a good price) with a covered call option strategy.  This way you get to own the stock, collect dividends if the producer pays them and then collect the premiums by selling the calls.  If the stock breaks above the call strike price, you have the shares to deliver, and can still buy back your position at spot or wait for a slight pull back.

If you are unfamiliar with the covered call strategy, you can learn more about it by a simple google search or by visiting the Investopedia site discussing covered calls, below is a brief description from their site.

Definition of ‘Covered Call’

An options strategy whereby an investor holds a long position in an asset and writes (sells) call options on that same asset in an attempt to generate increased income from the asset. This is often employed when an investor has a short-term neutral view on the asset and for this reason hold the asset long and simultaneously have a short position via the option to generate income from the option premium.

Summary of Strategy

Our subscribers have been provided some good ideas for buying several senior producers.  There are many small to mid size producers which we also like and a few great exploration plays that are also on our radar.  Over the next few weeks, we will provide some additional companies which also merit owning a position in.  While it may not be feasible to buy shares in all these companies, you should create a basket of producers and exploration companies in your own portfolio.  At the moment, all the producers have great value (even if you bought at today’s prices) and most will do very well in the next few years.  You could literally throw a dart and pick anyone of the majors and they will all raise in share price once gold starts rising.  Our goal is to help find the ones that have greater upside potential and organic growth.

If you are familiar with options trading, you should consider buying some call options in many of the majors.  If you are very knowledgeable about options, consider the covered call strategy we just suggested with several of the majors that don’t have a great growth profile in the next year.  With a covered call, you want the stock to sit sideways while you collect the premiums for selling the calls.  If you don’t understand covered calls, we suggest you stay away from them or ask before you initiate this strategy.

For the moment, we suggest slowly picking away at the junior and explorers as they are usually the last to rise in price in a normal cyclical move higher in precious metals.  Could this time be any different?  Absolutely, they have become so cheap that many are trading for cash value and very little value is given to proven reserves.  This could change at any time and this is something we will watch for when all boats start rising with the coming tide into gold and the miners.  We feel that tide is coming soon and you want to be positioned to ride the wave once it does arrive, and looking out on the horizon all we can say is: SURF’S UP.

If you enjoyed reading this article and are interested in protecting your wealth with precious metals, you can receive our free blog by visiting TDV Golden Trader.

Cheers,

The Bright Side Of Plunging Gold Stocks

Each day another gold stock blows up.  Last week it was NovaGold (NG) and then Newmont Mining (NEM) and before that a long list too painful to mention.  Although I strongly prefer holding physical precious metals over mining companies, the gold stocks that I do own have put in less than a sterling performance.
I won’t bother going through the reasons why gold stocks could recover or mention the fact that many of them are trading at a fraction of what they were worth when gold was a thousand dollars lower.  Stocks are ultimately valued on earnings and for a variety of reasons, many of the mining companies have not been able to translate higher gold prices into higher dividends or earnings.

To put this all into perspective, I was pondering on two innate character traits I possess that can be confirmed by anyone who knows me.

First and foremost, I procrastinate on everything in life, but actually have a very profound theory to validate the benefits of a trait that many would view as indolence.  Despite the occasional guilt for not doing something today instead of next week, I have conclusively proved to myself that a large percentage of those “today to do list” items somehow resolve themselves without my intervention.  Perhaps just a rationalization but it seems to work.

My second dominate character trait, and this one actually relates to plunging gold stocks, is my innate belief that somehow there is a blessing lurking next to each catastrophe.  What often times seems like Armageddon may be a benefit.  So how exactly do plunging gold mining stocks wind up benefiting long term gold investors?  The answer is actually in the details of each poor earnings report delivered regularly by gold miners.  When you drill into the core reasons for poor earnings, the answers all correlate  to lower gold production due to overestimates of ore reserves, mining difficulties and the higher cost of mining lower grade ore reserves.

The fundamental fact is that the quantity of high grade ore reserves has declined dramatically making it much more costly and difficult to produce gold.  In a recent article the Wall Street Journal estimated that at current production rates, all known gold reserves would be depleted within ten years.  It wouldn’t take much of a bump in demand to eventually propel gold to multiples of today’s price.

Here’s a neat info graphic from visual.ly.  Note that net gold supply has been static for the past decade and large scale high grade gold deposits are rarer than ever.

Gold Part II: Mining and Supply 


Would Auditing The Fed Send Gold Higher?

By Vin Maru

The House Passes H.R. 459 Bill from Ron Paul to Audit the Fed

July 25, 2012 should go down in history as the date the Federal Reserve may become fully accountable to the US government. A motion to pass the bill as amended was unanimously approved by the house to require a full audit of the boards of governors of the Federal Reserve System and banks. This will be done by the Comptroller General of the US before the end of 2012 and they are required to issue their report within 12 months of enactment.  The votes in the House in the bill’s passing this was 326 yea votes to 99 nay votes with 7 non votes.  Interestingly enough it was the Republicans that strongly supported this bill with 239 yea and 1 nay vote, while the Democrats voted 88 yea and 98 nay.
http://youtu.be/C47DVVUmHDw

There are many hurdles ahead of this bill before it takes effect; it still has to be ratified by the Senate and the President.  However, finally getting approved in the House is a step in the right direction.  Even if it does pass how much effect will the audit have in reality?  Probably not much since the banking institution known as the Federal Reserve operates outside of any law.  Even if they are found guilty of any wrong doing in managing the value of the US dollar or being involved in rigging the Libor rate, who will be there to prosecute them?  Remember they operate outside the law, so even if they are found guilty, it will be the US citizens and holders of paper/digital US dollars that will somehow pay for it.

In a world where bank’s losses are socialized, the Federal Reserve (the banker for banks) misconducts have always been socialized on the people.  Of course, this socialization of losses by the Fed has been taking place ever since its illegal inception.  In 1913, the Federal Reserve stole the power to issue and control money by introducing the Federal Reserve note, something we call the US dollar.  Since then, it is estimated that the dollar has lost 95% of its purchasing power by way of inflation (the increase of the money supply), so it really has only 5% left to go.   As the value of the US dollar moves towards its intrinsic value of zero, gold and silver as true money has only one way to go and that is up.

Usually first reactions are correct and looking at this news the value of the US dollar reacted negatively, while gold went higher in most major currencies around the world.

Could This be the Catalyst that Gold Needs for a Major Break Out to the Upside?

In a manipulated market, it’s tough to say, but the fact that there is support for auditing the Fed and making it accountable is definitely a step in the right direction.  With the recent news about major banks manipulating the Libor rate, any investigation into the Fed’s involvement is most welcome and has to be gold-positive.  Recently, we have been writing about how gold is moving towards the financial system with several different proposals for making it a tier 1 asset class and its use as collateral by financial institutions. If these proposals take effect, they are planned for January 2013, which coincides nicely with this audit being completed by the end of 2012.

Normally, the summer doldrums represent the lows in price for precious metals with a significant rally occurring in the fall and winter.  With this recent down turn, we have most likely seen the lows, and there are many catalysts for G&S to move higher into next years.

For example:

1. Food inflation is rising with this drought.

2. Gold could carry a zero risk weighting on bank books by Jan 2013 (BIS and FDIC are proposing this).

3. Paper currencies are Fiat, essentially worthless, but they will be used to create inflation, there is no other choice at the moment—QE to Infinity.

4. Market manipulation by bullion banks will be overrun by physical buyer (mostly now coming from central banks).

5. The investment community is only 1% invested in gold; historically this has been 5-10%.

6. Political tensions with Iran could heat up again later this year or early next, causing higher oil prices and as such gold.

7. More banking manipulation and scandals are emerging this summer, the Libor scandal is just the tip of the iceberg.

8. They system for true price discovery is broken, regulators have failed and the LBMA & Comex have lost all control and credibility.

9.  The price suppression by the west will be overrun by the East and physical buyers. The West cannot win this paper game.

10. MOST importantly: GOLD and SILVER is a hard asset and it has a history of over 5000 years being REAL MONEY. This paper/digital money has been only in place over the last 100 years and is doomed to fail.

Now is the time to be investing in gold and silver, during this consolidation.  A long period of consolidation is usually followed by a major move either to the upside and downside.  Given gold and silver’s favourable fundamentals, the break out will most likely be to the upside as gold moves towards the financial system.  Today’s positive price action could be the start of a new trend higher going into the fall and early next year.  If this trend plays out, there will be several opportunities to trade in and out of several precious metals ETFs.  The gold miners are great value compared to gold and we have been evaluating several that have great upside potential and production growth.

The key is to be ahead of the curve before it happens, take a position and place a tight stop loss in case this is a fake break out and gold continues to correct lower against its fundamentals.  If the correction in gold is over and we are at a start of a new trend higher over the next year, this summer will prove to one of the best buying opportunities we have seen in a very long time.  Significant profits could be made buying gold and many of the producers during the summer doldrums and then selling into the fall and winter, the only question is are you positioned to take advantage of a trend change in gold when it happens.

If you enjoyed reading this article and are interested in protecting your wealth with precious metals, you can receive our free blog by visiting TDV Golden Trader.

Cheers

Have Gold Stocks Hit Bottom Yet? Richmont Mines Latest Disappointment

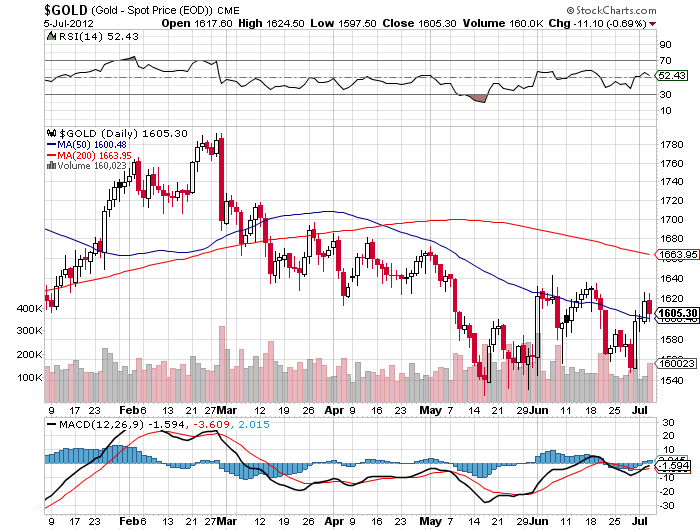
The price of gold is almost exactly unchanged on the year.  The first trading day of the year saw gold close at $1598 per ounce.  After reaching a high of $1781 on February 28th, gold has drifted lower and at today’s closing price of $1604 gold is up a fraction of a percent on the year.


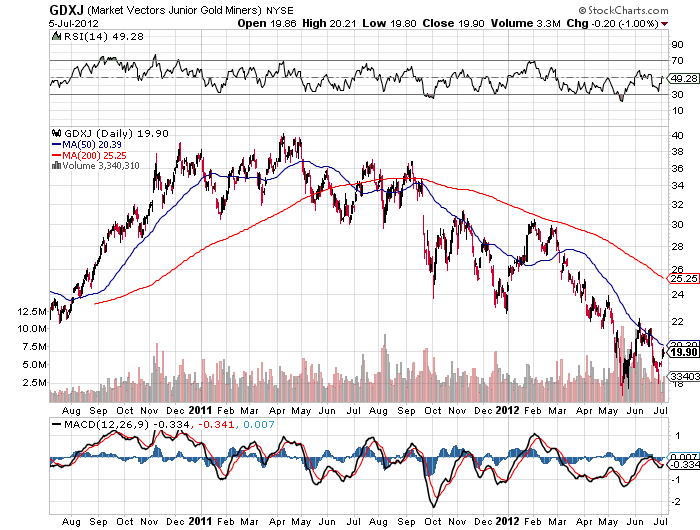
The story has been quite different for stockholders in gold mining companies.   Gold stocks have gone through a brutal sell off during 2012 despite the neutral price action of gold bullion.  Stock prices of the junior gold miners have been particularly brutalized as shown by the Market Vectors Junior Gold Mine ETF (GDXJ) which is down over 50% from its high late last year.


GDXJ - Courtesy stockcharts.com

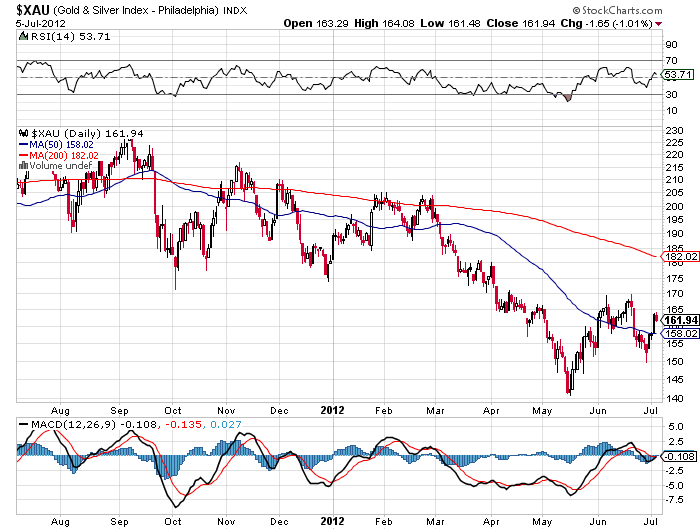
The shares of the largest gold miners have also seen major losses during 2012.  The PHLX Gold and Silver Index (^XAU), comprised of 16 major gold and silver producers, has decline by 21% from its peak reached in early February.


XAU - courtesy stockcharts.com

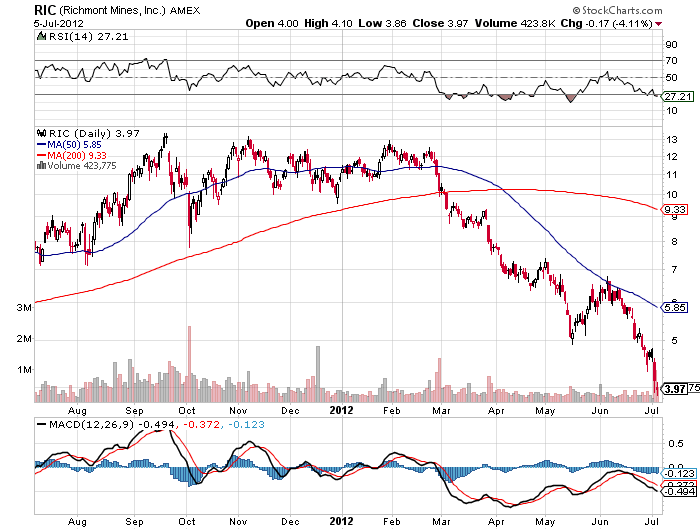
The latest casualty in the junior gold mining sector was Richmond Mines (RIC) which recently lowered its estimate of reserves and production and took a major write down on assets.  Richmond, a highly regarded gold mining company with excellent reserves and earnings prospects, was only one of the latest blowups in the junior gold mining sector.  Richmond Mines has collapsed 70% from its $13 per share price in late January, closing today at $3.97.


Courtesy stockcharts.com

Is the decline in gold mining shares a harbinger for the future trend in gold bullion or is the latest sell off a major buying opportunity?

Here are some thoughts from two of the brightest minds in the industry who both have superb long term track records.

Legendary gold investor John Hathaway of the Tocqueville Gold Fund (TGLDX) remains bullish as discussed in his latest Gold Strategy Investment Letter.

Why would anyone own them other than for the possibility of a higher gold price?  While we do not wish to minimize such issues as capital spending cost pressures, resource nationalism, or competition from GLD and similar instruments, we believe those concerns will fall by the wayside with the resumption of the bull market in the metal.  If gold were to trade at $2,000/oz. later this year, and should the ratio of gold mining shares (XAU basis) return to the mid -point of its range since the launch of GLD in 2004, or roughly 15% versus the current level roughly 10%, mining stocks could  double on a 25% increase in the gold price.

The policy challenges facing the Volcker Fed and the Reagan administration that ultimately capped the previous bull market in gold seem mild by comparison to those of today.  We believe that gold remains under owned and misunderstood notwithstanding a thirteen year bull market.  It is considered a fringe strategy to most, a little bit exotic and slightly risqué to the mainstream investor.  While policy makers attempt to buy time by inventing solutions that are incomprehensible to most, the dream of mainstream investors for robust growth amidst stable economic conditions remains alive.  Faith in half-baked policy improvisations that are nothing more than repackaging bad debt in the envelope of sovereign credit, along with hope that ever increasing quantities of sovereign debt will generate growth is, in our opinion, delusional.

Peter Grandich gives an excellent in-depth analysis on both gold stocks and gold bullion in a recent post on the Grandich Letter website.  The full post is a must read – here are some of his latest thoughts.

Despite general metals prices much, much higher than a decade or two ago, the mining and exploration industry is far more challenged now than ever before. This is especially true as you move further down the food chain in the junior resource sector.

I’m certain there are other reasons, but I believe the above is a good part of why we’re where we are today. The question now is does this mean the mining and exploration stocks are no longer worthy?

The “mother” of all bull markets continues thanks to four key reasons:

  • Once dominant sellers that capped any advances, Central Banks are now net buyers.
  • Gold producers, who once “cut their noses to spite their faces” by selling forward large quantities of future production and helped capped the price by doing so, now operate under the belief hedging is a “four-letter” word among investors.
  • Gold Exchange Traded Funds (ETFs) greatly changed the balance between supply and demand. Investors who never or rarely sought exposure to gold beforehand (because of difficulties associated with physical bullion buying) and/or who ended using mining shares for exposure only to see them not come close to correlating movements in the gold price themselves, embraced ETFs in a big and powerful way in order to have exposure to gold. Whether or not those ETFs are really direct ways to physical ownership doesn’t concern them, but their large-scale appetite for them combined with the changes among Central Banks and gold producers greatly altered the supply versus demand in favor of demand.
  • Gold is money. There’s no Central Bank printing it like it’s going out of style. There’s no government(s) borrowed up to their eyeballs in it. Where you find real growing wealth in the world you find those people acquiring it are using gold as a storer of their wealth.

Gold Bullion Coin Sales Up 13% In June, Silver Bullion Coin Sales Remain Steady

According to the latest report from the U.S. Mint, sales of gold bullion coins increased by over 13% during June, while total sales of the silver bullion coins were essentially unchanged from May.
Monthly sales of the American Eagle gold bullion coin have fluctuated considerably during 2012 with sales reaching a monthly high of 127,000 ounces in January and a monthly low of 20,000 ounces in April.  Sales rebounded strongly in May to 53,000 ounces and continued higher in June with the sale of 60,000 ounces.

Sales of the American Eagle gold bullion coin can vary dramatically from month to month based on many factors.  The all time yearly sales record for the gold bullion coins of 1,435,000 ounces was reached in 2009  when many people feared that the financial system would collapse.  Sales volume of the gold bullion coins have not, however, had a direct correlation to the price of gold.  Gold closed 2009 at $1,087.50 per ounce and subsequently went on to hit a 2011 high of $1,895 on September 5th.  Despite the fact that gold increased by over 74% since year end 2009, total gold bullion coin sales declined in both 2010 and 2011.

If the European financial storm continues to unwind into a collapse similar to what we experienced in 2008, sales of the gold bullion coins could easily expand dramatically over the record levels seen in 2009.  With each passing day, there seem to be fewer reasons to maintain confidence in the paper money system as central bankers and governments attempt to prop up a debt burdened world economy with additional debt and money printing.

Listed below are the yearly sales of the American Eagle gold bullion coins since 2000.  The total for 2012 is through June 30th.

Gold Bullion U.S. Mint Sales By Year
Year Total Sales Oz.
2000 164,500
2001 325,000
2002 315,000
2003 484,500
2004 536,000
2005 449,000
2006 261,000
2007 198,500
2008 860,500
2009 1,435,000
2010 1,220,500
2011 1,000,000
2012 343,500
Total 7,593,000

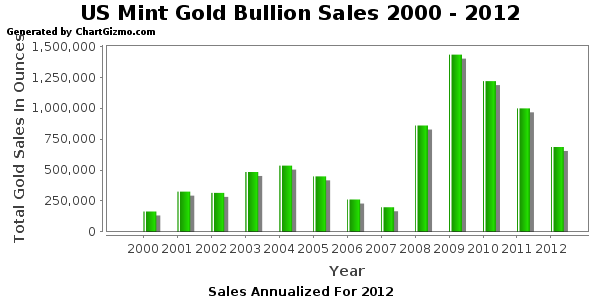
If the sales trend of American gold bullion coins continues on the pace it has been on thus far, 2012 may turn out to be the fourth year in a row of lower sales.  The graph below shows gold bullion coin sales since 2000 with figures for 2012 annualized based on sales through June 30th.

U.S. Mint sales of the American Eagle silver bullion coin continued strong in June at 2,858,000 ounces, down slightly from the May total of 2,875,000 ounces.  After a strong start in January with sales of over 6 million ounces, sales dipped below 2 million ounces in February and April.  Year to date sales through June 2012 of the silver bullion coins total 17,392,000 ounces, down by 22% from the comparable sales period in 2011 when 22,303,500 ounces were sold.

If sales of the silver bullion coins continue at the same pace for the remainder of 2012, total sales could exceed 34 million ounces, not far below the record set during 2011 of 39.9 million ounces.   Considering that silver has corrected in price from $48.70 reached during April of 2011, the volume of silver bullion coin sales is very robust, with buyers taking advantage of lower prices.

In addition to gold and silver bullion coins, the U.S. Mint sells numismatic series of both gold and silver American Eagle coins which the public can purchase directly from the U.S. Mint.  Bullion versions of the gold and silver American Eagles are only sold to Authorized Purchasers who in turn resell the product to the general public and other dealers.

Total annual U.S. Mint sales of the American Silver Eagle bullion coins since 2000 are shown below.  Sales totals for 2012 are through June 30th.

American Silver Eagle Bullion Coins
YEAR OUNCES SOLD
2000 9,133,000
2001 8,827,500
2002 10,475,500
2003 9,153,500
2004 9,617,000
2005 8,405,000
2006 10,021,000
2007 9,887,000
2008 19,583,500
2009 28,766,500
2010 34,662,500
2011 39,868,500
2012 17,392,000
TOTAL 215,792,500