April 26, 2024

Gold Demand Drops By 13% In First Quarter Due to ETF Outflows

tenth oz gold-eagles
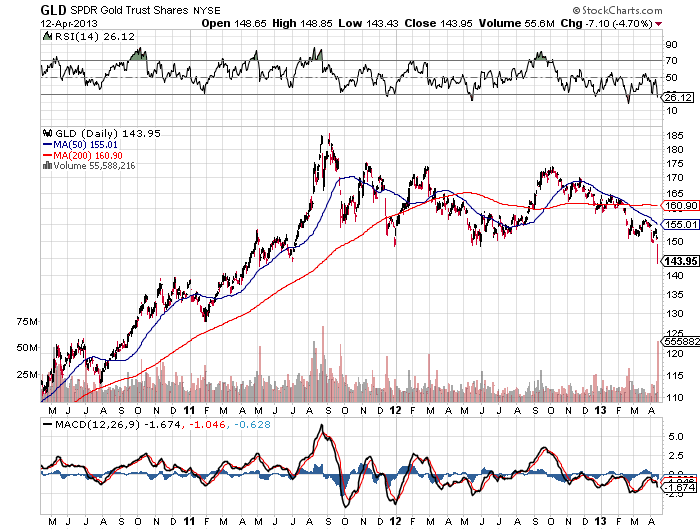
Large scale liquidation of gold backed exchange-traded products (ETP) sent gold prices into a tailspin during April.  Billionaire investor George Soros, who had sold 55% of his holdings in the SPDR Gold Shares (GLD) during the last quarter of 2012, further reduced his gold positions during the first quarter.  Soros is a legendary trader and investor who has made billions moving ahead of the crowd.

In an interview published by the South China Morning Post on April 8, Soros said that gold was no longer a safe haven after the metal failed to rally last year despite fears of a euro collapse.  Shortly after Soros made his comments, other investors  began to sell and within days gold had tumbled by $200 per ounce.  Northern Trust Corp and BlackRock Inc also made large cuts in their holdings of ETPs, while John Paulson lost about $165 million by maintaining his stake in the GLD.

According to Bloomberg, assets held by ETPs declined in value by $42 billion as gold prices tumbled.

Global ETP holdings have tumbled 16 percent in 2013 after rising every year since the first product was listed in 2003, according to data compiled by Bloomberg. Assets in SPDR have plunged 22 percent, and they will probably drop by an additional 2 million to 4 million ounces after slumping 9.7 million ounces since mid-December, Deutsche Bank AG said in a report on May 14.

Further Drop

While the selloff has been faster than expected, a further drop in ETP holdings will probably mean more price declines, Goldman Sachs Group Inc. analysts including Jeffrey Currie wrote in a report dated May 14.

Northern Trust cut its SPDR stake by 57 percent to 6.9 million shares, according to a filing dated May 1. The asset-management company, as a custodian, holds assets without discretion over how they are invested, Doug Holt, the head of global corporate communications, said yesterday in an e-mail.

“We made one change to our global tactical asset allocation policy this month: eliminating our tactical position in gold,” Jim McDonald, chief investment strategist in Chicago at Northern Trust, which oversees about $810 billion, said in a report on March 13.

BlackRock, the world’s biggest money manager, trimmed its holdings by half to 4.1 million shares, a filing dated April 12 showed. On May 9, Robert Kapito, president of the New York-based company, said that he would still buy the metal.

The large scale liquidation of gold exchange traded funds was confirmed today in the latest quarterly demand and supply statistics published by the World Gold Council.  Overall gold demand for the first quarter declined by a considerable 13% with outflows from gold ETFs accounting for the bulk of the decline.  During the first quarter there were outflows of 177 tonnes from global gold ETF holdings.

The sale by large speculators of the gold ETPs seem to be the trigger that set off last month’s decline in gold prices.  The drop in gold could turn out to be a temporary factor as other buyers eagerly absorb supply by adding to their gold holdings at lower prices.

Aside from the sale of gold by holders of exchange traded products, demand for gold in the first quarter remained robust.  The World Gold Council noted that almost every other category of gold demand increased even as supplies are being constrained by lower mine output.

  • Mine production of 1,052 tonnes during the first quarter showed no growth and supply from scrap gold declined due to the drop in gold prices.
  • Jewelry demand surpassed the previous quarter and hit a new record with sales of $28.9 billion.
  • Demand from India and China, who collectively consume 62% of global gold jewelry sales, increased by 15% and 19% respectively.
  • Physical bar and coin demand during the first quarter increased by 8% and 18% respectively.  Demand for gold bar and coins in China exploded to 110 tonnes, double the average of the last five year quarterly sales.
  • Central banks added 109 tonnes of gold to their reserves in the first quarter, accounting for 11% of total gold demand.  Central banks have increased their purchases of gold for nine consecutive quarters.

Wholesale liquidation of gold positions by very large and wealthy speculators adversely impacted gold prices this year.  As gold demand from virtually every other sector continues to grow, the increased gold outflows from ETFs will eventually be absorbed.  In addition, as central banks continue to print money on an unprecedented scale, it would not be surprising to see large investors once again pour money into the gold ETFs.

The Gold Crash – Why It Doesn’t Matter

Physical-GoldBy:  GE Christenson

The NASDAQ 100 index peaked at 1,485 in July 1998. It subsequently crashed to below 1,070 in October 1998, a loss of about 28%. But, it climbed back to nearly 5,000 in March 2000, a rally off the low of over 350% in 17 months.

The S&P 500 index peaked in October 2007 around 1,575. It subsequently crashed below 670 in March 2009, a loss of about 57%. But, it climbed back to nearly 1,600 in April 2013, a rally off the low of over 135% in 49 months.

Gold was priced at nearly $200 in January 1975. It subsequently crashed to about $100 in August 1976, a loss of about 50%. But, it climbed back to over $850 in January 1980, a rally off the low of over 750% in 41 months.

Crude oil peaked at over $147 in July 2008. It subsequently crashed to under $36 in December 2008, a loss of about 75%. But, crude climbed back to over $114 in May 2011, a rally off the low of over 210% in 29 months.

Natural gas exceeded $15 in December 2005. It subsequently crashed to under $5.50 in September 2006, a loss of over 64%. But, natural gas climbed back to over $13 in July 2008, a rally off the low of over 130% in 22 months.

Gold was priced at about $1,920 in August 2011. It subsequently crashed to about $1,350 in April 2013, a loss of about 30%. Gold will probably climb back to a large number in the relatively near future, a rally off the low that will be really impressive.

Silver climbed to over $48 in April 2011. It subsequently crashed to under $23 in April 2013, a loss of over 52%. Silver will probably climb back to a very large number in the relatively near future, a rally off the low that will be quite impressive.

Markets rally, correct, rally, and correct again. Some of the corrections are so severe we call them crashes. In the big picture, it hardly matters whether the crashes were accidental, encouraged, manufactured, or all three. In the big picture, what matters are the market fundamentals. After the correction, have the fundamental drivers of the market changed?

Important Questions for Gold & Silver Investors

    • Are the central banks of the world still rapidly expanding the money supply?
    • Are the derivatives and currencies bubbles in danger of crashing?
    • Are governments still spending much more than their revenues?
    • Are central banks, governments, and wealthy individuals continuing to buy gold?
    • Is total debt rapidly increasing?
    • Is consumer demand for gold and silver increasing?
    • Is faith in unbacked paper money decreasing?
    • Are faith and trust in banks and politicians decreasing?
    • Does the financial world appear to be more dangerous and unstable each year?
    • Are the above imbalances unlikely to improve in the next few years?

If YOUR answer to most of the above questions is “yes,” then regarding YOUR big picture perspective, gold and silver are probably very good investments, in addition to being valuable insurance in case some or all of the above imbalances do NOT resolve favorably and safely. Yes, this is likely to end badly.

The recent crash in silver and gold was one of many for the record books. But, gold is not the same as Enron stock. Tangible physical metals that have been a store of value for over 3,000 years are not the same as a paper promise made by less than reputable individuals and organizations. In the world today, it seems there are many disreputable individuals, corporations, and governments, all pushing paper. We have been warned!

History suggests we should side with 3,000 years of history during which gold and silver have been a store of value and the ultimate real money. History suggests that we should not trust our savings with either the paper pushers or their unbacked paper money.

For silver and gold investors, there are 3,000 years of history supporting your viewpoint and your commitment. There have been many rallies and crashes in both markets; but, even at their recent crash lows, the price of both is over five times higher than their lows in 2001. New highs will occur. Don’t let the paper pushers frighten you out of your investments.

GE Christenson
aka Deviant Investor

Worldwide Buying Frenzy of Gold and Silver Continues

Liberty Eagle
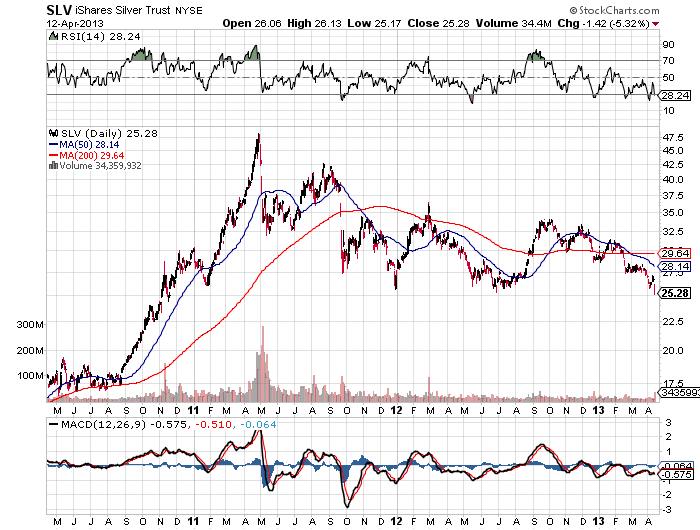
Don’t precious metal investors read newspapers?  Despite proclamations from the mainstream press that the bull market in gold and silver is over, a buying frenzy in precious metals is occurring worldwide.  The gold rush mentality to buy gold and silver at bargain prices has resulted in stock out conditions for many retail sellers of precious metals, including the U.S. Mint.

Intense gold demand in India has lead to shortages as Gold Buyers Throng Indian Stores for Second Week on Rally.

Gold consumers in India, the world’s biggest importer, thronged jewelry stores across the country for a second week on speculation that bullion may extend a rally after the biggest plunge in three decades.

“We waited for sometime to see if prices will fall more but when we saw them moving up again, we decided it’s time,” said Sripal Jain, a 77-year-old silver dealer who came with his younger brother, daughter and daughter-in-law to buy gold necklaces at Mumbai’s Zaveri Bazaar. “We don’t have any wedding or occasion coming up. The rates fell, so we decided to buy.”

Bullion slumped 14 percent in two days, reaching the lowest price in two years on April 16, triggering a frenzy among coin and jewelry buyers from the U.S. to India, China and Australia. The surge in demand has helped prices rally 11 percent since April 16, and jewelers in India are paying premiums of as much as $10 an ounce to secure supplies, according to the Bombay Bullion Association.

Gold will rally to $1,800 an ounce by December as skepticism over the global recovery increases demand, billionaire Indian jeweler T.S. Kalyanaraman said on April 19.

The rush to buy has led to a shortage in India and jewelers are paying premium of as much as $10 an ounce compared with $2 just 10 days earlier, said Bipin Jain, owner of Vimalson Jewellers and a vice president of the bullion association.

The Perth Mint reports that while the media is talking about the bear market in gold, bullion buying has soared as bargain hunters move in.  As gold and silver prices corrected, Perth Mint buyers viewed the situation as a perfect buying opportunity and stepped up their purchases of gold and silver.  Activity on the Perth Mint website was so intense, that some buyers experienced long delays.

As the central bank of Japan continues its unprecedented experiment in massive monetary expansion, the Japanese Seek Refuge in Bullion as Yen Slumps, Inflation Looms.

Japanese consumers are poised to become net buyers of gold for the first time in eight years as the yen’s decline and looming inflation drive them to seek refuge in bullion, according to Standard Bank Plc.

Net sales of gold bars and coins by Japanese individuals shrank to 10.1 metric tons in 2012, the smallest amount since 2005, data from the World Gold Council show. A surge in purchases this month and the chance to buy after bullion slumped into a bear market foreshadow a turnaround in 2013, said Bruce Ikemizu, Standard Bank’s head of commodities trading in Tokyo.

The currency has depreciated 13 percent against the dollar this year and is trading near a four-year low after the central bank’s pursuit of unprecedented monetary easing to end deflation was unopposed by Group of 20 nations. Inflation may rise above 1 percent in the 12 months starting April 2014 and approach a 2 percent target as early as that year, Bank of Japan (8301) policy board member Ryuzo Miyao said April 18.

“The time has come for Japanese to buy gold with the government trying to engineer inflation,” Ikemizu, who has traded commodities for almost three decades, said in an interview in Tokyo yesterday. “Retail investors are turning from sellers to buyers of bullion.”

In India and China, the biggest gold-consuming nations, shoppers last week lined up in bazaars from Mumbai to Shanghai to buy the metal for brides, babies and strongboxes after prices fell. Indian consumers bought a net 312.2 tons of gold bars and coins in 2012, while purchases by individuals in China reached 265.5 tons, according to the World Gold Council.

The long term rationale for owning gold and silver remains intact.  The reasons for the recent smash-down in gold and silver may never be known but it has provided a gift opportunity to increase positions in gold and silver.

Biggest Loser In April Gold Crash Sees $53 Billion Vanish

coinThe stunning and unprecedented April gold crash has staggered investors with huge losses.  Over the course of the first two weeks of April gold has declined by $203.50 or almost 13%.  Since the beginning of the year, gold has crashed $313.75 or 18.5%.

So who was the biggest loser in the gold market?  That distinction belongs to the U.S. Treasury which allegedly holds 261.5 million troy ounces of gold.  The April decline wiped out $53.2 billion and the value of U.S. gold holdings have declined by $134.7 billion from the early September 2011 peak closing price of $1,895.

Central bank holdings of gold have declined by over half a trillion dollars since the 2011 high.

Central banks are among the biggest losers because they own 31,694.8 metric tons, or 19 percent of all the gold mined, according to the World Gold Council in London. After rallying for 12 straight years, the metal has tumbled 28 percent from its September 2011 record of $1,923.70 an ounce.

Investors are dumping gold funds at the fastest pace in two years in favor of equities, compounding a slump that has wiped $560 billion from the value of central bank reserves.


The losses to private gold investors, who own about 80% of above ground gold, exceeds the gross domestic product of most countries.  Privately owned gold totals about 4.4 billion ounces and the price decline since late 2011 translates into a loss of wealth of $2.27 trillion.

courtesy: kitco.com

courtesy: kitco.com

So where does gold go from here?  Sophisticated investors know better than to sell after a market crash.  Even after the recent flash crash, gold has appreciated 410% since 2001 compared to only an 18% increase in the S&P 500.  It would not be surprising to see a repeat of this performance over the next decade.

Physical Gold Inventories Plunge As Gold Market Crashes – How Can That Happen?

worldKyle Bass recently summed up the thoughts of many gold investors when he said “the largest central banks in the world, they have all moved to unlimited printing ideology.  Monetary policy happens to be the only game in town.  I am perplexed as to why gold is as low as it is.  I don’t have a great answer for you other than you should maintain a position.”

Gold investors can easily be forgiven for being perplexed, especially when considering that gold prices are plunging at a time when stocks of physical gold are being rapidly depleted at the COMEX warehouses.  Is this just one of life’s unsolvable mysteries or is the gold market being manipulated?  Bill Downey at Gold Trends lays out a solid case on how market manipulation caused last week’s gold collapse and why it makes more sense than ever to increase holdings in physical gold and silver.


There’s been a recent huge draw down of physical gold at the New York COMEX and at the JP Morgan Chase depository. Look at the physical market draw down on the charts below. It has taken a drastic plunge.HOUSTON — we have a problem.Physical inventory drawdown at JPM
Charts by Nick Laird of www.sharelynx.com

GoldInventoryJPMAPril2013
Physical Drawdown at COMEX
Charts by Nick Laird of www.sharelynx.com
GoldInventoryComexApr2013
You can imagine the dilemma this is causing for the market interests behind these inventories. If the inventory runs out and one cannot meet deliveries then it has to be bought on the open market. Not only that but it could cause a run up in prices that would hurt the shorts in the market.So what to do?There is only one way out of this for the market controllers would be to devise a plan that would collapse the market and trip up all the stops at the correction lows in gold of 1525 thereby setting off the stop loss orders under this important market low. And what if the plan included a way to stop the physical market from purchasing gold under 1525 while that correction was underway?

And how can that happen?

They have to hatch out a plan and carefully orchestrate it in a series of events that takes the gold market by surprise and force the players out of their positions.

Read on for today’s lesson in market manipulation and allow me to relay my speculation about what transpired last week.

A successful ambush usually involves surprise.

One of the main new weapons in the FEDS arsenal is TRANSPARENCY.

After a lifetime of silence the FED all of a sudden has come out of the closet and has decided that the best thing for the market is to be transparent and to that end they now have televised communication meetings with the general public so chairman Bernanke can explain the FED policy and answer any questions that the market has on its mind as well as the usual minutes that get released to the markets that review the policy decisions and discussion of prior meetings.

Why does the Fed need to explain what they are doing now?

Well it isn’t because everything is going just fine. Put it this way. They must figure when you have 50 million people on food stamps and the Dow Jones is going up a few hundred points a week and making all time highs and you have 16 trillion dollars in debt and interest rates are zero, its best to have a communiqué every month before someone asks you to explain what is going on. It’s called staying ahead of the curve if you will. If you tell them what’s going on it makes it look like you know what you’re doing. Otherwise all we have is the statistics and by themselves they tell you something is wrong, something is terribly wrong. So they have become transparent.

During the last communiqué the chairman made it abundantly clear that QE was here to stay until the unemployment rate reached acceptable levels. This communiqué whether by personal appearance or by releasing the FOMC minutes of the prior meeting is something the FED relies on so market participants can remain comfortable and abreast of Fed monetary policy.

Three strikes and you’re out

The FOMC minutes from the last meeting were due for release during last week. But a funny thing happened. They got released EARLIER than expected. It was all a big mistake and the FED let the SEC and the CFTC know right away that the error had occurred. And lo and behold even with all its transparency there happened to be some language we didn’t get updated on until the FOMC minutes were released. The notes say that several members have been discussing cutting back on the stimulus. That was strike one. It got the gold market thinking that stimulus cuts might be coming.

Strike one

Surprise number two

Then a bombshell was released from news sources. It was reported that Cyprus would have to sell 400 million Euro’s of gold as part of the bailout package of raising money for their failed banking system. Gold prices came down to 1550 on the news and the day passed by. Even though Cyprus bankers tell us the next day that they didn’t discuss selling any gold, market jitters seemed to remain and Friday was just around the corner. This was strike two.

Now we need a strike three and you’re out. Gold is a nervous market to begin with as a lot of people have already lost a lot of money in the last six months.
With Gold at 1550, all that is needed for the market to drop is to get one more push where all the stops are (just below the 2 year low of 1525).

The selling began in the Friday sessions overseas. By time we got to the New York COMEX gold open, the price was down to 1542. Now all the players are there and the volume and liquidity is there to create the final blow to the market.

And then the attack began. Wave after wave of selling until gold got to 1525. Then they break down the price below the two year low and all the stops that have been accumulating there start getting tripped up and the selling accelerates as it begins to feed on itself. The physical market for gold sees this as a gift and gets ready to make their move and buy up the gold.

Now comes the part that is pure genius or a total coincidental thing that just so happens to be a gift to those who are short the market and those who would be responsible to deliver gold should the inventory deplete.

ALL OF A SUDDEN THE LONDON PHYSICAL PLATFORM THAT BUYS AND SELLS PHYSICAL GOLD GETS LOCKED UP. THE SYSTEM FREEZES.

continue reading here.


Panic Selling Crushes Gold and Silver Prices – Bearish Sentiment Reaches Extreme Levels

goldThe precious metal markets, which have been under a constant drumbeat of negative news and bearish price forecasts for months, sold off sharply today.   Bearish investors seemed to reach the “give up” stage as gold and silver fell below key technical levels.  Panic selling continued to cascade throughout the day as precious metal investors hit the sell button and buyers stepped aside.

By the end of the trading day, gold dropped an astonishing $84 per ounce to close at $1,478, down over 5% on the day and below $1,500 per ounce for the first time since July 5, 2011.   Silver had an even worse day with a price decline of 6.5%, closing down $1.81 per ounce at $25.95.

Analysts had multiple reasons for the huge decline in gold and silver prices including the belief that inflation will remain subdued and the Federal Reserve would begin to slow the pace of monetary stimulus later this year.  In addition, many trend following investors are repositioning out of precious metals into other investment opportunities such as stocks which have appreciated by over 100% since the depths of the financial crisis.  By contrast, gold and silver  have been unable to breach highs reached in mid 2011.

Also weighing on investor’s mind was the fear that the proposed sale of over $500 million of Cyprus gold reserves would further pressure gold prices.  Comments in the Wall Street Journal suggested that other countries may also be forced to sell their gold reserves.

The news about Cyprus “gets people to wonder: Will there be central-bank liquidation of gold when other countries get into trouble?” said Adam Klopfenstein, senior market strategist with Archer Financial Services in Chicago. “Selling gold might be the new caveat for any future [bailout] deals.”

The match that ignited the explosive move to the downside was struck on Wednesday when Bloomberg reported that Goldman Sachs predicted sharply lower gold prices and suggested that investors actually short the gold market.

The turn in the gold price cycle is accelerating after a 12-year rally as the recovery in the U.S. economy gains momentum, according to Goldman Sachs Group Inc., which reduced forecasts for the metal through 2014.

The bank cut its three-month target to $1,530 an ounce from $1,615 and lowered the six- and 12-month predictions to $1,490 and $1,390 from $1,600 and $1,550. Goldman recommended closing a long Comex gold position initiated on Oct. 11, 2010 for a potential gain of $219 an ounce, analysts Damien Courvalin and Jeffrey Currie wrote in a report today.

“Despite resurgence in euro-area risk aversion and disappointing U.S. economic data, gold prices are unchanged over the past month, highlighting how conviction in holding gold is quickly waning,” the Goldman analysts wrote in the report. “While higher inflation may be the catalyst for the next gold cycle, this is likely several years away.”

Goldman cut its 2013 gold estimate to $1,545 an ounce from $1,610, trimmed its 2014 forecast to $1,350 from $1,490, and set year-end targets of $1,450 in 2013 and $1,270 in 2014. Goldman recommended starting a short Comex gold position, targeting $1,450 with a stop at $1,650, the analysts wrote.

Ironically, the biggest worry for gold and silver investors now comes from the precious metal ETFs, which greatly contributed to the precious metals bull market as investors poured billions of dollars in the SPDR Gold Shares (GLD) and the iShares Silver Trust (SLV).  If investors in the GLD and SLV initiate panic liquidations, a sharp rebound in gold prices may be wishful thinking despite today’s huge sell off.  According to Goldman Sachs,  “The fall in prices could end up being faster and larger than our forecast, as aggregate speculative net long positions across Comex futures and gold ETFs remain near record highs.”

COURTESY: STOCKCHARTS.COM

COURTESY: STOCKCHARTS.COM

COURTESY: STOCKCHARTS.COM

COURTESY: STOCKCHARTS.COM

The bearish sentiment and price action on gold and silver seemed to have reached extreme levels.  Does anyone hear a contrarian bell ringing?

Hedge Funds Record Short Gold Positions Is A Bullish Contrary Indicator

The deluge of bearish articles on gold continues with a Wall Street Journal article entitled “Money Managers Shorting Gold In Record Numbers.”

Hedge funds and other investment managers held a record number of bets on lower gold prices on the main U.S. gold exchange, according to data released Friday by the Commodity Futures Trading Commission.

Managers tracked by the commodity regulator boosted their bets on lower Comex-traded gold futures and options by 33%, to 65,617 contracts, during the week ended Tuesday. That is the most in weekly CFTC data going back to June 2006.

The tone of the Journal article suggests that gold investors should be worried about bearish hedge fund positions.  However, when you look a little deeper into this situation, it’s actually another bullish contrary indicator for gold and here’s why – hedge funds have put up miserable performance numbers not just last year, but for the past decade.

According to Business Insider, an investor in a hedge fund would have been better off in a simple index fund.

The past year has been another mediocre one for hedge funds. The HFRX, a widely used measure of industry returns, is up by just 3%, compared with an 18% rise in the S&P 500 share index. Although it might be possible to shrug off one year’s underperformance, the hedgies’ problems run much deeper.

The S&P 500 has now outperformed its hedge-fund rival for ten straight years, with the exception of 2008 when both fell sharply. A simple-minded investment portfolio–60% of it in shares and the rest in sovereign bonds–has delivered returns of more than 90% over the past decade, compared with a meagre 17% after fees for hedge funds (see chart). As a group, the supposed sorcerers of the financial world have returned less than inflation. Gallingly, the profits passed on to their investors are almost certainly lower than the fees creamed off by the managers themselves.

Now that we have the facts on hedge fund performance, we realize that what appears to be a slanted bearish article on gold is in reality another contrary bullish indicator for future gold price performance (also see Financial Advisors Bearish On Gold Represents Buy Signal).

Gold At $10,000 – Silver At $400 – Here’s How It Will Happen

By GE Christenson:

This is not a prediction of future prices of gold and silver; it is an indication of what could happen in a speculative bubble environment based on the history of previous bubbles.

I’ll summarize a simple analysis of past bubbles.

Definitions

    • Bubble: A speculative mania in a market that is priced well beyond what the fundamentals and intrinsic value indicate.
    • Phase 1: The first phase of the bubble begins with the price bottoming and initiating a long rally. It is often indicated by a triggering event such as Nixon closing the “gold window” on August 15, 1971 – the beginning of the gold and silver bubbles that terminated in 1980. The market rallies for some years, hits a new “all-time” high, and then corrects.

When the market proceeds into a bubble phase, it rallies beyond that new high and continues much higher. The end of phase 1 and the beginning of phase 2 are the point at which the market rallies from its correction low and exceeds its previous high. See the graph of the silver market with the indicated beginning and end points for phase 1 and phase 2.

  • Phase 2: The final phase of the bubble starts when the price exceeds the “new high” and then rallies to a much higher and unsustainable level.

Click on image to enlarge.

I looked at the time and price data for the South Sea Bubble in England from 1719 -1720, the silver bubble from August 1971 to January 1980, the NASDAQ bubble from August 1982 to March 2000, the Japanese Real Estate bubble from 1965 to 1991, the gold bubble from August 1971 to January 1980, and the S&P mini-bubble from August 1982 to March of 2000. A spreadsheet will not display well, so I’ll list my results. Please realize that all prices and dates are approximate – this is “big picture” analysis.

The conclusion is that bubbles start slowly and then accelerate to unsustainable highs (on large volume) that are largely created by greed and fear but not fundamental evaluations. Bubbles generally follow the “Pareto Principle” where approximately 80% of the price move occurs in the LAST 20% of the time. Consider:

South Sea Bubble: (Extreme price bubble)

  • Phase 1: January 1719 to March 1720. Price from $120 to $180.
  • Phase 2: March 1720 to July 1720. Price from $180 to $900.
  • Time: Phase 1 – 75%, phase 2 – 25%.
  • Price: Phase 1 – 8%, phase 2 – 92%. Phase 2 price ratio: 5

Silver Bubble: (Extreme price bubble)

    • Phase 1: August 1971 to March 1978. Price from $1.50 to $6.40.
    • Phase 2: March 1978 to January 1980. Price from $6.40 to $50.
    • Time: Phase 1 – 78%, phase 2 – 22%.
    • Price: Phase 1 – 10%, phase 2 – 90%. Phase 2 price ratio: 7.8


NASDAQ Bubble: (Extreme price bubble)

    • Phase 1: August 1982 to February 1995. Price from $168 to $780.
    • Phase 2: February 1995 to March 2000. Price from $780 to $4,880.
    • Time: Phase 1 – 71%, phase 2 – 29%.
    • Price: Phase 1 – 13%, phase 2 – 87%. Phase 2 price ratio: 6.3


Japanese Real Estate Bubble: (approximate numbers)

    • Phase 1: 1960 to 1979. Price Index from 4 to 50.
    • Phase 2: 1979 to 1991. Price Index from 50 to 225.
    • Time: Phase 1 – 61%, phase 2 – 39%.
    • Price: Phase 1 – 21%, phase 2 – 79%. Phase 2 price ratio: 4.5


Gold Bubble:

    • Phase 1: August 1971 to July 1978. Price from $40 to $200.
    • Phase 2: July 1978 to January 1980. Price from $200 to $870.
    • Time: Phase 1 – 82%, phase 2 – 18%.
    • Price: Phase 1 – 19%, phase 2 – 81%. Phase 2 price ratio: 4.4


S&P Bubble: (Mini-bubble)

    • Phase 1: August 1982 to February 1995. Price from $100 to $483.
    • Phase 2: February 1995 to March 2000. Price from $483 to $1,574.
    • Time: Phase 1 – 71%, phase 2 – 29%.
    • Price: Phase 1 – 26%, phase 2 – 74%. Phase 2 price ratio: 3.3


Summary

Bubbles tend to follow the 80/20 ratio indicated in the Pareto Principle. Phase 1 takes approximately 70-80% of the time and covers approximately 10-20% of the total price change. Phase 2 accelerates so that it takes only 20-30% of the time but covers 80-90% of the price change. Extreme bubbles such as the South Sea Bubble and the Silver bubble experience approximately 90% of the price change in the 2nd phase. The ratio of the phase 2 ending price to beginning price is typically 4 to 8 – a huge price move. Such bubbles are rare; the subsequent crash is usually devastating.

Future Bubbles

In the opinion of many analysts, sovereign debt is an ongoing bubble that could burst with world-wide consequences. Should deficit spending and bond monetization (Quantitative Easing) accelerate in the next several years, as seems likely, that sovereign debt bubble will inflate further. Because of the massive printing of dollars, the value of the dollar must fall, particularly against commodities such as oil, gold, and silver. As the purchasing power of the dollar falls, an increasing number of people will realize their dollars are losing value, and those people will seek safety for their savings and retirement. Gold and silver will benefit from an increasingly desperate search for safety as a result of the decline of the dollar. Assuming the 80/20 “rule” and the phase 2 price change ratio of approximately 5, what could happen if gold and silver rise into another speculative bubble?

Assume that silver began its uptrend in November 2001 at $4.01 and that gold began its move in April 2001 at $255. Silver rallied to nearly $50 in 2011, and gold also rallied to a new high of about $1,900 in 2011. Assume that both surpass those highs about mid-2013 and accelerate into phase 2 thereafter. Using these assumptions, phase 1 for silver would measure 12.5 years and phase 2 could last until approximately late 2016 – early 2017. If we assume that phase 1 was a move from $4 to $50 and that represents 19% of the total move, the high could be around $250. The ratio of phase 2 ending price to beginning price would be 5:1 – reasonable.

Indications for gold suggest a similar end date and a phase 2 bubble price of perhaps $9,000 per ounce. The ratio of phase 2 ending price to beginning price would be 4.7:1 at $9,000.

The gold to silver ratio at these bubble prices would be approximately 36, much higher than the ratio from 1980. Perhaps silver would “blow-off” higher, like it did in 1980, and force the gold to silver ratio lower or perhaps gold might not rally so high. Time will tell.

Outrageous?

Well, yes, at first glance, those prices do seem outrageous. But consider for perspective:

  • Apple stock rose from about $4 in 1997 to over $700 in 2012.
  • Silver rose from $1.50 to $50.00 in less than 10 years.
  • Gold rose from about $40 to over $850 in less than 10 years.
  • Crude oil rose from less than $11 in 1998 to almost $150 in 2008.
  • The official US national debt is larger than $16,000,000,000,000. The unfunded liabilities, depending on who is counting, are approximately $100,000,000,000,000 to $230,000,000,000,000. Divide $200 Trillion by approximately 300,000,000 people and the unfunded debt per capita of the United States is approximately $700,000. That is outrageous!
  • The official national debt increases in excess of $3,000,000,000 per day, each and every day. The unfunded liabilities increase by perhaps five – ten times that amount. Outrageous!
  • We still pretend the national debt is not a problem and that it will be “rolled over” forever. That is outrageous.
  • Argentina has revalued their currency several times in the last 30 years – they have dropped 8 zeros off their currency since 1980. Savings accounts and the middle class were devastated several times. It can happen again.

Given the above for perspective, is gold at $5,000 to $10,000 per ounce unreasonable or impossible? Is silver at $200 to $400 per ounce unreasonable or impossible? Past bubbles have had an ending price 4 – 8 times higher than the phase 2 beginning price, so history has shown that such prices for gold and silver are indeed possible. Possible is not the same as certain – but these bubble price indications are certainly worth your consideration.

Would you prefer your savings in gold, silver, or a savings account? Read Ten Steps to Safety.
GE Christenson
aka Deviant Investor

Gold Has Outperformed Housing By 600% Since 2001

Anyone predicting that gold would outperform housing in 2001 would likely have been viewed as being seriously deranged.  After all, housing prices had increased for decades and by the peak of the housing market in 2007, real estate was believed to be a “can’t lose investment.”  The mantra that housing values only go up proved to be disastrous for many Americans as the over-leveraged real estate market imploded, shattering the wealth dreams of both naive homeowners and investors.

Despite the trillions of dollars of direct support from both the Federal Reserve and Congress, real housing values have yet to recover a fraction of their losses.  Mainstream press reports of a solid recovery in housing markets usually neglect to mention, that according to the Case-Shiller National Index, housing prices are still lower than they were at the turn of the century.

Courtesy: calculatedriskblog.com

Gold, meanwhile, unloved and ignored by most Americans is set to make its 12th straight annual gain.  From a yearly low of $255 per ounce during 2001, gold settled in New York trading on Thursday at $1,663.90, up 653% over the past 12 years.

Chart of the Day has some interesting data on the performance of gold versus housing, as represented by the Home Price/Gold Ratio.  Based on current prices, 105 ounces of gold will buy you the median priced single family home.  In 2001, a home buyer would have needed 601 ounces of gold to buy the same house.  Housing, when priced in gold, in down 80% from 2001.

Courtesy: chartoftheday.com

Despite gold’s proven ability to preserve wealth over time, most Americans still seem indifferent to allocating part of their portfolios into gold – something to think about as central banks ramp up the printing presses at an increasingly furious pace.

Gold and Stocks Diverge As Central Banks Pledge Unlimited Money Printing

Both the Federal Reserve and the Bank of Japan have gone all in with their attempts to revive weak, debt burdened economies with a pledge of unlimited money printing.

Japan’s incoming Liberal Democratic Party Prime Minister Shinzo Abe, who ran on a platform of unlimited quantitative easing and higher inflation, has quickly forced capitulation by the Bank of Japan to surrender its independence from political influence.

The Bank of Japan pledged Thursday to review its price stability goal, admitting that the move was partly in response to incoming Prime Minister Shinzo Abe’s aggressive calls for the central bank to step up its fight against deflation.

At its two-day policy board meeting, the BOJ decided to expand the size of its asset-purchase program—the main tool of monetary easing with interest rates near zero—and promised to review next month its current inflation goal, something Mr. Abe demanded during Japan’s parliamentary campaign.

Countering speculation that the board’s decision-making process is being driven by politicians, Gov. Masaaki Shirakawa said the bank reviews its price goal every year. But he acknowledged that the policy board had taken Mr. Abe’s request into account.

The Bank of Japan’s quick surrender of monetary policy independence reflected the fact that they had little choice in the matter.  Mr. Abe had previously threatened a  “law revision to take away the BOJ’s independence if it didn’t comply with his demands.  Mr. Abe said the election shows that his views have the support of the people, and, on the night of his victory, he specifically said he expected the BOJ to do something at this week’s meeting.”

The policy of unlimited money printing by Japan came shortly after similar actions were announced by the U.S. Federal Reserve in early December.  Fed Chairman Ben Bernanke, architect of the U.S. “economic recovery” announced that the Fed would purchase $45 billion of US Treasuries every month in addition to the open ended monthly purchase of $40 billion of mortgage backed securities.  The Fed’s expanded “asset purchase programs” will be monetizing over $1 trillion of assets annually, effectively funding a large portion of the U.S. government’s annual deficit with printed money.

The impact of blatantly unlimited money printing by two of the world’s largest economies surprised many gold investors as the price of stocks and gold quickly diverged, with gold selling off and stocks (especially in Japan) gaining.

Why would gold, the only currency with intrinsic value that cannot be debased by governments, sell off as governments pledged to flood the world with freshly printed paper currencies?  Here’s one insight from John Mauldin.

When you reduce the amount of leverage in the system, you’re actually reducing the total money supply. So the Fed can come in and print money, and the money supply – the total amount of credit and leverage and material that’s going through the system – really hasn’t increased.

A lot of monetary economic theories say “the money supply is directly related to inflation.”

It is, but the amount of leverage and credit in the system is also directly related to inflation. It becomes a much more complicated mix. What happens at the end of the debt supercycle, as you’re reducing that leverage, you’re actually in a deflationary world. That is the whole debate between deflation and inflation.

If you read the polls in the United States, we’re just totally dysfunctional. We want to pay less taxes and we want more health care – that doesn’t work. We are going to have to be adults and recognize that problem.

The reason is the Fed is going to do everything they can to fight deflation. The only thing they can do is to print money. They’re going to be able to print more money than any of us can possibly imagine and get away with it without having inflation.

Mr. Mauldin may have a valid point, but a more likely explanation is the suppression of gold prices by governments and central banks as voluminously documented by GATA.

“Those who follow GATA may not be surprised when the monetary metals markets don’t make sense, since they really aren’t markets at all but the targets of constant intervention by governments.”