March 19, 2024

Gold ETF Holdings Surge in 2022

The SPDR Gold Shares Trust (GLD) continues to power higher in 2022 with a year-to-date gain of 7.5%.  The value of gold holdings of the GLD from the beginning of the year increased by over $11 billion to $68.13 billion.  Total gold held in trust by the GLD now amounts to over 1,106 tonnes.

The GLD hit an all time high during early March when it reached $191.50.  The demand for gold has increased due to of control inflation, a war in Europe that is spinning out of control, rampant money printing by the Federal Reserve and reckless spending by the Federal government.

Here are some basic facts about the GLD:

  • An investment in GLD allows investors to purchase an interest in gold without the costs of purchasing, transporting, insuring and storage of gold bullion or coins.
  • The fund expenses of the GLD are a modest 0.40% and allow an investor to purchase gold in whatever amount is desired, saving the cost of commissions and shipping on gold bullion.
  • The GLD does not give the buyer the right to receive gold bullion in lieu of shares purchased.
  • Purchases and sales can be done at any time during the trading day.  The GLD has excellent liquidity and the discount or premium from the value of gold bullion held is usually minimal.

Gold has been going steadily upwards since 2016 with minor pullbacks during 2018 and 2021.

The return on the GLD from date of inception on November 18, 2004 has been 8.36%.  In an uncertain world future returns look brighter every day.


Gold Plunges After Swiss Voters Reject Central Bank Gold Buying

SNBGold can’t catch a break lately as Swiss Voters Reject Measure Forcing SNB to Acquire More Gold.

Swiss voters rejected a measure in a referendum requiring their central bank to hold a portion of its assets in gold, a measure its President Thomas Jordan termed an “invitation to speculators” that could have hurt the economy. Bullion tumbled to a three-week low.

The “Save Our Swiss Gold” proposal stipulating the Swiss National Bank hold at least 20 percent of its 520-billion-franc ($540 billion) balance sheet in gold and never sell any bullion was voted down by 77 percent to 23 percent, the government said yesterday. Polls had forecast the initiative’s rejection. Two other initiatives on tax privileges for foreign millionaires and immigration limits also were rejected.

SNB policy makers estimated they would have needed to buy 70 billion francs worth of gold if the referendum had passed. Some economists estimated the SNB wouldn’t have had to sell euros to meet the requirement, given its dollar holdings. At the end of the third quarter, it held 45 percent of its 460 billion francs of foreign currencies in euros and 29 percent in dollars.

Even though the Swiss gold referendum was expected to be defeated gold prices plunged by over $38 per ounce in late Sunday trading and silver was pulverized with prices down almost 8%.

As stocks and bonds continue to soar on liquidity provided by central bank quantitative easing investors have been dumping gold by the tons from their portfolios.  The Swiss Gold Rejection simply gave investors another reason to stay away from gold which has been in a vicious bear market.

Gold has lost 19 percent since peaking in March and investor holdings of exchange-traded products are near a five-year low. While prices probably won’t be affected too much by the “no” vote of the initiative called “Save Our Swiss Gold,” approval would have improved sentiment and increased prices by as much as $50 an ounce, HSBC Holdings Plc estimated in November.

“Gold had received some support in the last couple of weeks” before the vote, Georgette Boele, an analyst at ABN Amro Bank NV in Amsterdam, said by phone. “We’ll get more pressure on gold. The overall outlook is not looking great.”

2014-proof-gold-eagle

Even the surprise news that India had ended curbs on gold imports did nothing to support prices.  In a bear market all news is bad and gold can’t seem to find a support level.  The irony of it all is that the massive euro holdings of the Swiss National Bank were purchased with Swiss francs manufactured out of thin air by the SNB to prevent its currency from appreciating against the euro.  Governments world wide have turned an experiment with quantitative easing into  national policy and are churning out trillions of dollars of printed fiat currencies.  Last I heard the value of anything depreciates as the quantity increases.  Although it’s a tough market right now, long term I’m betting that it’s a smart move to have some gold on hand.

American Eagle Gold Bullion Coin Sales Soar 132% In September

gold-bullionDespite the ongoing slump in the price of gold, buyers of physical gold seem to sense that gold has reached bargain levels.  The September sales report from the US Mint shows that sales of the American Eagle gold bullion coins soared by 132% over the previous month.

September sales of gold bullion coins totaled 58,000 ounces, up from 25,000 ounces in August and 13,000 ounces last year.  Sales of gold bullion coins reached the highest level of the year since January when the Mint sold 91,500 ounces.

Despite the monthly increase, sales of gold bullion coins remain weak compared to previous years.  Year to date 2014 sales total 379,000 ounces compared to 704,000 ounces in the comparable prior year.

Gold has reached what some think is a critical support level in the $1200 range, a point from which gold has rebounded three times in the last two years.

Courtesy: Kitco.com

Courtesy: Kitco.com

With the stock and bond markets delivering robust returns to investors due to the unprecedented easy money policies of the Federal Reserve interest in gold has diminished greatly.  History has shown time and again that the best time to invest in an asset class is when the crowd thinks there is no reason to buy.

Sales of gold bullion coins have been steadily declining since 2009 when sales soared to almost 1.5 million ounces.  Sales of gold bullion coins by year since 2000 are shown below.

Based on the present sales rate of the American Eagle gold bullion coins, total sales for 2014  could drop to the lowest level since 2007.

Gold Bullion Coin Buyers Go On Strike – Sales Drop Again in August

1986-gold-eagleSales of the US Mint American Eagle gold bullion coins slumped again in August following the fall off in demand seen in July.   August sales of 25,000 ounces dropped by 16.6% or 5,000 ounces from July’s total of 30,000 ounces.

Although August 2014 sales of the gold bullion coins was more than double the 11,500 ounces sold in August 2013 the overall sales trend of American Eagle gold bullion coins has been in a steep slump during 2014 compared to the previous year.  Year to date sales of the gold American Eagle bullion coins as of August 31, 2014 totaled 321,000 ounces, a decline of almost 54% from comparable year sales of 691,000 ounces.

The price weakness in gold prices seen during 2013 continued this year as Gold Demand Falls 16% as Jewelry Purchases Decline 30%.

Gold demand fell 16 percent in the second quarter, led by declines in India and China, the World Gold Council said.

Global demand slipped to 963.8 metric tons from 1,148.3 tons a year earlier as jewelry purchases fell to the lowest since the fourth quarter of 2012, the London-based council said today in a report. China fell behind India as the largest consumer, with global jewelry buying dropping 30 percent and bar and coin demand down 56 percent. Mining companies hedged 50 tons as they continued selling future output.

Gold slid 28 percent in 2013, the most in three decades, as investors lost faith in the metal amid expectations U.S. policy makers would cut stimulus as the economy strengthens. Last year’s price drop spurred jewelry, coin and bar demand, particularly in China. Indian bullion buying has slowed as the government restricted imports to curb a current account deficit.

Global jewelry demand declined to 509.6 tons in the latest quarter, the least since the final three months of 2012. China’s purchases slipped 45 percent and those in India fell 18 percent, with the countries together accounting for almost 60 percent of world jewelry consumption. Buying rose 15 percent in the U.S. and 21 percent in the U.K. as consumer confidence rose, it said.

Global bar buying slumped 57 percent to 212.1 tons in the three months through June and coin demand slid 50 percent to 46.3 tons. Global consumer demand was down 42 percent to 784.9 tons, according to the report.

Total consumption in China, which overtook India as the biggest user last year, dropped 52 percent to 192.5 tons, the council said. Indian demand fell 39 percent to 204.1 tons, returning as the largest purchaser on a quarterly basis for the first time since the end of 2012.

The decline in demand for gold seems to be feeding upon itself as lower prices beget lower demand.  As gold prices climbed towards $2,000 an ounce during 2011 buyers tripped over each other to get into gold.  Ironically, buyers have now gone on strike as gold has become available at bargain prices.

The sale of gold bullion coins has been in a downward slump since 2009 when sales soared to record levels during the height of the financial meltdown.  There are many things happening in the world today that cause serious people to think that 2009 was just a warm up for what’s to come next – if this is correct, the demand for gold could turn sharply higher in a very short period of time.

Total gold bullion coin sales through August 2014 are shown below.

Based on the year to date figures, gold bullion coin sales could well end the year at about half of 2013 totals.

Soaring Gold and Silver Prices Should Not Be a Surprise to Anyone

bars-of-goldThe precious metal markets caught on fire in a big way today.  Gold prices surged the most in nine months by over $40 per ounce and silver closed in on $21 per ounce.  After losing 28% last year as short term hot money investors sold out their holdings, gold and silver were ready for a huge rally from both a fundamental and technical standpoint (see Why Gold and Silver Could Outperform Every Other Asset Class in 2014).

Precious Metals June 19, 2014

METALS PRICE CHANGE PER CENT GAIN
GOLD $1319.00 +40.50 3.17%
SILVER $20.89 +0.88 4.45%
PLATINUM $1472.00 +24.00 1.66%
PALLADIUM $841.00 +12.00 1.46%

The reasons for today’s huge gains in precious metals varied in the mainstream press but soaring prices should have been no surprise to long term investors who understand why gold and silver should be a part of every portfolio.

Gold and silver constitute a fundamental defense for wealth preservation against the rapidly eroding value of paper currencies backed by broke governments which is Why All Governments Hate Gold.

The various governments of the world and their central banks produce and distribute a product – paper currencies. Those currencies are backed by confidence, faith, and credit, but not by gold, oil, or anything real. Those currencies are digitally printed to excess, since almost all governments spend more than their revenues. The UK, Japan, and the USA are prime examples.

Politicians want to spend more money, but they also need to maintain the illusion that the money is still valuable, that it will retain most of its purchasing power over time, and that inflation is under control. The illusion weakens when food, gasoline prices, and other consumer goods are wildly rising in price. At a more abstract level, gold indicates the same lack of confidence in the printed pieces of paper that our central banks distribute.

If last year’s price correction shattered your conviction in owning gold and silver please consider The Fundamental Reasons for Owning Gold and Silver Are Stronger Than Ever.

One of the best methods for protecting wealth against a constantly depreciating paper currency is to own precious metals.

The bull case for precious metals remains intact as central bankers worldwide have become the lenders of last resort for nations that have exhausted their borrowing capacities.  Very little has changed since 2008 when the world financial system stood at the abyss of collapse.  Unsustainable debt levels continue to increase even as the capacity to service the debt diminishes.

Virtually every government in the world has taken on debts and liabilities that are clearly unsustainable.  Governments “don’t go broke” is the sustaining mantra for those with faith in paper currencies but governments do and will continue to print money that accelerates the loss of purchasing power of fiat currencies.  Please consider the following charts courtesy of John Mauldin Economics.

Eventually, as people realize that the central bank emperors have no clothes it will become clear Why There is No Upside Limit for Gold and Silver Prices.

The increase in the value of gold and silver is due to the fiscal and monetary policies of nations struggling to deal with massive levels of debt – policies that virtually guarantee a continued rise in the price of gold and silver.  Central banks, having exhausted all conventional means of monetary easing, have moved on to the last resort option of quantitative easing and currency debasement.

Government officials argue that unprecedented deficit spending and quantitative easing are necessary to stimulate economic  growth, but this theory has not worked in the real world.  Despite trillions in stimulus spending,  job creation and economic growth have been extremely weak and are likely to remain so according to economists Kenneth Rogoff and Carmen Reinhart who wrote This Time Is Different: Eight Centuries of Financial Folly.  According to Rogoff and Reinhart, economic growth is subpar when public sector debt exceeds 90% of GPD which the U.S. and many other developed nations have already surpassed.  In addition, a recovery of the job and housing markets after a financial crisis take many years due to the burden of excessive levels of debt.  Ultimately, Rogoff and Reinhart predict that austerity measures will need to be imposed along with some type of debt restructuring.

Is the U.S. capable of reducing spending and  instituting austerity measures? Cutting deficits means cutting payments to a long list of incomeless recipients who really don’t care where the entitlement money comes from.  Those still actually paying taxes will object strongly to any proposed tax increase to fund government spending.  Unable to cut spending or raise taxes leaves the Government with one bad option – print more money.

Politicians, who value getting elected above all else, are likely to strong arm the reliably compliant Federal Reserve to “come to the rescue” again with additional printed dollars.   In the minds of politicians and Federal Reserve officials, there will always be very compelling reasons to continue borrowing and money printing.

A nation that has reached the limits on taxation and borrowing has few viable policy options other than a continuing series of quantitative easing programs.  Current government policies, if left unchanged, virtually guarantee a continued increase in the price of precious metals.


Gold Bullion Coin Sales Steady In May But Plunge From Previous Year

2014-proof-gold-eagleThe sale of gold bullion coins by the US Mint remained steady in May compared to the previous month but declined sharply from year ago levels.  There are numerous theories on why gold demand and prices have not recovered in 2014.

The world seems to have regained confidence in paper money despite the fact that the financial system is now more leveraged than before the financial crisis and the debt problems which caused the financial crisis have simply been papered over with more debt.  Meanwhile, investors in both the stock and bond markets perceive risk to be low and the bulls outnumber the bears by a margin reminiscence of the pre-crash year of 2007.

The only asset class with a preponderance of bears seems to be precious metals.  When the crowd is leaning in one direction, it’s a perfect setup for an eventual price reversal suggesting that long term precious metal investors currently enjoy the opportunity to be greedy when others are fearful.

Despite the constant bearish rants, gold has been relatively stable during 2014.  After starting the year at $1,225 per ounce gold reached a high of $1,385 on March 14 and is currently at $1,244.50 for a gain of 1.6% on the year.

Gold Bullion U.S. Mint Sales Since 2000 as of May 31, 2014
         Year                            Ounces Sold
2000 164,500
2001 325,000
2002 315,000
2003 484,500
2004 536,000
2005 449,000
2006 261,000
2007 198,500
2008 860,500
2009 1,435,000
2010 1,220,500
2011 1,000,000
2012 753,000
2013 856,500
2014 217,500
TOTAL                                                9,076,500

During May the US Mint reported sales of 35,500 ounces of the American Eagle gold bullion coins, down from 38,500 ounces in the previous month.   Gold bullion coin sales plunged from last May when the Mint sold a total of 70,000 ounces.

Since monthly gold bullion coin sales can vary dramatically a look at the average monthly and year to date sales can give a more enlightened view on demand.  As of May 31, 2014 a year to date total of 217,500 ounces of gold bullion coins were sold by the Mint compared to 572,000 ounces in the comparable year ago period, a decline of 61.8%.  Average monthly sales of gold bullion coins during 2014 through May 31 were 43,500 ounces compared to 114,000 ounces last year.

Based on year to date sales, annualized sales of gold bullion coins for 2014 are projected at 522,000 ounces or a decline of 39.1% from the 856,500 ounces sold during 2013.

Strong Gold Demand and Dwindling Gold Deposits Make Gold a Compelling Investment

gold-bullionRobust gold demand and dwindling ore deposits represent an imbalance between supply and demand that almost guarantees higher long term gold prices.  As discussed in Peak Gold, almost all of the earth’s supply of gold reserves have already been mined.

At the end of 2012 it is estimated that all the gold ever mined in history totaled approximately 173,000 metric tonnes.  According to the Perth Mint, a study done by Natural Resource Holdings estimates that there are only about 56,674 metric tonnes of recoverable gold reserves left.  If this bleak assessment is correct, over 75% of the world’s total gold reserves have already been mined.

Further confirmation of the basic imbalance between supply and demand for gold can be seen in today’s release by the World Gold Council of gold demand trends for the first quarter of 2014.

  • Global jewellery demand rose 3% in the first quarter to 571 tonnes
  • Total investment demand fell slightly to 282 tonnes from 288 tonnes last year
  • The outflows from gold ETFs slowed dramatically to 0.2 tonnes compared to 177 tonnes in the first quarter of last year
  • Gold purchases by central banks was 122 tonnes in the first quarter, the 13th consecutive quarterly that central banks were net purchasers
  • Mine production increased by 6%

Although mine production increased slightly in the first quarter, new gold discoveries have plunged and the quality of ore reserves being mined is declining.  The Wall Street Journal reports that One argument for Big Gold: There ain’t much gold left.

The depletion of global gold mines, and the resulting increase in extraction costs, is one of the main forces pushing gold miners to combine as they look for efficiencies or to gain access to rivals’ high-grade deposits.

“There is every reason to do that deal, and the reasons not to do it weren’t geology, but man-made,” said Douglas B. Groh, a fund manager at Tocqueville Asset Management LP, which owns Newmont stock. “The nature of geology is such that gold does not occur in large volumes, but the capital exploiting it is robust.”

The gold industry ramped up exploration as prices increased by a factor of six from 2001 through 2012 to $1,750 a troy ounce. Prices since have tapered off to around $1,300 an ounce.

Discoveries also have tapered off. In 1995, 22 gold deposits with at least two million ounces of gold each were discovered, according to SNL Metals Economics Group. In 2010 there were six such discoveries, and in 2011 there was one. In 2012: nothing.

Even in Nevada, which mines around three-quarters of all U.S. gold, production has dropped a third since peaking in 1998. Around 40% of Newmont’s and Barrick’s production comes out of Nevada, with that possible economy of scale a big factor in their proposed merger.

“Deposits are simply harder to discover,” said John Muntean, an associate professor of mines and geology at the University of Nevada.

There also is simply less gold to unearth. All the gold ever mined could fit in a 60-foot cube. At around 0.005 parts per million, gold’s presence in the Earth’s crust is minute compared with that copper, at over 50 parts, or iron, at more than 50,000.

Miners are plowing through available gold reserves faster than they are other metals. Global gold production was equal to 5.1% of the 54,000 tons in available reserves last year, according to the U.S. Geological Survey, theoretically meaning it would take 19.5 years to exhaust supply. That compares with 38.5 years for copper and 28 years for iron ore.

On a long term basis, the supply and demand situation in the gold market strongly suggests much higher prices in the future.

Gold Bullion Coin Sales Rise, Silver Bullion Coin Sales Could Hit All Time Record High in 2014

american-silver-eagleGold and silver bullion coin sales by the U.S. Mint during April turned in mixed results with gold sales up and silver sales down.  Despite the fact that gold and silver are in the bargain basement due to price declines, investment demand remains relatively subdued due to tapering of money printing by the Federal Reserve and the apparent recovery of the U.S. economy.

Investor perceptions of precious metals as a safe haven appear diminished despite the ongoing and unprecedented monetary easing by central banks and unrestrained government borrowings.  Gold began the year selling for $1,225 per ounce.  After reaching a high of $1,385 on March 14 gold  declined to a current price of $1,281.25 leaving it up on the year by 4.6%.

The U.S. Mint reported that sales of the American Eagle gold bullion coin in April totaled 38,500 ounces up 83% from 21,000 ounces sold in the previous month but down by a substantial 81.6% from April of 2013 when the Mint sold 209,500 ounces.  After dropping for three years in a row since 2009, sales of the American Eagle gold bullion coins increased in 2013 to 856,500 ounces up by 13.7% from total sales of 753,000 ounces in 2012.

(Sales figures for gold bullion coins on the charts below are as of April 30, 2014.)


Gold Bullion U.S. Mint Sales Since 2000
         Year                            Ounces Sold
2000 164,500
2001 325,000
2002 315,000
2003 484,500
2004 536,000
2005 449,000
2006 261,000
2007 198,500
2008 860,500
2009 1,435,000
2010 1,220,500
2011 1,000,000
2012 753,000
2013 856,500
2014 182,000
TOTAL                               9,041,000

Total sales of gold bullion coins year to date total 182,000 ounces.  Based on the current sales rate through April 30th, annualized sales of gold bullion coins would come in at 546,000 ounces, the lowest amount of sales since 2007 when only 198,500 ounces were sold.

Silver Bullion Coin Sales Could Reach Another Record in 2014

Sales of the American Eagle silver bullion coins remained strong in April with a total of 4,590,500 coins sold, down slightly from the previous month’s sales of 5,354,000.

The one ounce American Eagle silver bullion coin remains extremely popular with investors.  Total coin sales during 2013 reached an all time high of 42,675,000.  The previous record sales year going back to 2000 occurred in 2011 when investors scooped up 39,868,500 coins.  If the current sales pace continues, total sales of the silver bullion coin during 2014 could reach a record breaking 55 million ounces.

Why Gold and Silver Could Outperform Every Other Asset Class in 2014

gold-buffalo
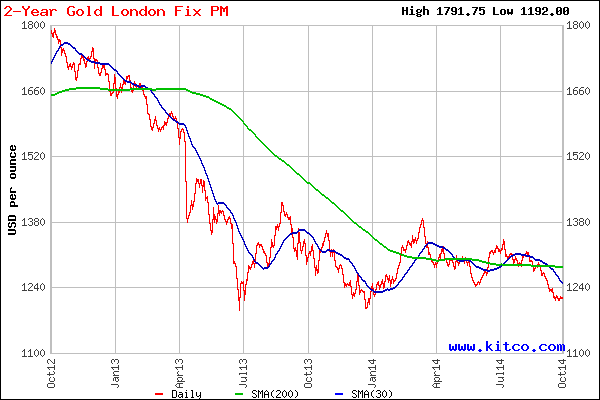
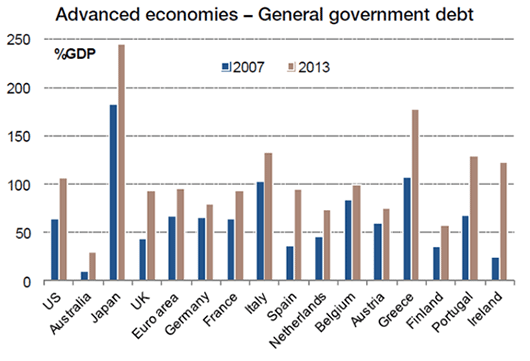
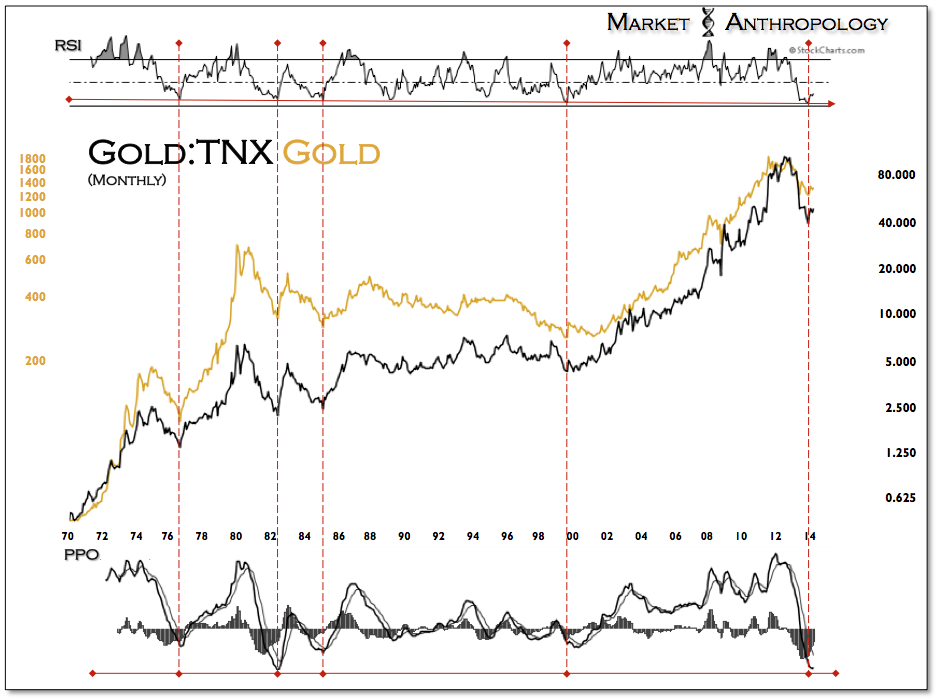
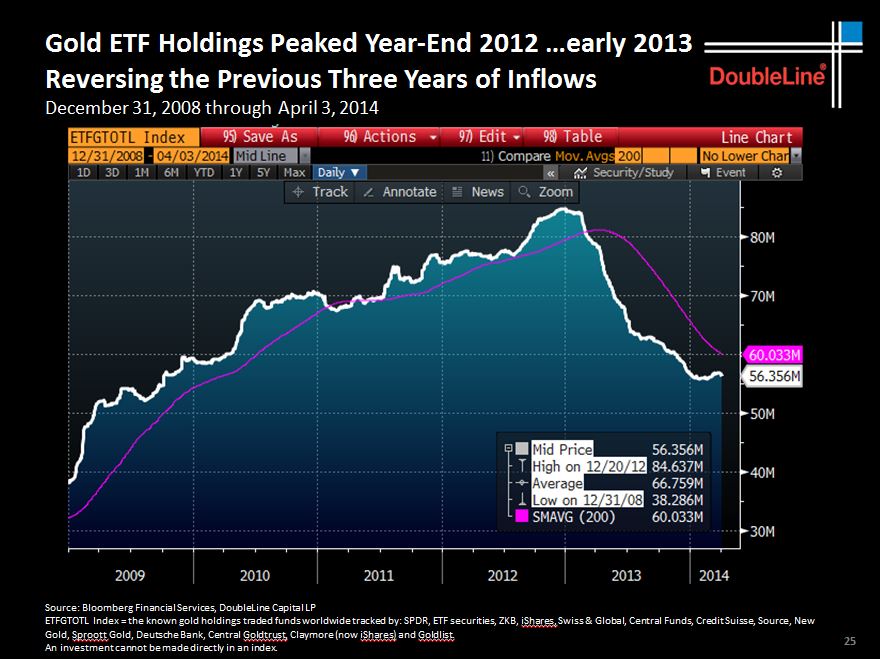
After almost a three year bear market in gold and silver it’s safe to conclude that most of precious metal bears have sold out and moved on.  As gold and silver prices corrected sharply over the past three years, the chorus of bearish sentiment in the mainstream press has become endemic, thus setting the stage for a powerful and unexpected contra rally.

What will set off an explosive rally in precious metals remains to be seen but there are plenty of potential triggers including war in the Ukraine or South Korea as well as the significant financial risk of collapsing asset bubbles engineered by the extremely loose monetary policies of the world’s central banks.

Here’s some of the most interesting recent commentaries on why 2014 could be a big year for gold and silver.

Gold and Silver Are Almost Ready to Rally

While every journey does begin with the first step, we need more evidence than a minor rally day to declare that a bull market has arrived. For the SPDR Gold Trust ETF (ticker: GLD), the April 24 rally was not very remarkable other than the fact that the day started with a loss and ended with a gain.
Now let’s talk about what it was rather than what it wasn’t.

For starters, it was an encouraging hold of short-term support from March. And the failure to set a lower low for the current two-month decline also falls on the bullish side of the ledger.

But more importantly, it was a suggestion that prices will not travel to the bottom of a giant year-long trading range again. In other words, any further strength now would tell us that investors are ready to buy. They will not wait for “better” prices to buy at the bottom of the range, and that means a shift in sentiment for the better.

Finally, the gold market has a “golden cross” in place. This is a condition where the 50-day average crosses above the 200-day average, and while it is really a stock market indicator, the macro look and feel are the same to me. After a long decline and period of sideways movement, this is the market’s first sign it has had enough healing. As long as the sideways trading range is not so long that the averages are completely flat, I think the signal is worthy of respect.

We can also we look at rising momentum indicators as bullish. Weekly charts show the relative strength index (RSI) setting higher lows between June and December even as prices set equal lows. This means the bears were tired as 2013 ended, and the fact that this indicator continued to rise this year suggests the bulls are starting to wake up.

Silver also had a bullish short-term reversal last week, but it has a lot more technical damage to repair. It does not have a moving average golden cross in place, and has already fallen rather close to its previous major lows from last year. Generally, that’s not a good sign, but in this case it’s not so clear cut.

When we look at the bigger picture using the iShares Silver Trust (SLV), we will see something really interesting. Recall 2010, when both gold and silver shot higher, but silver moved at a much faster pace than gold did. On the charts, we can see the technical launching point and breakout in August of that year.

As we see in many markets that appear to be bubbles, with such steep gains and ever-accelerating trends, the “bubble” part of the rally is often completely erased before conditions stabilize and then improve. Silver’s rally is now erased, which means the market is likely washed out and left for dead. Even so, there is a bullish RSI condition in place for the white metal, just as there is for gold.

 The Long Goodbye – by Andy Xie

The recent tumbling of Internet and biotech stocks may indicate that the speculation in such stocks has peaked. But, unlike in 2000, the bursting will occur in slow motion. The financial market structure has radically changed in the past 15 years. Too many money managers have a one-sided incentive to long such stocks.

The global financial system has experienced one bubble after another because major central banks have kept monetary policy loose. Prolonged loose monetary policy has made the financial system extraordinary large relative to the real economy. This change forces central banks to respond to negative shocks, like the bursting of a bubble, from the financial system. Such responses make the financial system even bigger. This vicious cycle explains why speculation has become such a powerful force.

A bubble cannot expand forever, even in an environment of loose monetary policy. The balance between fear and greed can tip over when the price of an asset becomes too high, like Internet stocks now relative to the average. The subsequent deflating bubble, in a continuing environment of loose money, just shifts air into other assets.

The talk of monetary tightening in the United States or China will not be followed up with strong enough actions. Real interest rates will remain negative until another crisis, like high inflation or hyperinflation or political crisis, force the hand.

Gold is the safe asset in today’s environment. As paper currencies lose credibility, the demand for gold will surge. The alternative digital currencies are fool’s good, really scams to take advantage of people’s fear over the potential collapse of paper currencies.

Two changes in the past 15 years have made bubble formation a constant feature of financial markets around the world. The inefficiencies in capital allocation and income redistribution to finance are the main reason for today’s sluggish global economy.

At the macro level, globalization has made inflation slow to emerge, as multinational companies can shift production around the world in response to cost pressure. This force has given central banks more room in increasing money supply without facing the inflation consequences for years. Hence, central banks around the world have become more active in response to economic fluctuations. The consequence is a rising ratio of money supply or credit to GDP. By definition, this means a bigger and bigger financial system, which needs more and more income to survive.

The real economy, as the previous analysis indicates, can only bear so much. Bubble formation has become central to supporting a bloated financial system. A large and bubbly financial system is unstable. Its periodic collapse brings down the economy, which triggers more monetary stimulus. Hence, constant monetary stimulus and an ever-expanding and bubbly financial system have formed a vicious cycle.

What’s Up With Gold and Silver? (Market Anthropology)

Anecdotally, we are seeing and hearing from those anxiously long the precious metals sector and contentiously short. With gold and silver down sharply in the early morning session – then reversing violently higher, the emotional spectrum in the market is likely diverged at or near another extreme. Over the past 10 months, both bulls and bears alike have been waiting for the next leg to commence. Instead, the market has played the jester – traversing a narrowing range and taking turns at frustrating both sides.

When will the argument resolve itself ?

Although it’s felt like a standing room only performance of Waiting For Godot, we expect long-term yields still hold the key to the next chapter for precious metals and the broader market story. We continue to view the move in 10-year yields as historically stretched to a relative extreme (see chart), a notion apparently lost on many participants as the Fed tapers their way to the end of QE and through an esoteric Fed cycle.
Just this week we saw that a Bloomberg survey of 67 economists unanimously expected 10-year yields to rise over the next six months (see Here). From a contrarian point-of-view, this should wake up participants that underlying sentiment is dangerously listing towards one side and the downstream and kinetic effects could be severe in many markets. The ratio chart below depicts the relationship between gold and 10-year yields, which as we noted last December had also reached a historic extreme. If and when long-term yields breakdown, we suspect a much stronger tailwind to develop behind precious metals.

As the Nikkei was breaking down at the start of the 1990’s, risk appetites changed and developed a palette for the Nasdaq. After the Nasdaq cracked going through the Millennium, investors turned to precious metals. The cycle can also come full circle, as we believe the performance and seasonal presentments of the current risk du jour describes. As the biotech index now turns down just past its zenith, we expect silver and the precious metals sector to begin making their way materially out of the trough they have trended towards over the past three years.

The Reformed Broker

Jeff Gundlach looks at the gold market. He’s not a big gold guy, but says that if you’ve held it this long (and through this much pain), “for god’s sake don’t sell it here!” He thinks the holders who remain are the quintessential, proverbial “strong hands” and that gold miner equities are completely underpriced for the potential of the metal running back up again. He’s more positive on commodities now in general, given how uninterested the investment community seems to be.

http://www.thereformedbroker.com/wp-content/uploads/2014/04/25.jpg

Silver Bullion Coin Sales Soar In March, Gold Coin Sales Slump – Are Coin Buyers Stupid?

2014-proof-gold-eagleThe March sales report of American Eagle bullion coins by the U.S. Mint showed a large drop in gold bullion coins while sales of the ever popular silver bullion coins soared.

Sales of the American Eagle gold bullion coins in March totaled 21,000 ounces, down by 32% from February’s total of 31,000 ounces and down by a dramatic 66% from March 2013 when 62,000 coins were sold.  Year to date sales through March of 143,500 ounces of the American Eagle gold bullion coins plunged 51% from the comparable period last year when the U.S. Mint sold 292,500 ounces.

The decline in sales of gold bullion is in marked contrast to last year when sales boomed despite an almost 30% decline in gold prices, the worst performance since 1981.  Investors in physical gold across the globe viewed the decline in gold as a buying opportunity.  Sales of gold coins in 2013 by The Perth Mint soared over 40% while sales by the Royal Canadian Mint surged over 80%.  Sales of American Eagle gold coins by the U.S. Mint in 2013 jumped by 6.3% to 800,500 ounces.

Are Gold and Silver Bullion Coin Buyers Stupid?

While gold rebounded in 2014 from a low of $1221 to as high as $1385 before pulling back to a current price of $1284, perhaps buyers are waiting to see if the rally in gold will continue or if gold will decline again in 2014 as predicted by the likes of Goldman Sachs.  Long term it does not matter since the entire concept of fiat money has never ended well over the long term.  According to Bloomberg, the “long term” may be upon us sooner than many think.

Sound money and sound banking policies of governments have always been suspect but since the financial crisis of 2008, the entire concept of sound money has been utterly abandoned on a global basis as central banks printed trillions of dollars to support a financial system that imploded due to over indebtedness.  “Curing” the problem of too much debt with more debt and printed fiat money has in many people’s mind saved the world financial system, a tenuous theory at best.

1881-CC-Morgan-Dollar

According to the Bank for International Settlements, the amount of global debt (primarily government borrowings) has soared by a staggering 40 percent to $100 trillion since 2008 with the U.S. in the lead increasing the national debt to $12 trillion from $4.5 trillion at 2007 year end.  Fast forward to the next recession which could have its roots in a variety of events from the collapse of Japan’s epic empire of debt to the start of a serious military conflict over Ukraine driven by the warmongering military industrial complex in the U.S.  Another serious economic crisis, whatever its genesis, will result in money printing on an unimaginable scale as central banks do the only thing they can do which is to print more money.

Buyers of physical bullion are long term investors who understand what’s happening and are buying the only true money that cannot be debased by government profligacy and rapacious tax policies.  In the meantime, fluctuations in the price of gold caused by speculators such as hedge fund operators who can push around the price of physical gold without ever owning it through the use of futures contracts or options merely provide fantastic buying opportunities when they slam down gold prices.  Long term gold and silver are the only protection to preserve wealth against governments determined to debase fiat money to keep the highly leveraged financial system from imploding.  Current gold buyers will at some point will be holding an asset that soars in value as confidence in central banks completely evaporates as the value of paper money collapses.

American Eagle silver bullion coins meanwhile continue to soar and are a much more affordable option for many buyers compared to gold.  March sales of American Eagle silver bullion coins soared in March to 5,354,000 ounces, up by 43% from the prior month’s sales of 3,750,000 ounces and up by 60% from the March 2013 sales of 3,356,500 ounces.   Sales of silver bullion coins also increased dramatically in 2013 to a new record high of almost 42 ounces, up from almost 34 million ounces in 2012.  Based on annualizing the year to date sales of silver bullion coins, 2014 could turn out to be another block buster year with sales approaching another record of over 55 million ounces compared to 42 million ounces in 2013.

Buyers of physical gold and silver are long term investors who are intelligently protecting their wealth against governments hell bent on inflation and debasement of the currency in order to keep the house of debt cards from collapsing.  Accordingly, short term declines in the sale of gold bullion coins is totally irrelevant.