 After almost a three year bear market in gold and silver it’s safe to conclude that most of precious metal bears have sold out and moved on. As gold and silver prices corrected sharply over the past three years, the chorus of bearish sentiment in the mainstream press has become endemic, thus setting the stage for a powerful and unexpected contra rally.
What will set off an explosive rally in precious metals remains to be seen but there are plenty of potential triggers including war in the Ukraine or South Korea as well as the significant financial risk of collapsing asset bubbles engineered by the extremely loose monetary policies of the world’s central banks.
Here’s some of the most interesting recent commentaries on why 2014 could be a big year for gold and silver.
Gold and Silver Are Almost Ready to Rally
While every journey does begin with the first step, we need more evidence than a minor rally day to declare that a bull market has arrived. For the SPDR Gold Trust ETF (ticker: GLD), the April 24 rally was not very remarkable other than the fact that the day started with a loss and ended with a gain.
Now let’s talk about what it was rather than what it wasn’t.

For starters, it was an encouraging hold of short-term support from March. And the failure to set a lower low for the current two-month decline also falls on the bullish side of the ledger.
But more importantly, it was a suggestion that prices will not travel to the bottom of a giant year-long trading range again. In other words, any further strength now would tell us that investors are ready to buy. They will not wait for “better” prices to buy at the bottom of the range, and that means a shift in sentiment for the better.
Finally, the gold market has a “golden cross” in place. This is a condition where the 50-day average crosses above the 200-day average, and while it is really a stock market indicator, the macro look and feel are the same to me. After a long decline and period of sideways movement, this is the market’s first sign it has had enough healing. As long as the sideways trading range is not so long that the averages are completely flat, I think the signal is worthy of respect.
We can also we look at rising momentum indicators as bullish. Weekly charts show the relative strength index (RSI) setting higher lows between June and December even as prices set equal lows. This means the bears were tired as 2013 ended, and the fact that this indicator continued to rise this year suggests the bulls are starting to wake up.
Silver also had a bullish short-term reversal last week, but it has a lot more technical damage to repair. It does not have a moving average golden cross in place, and has already fallen rather close to its previous major lows from last year. Generally, that’s not a good sign, but in this case it’s not so clear cut.

When we look at the bigger picture using the iShares Silver Trust (SLV), we will see something really interesting. Recall 2010, when both gold and silver shot higher, but silver moved at a much faster pace than gold did. On the charts, we can see the technical launching point and breakout in August of that year.
As we see in many markets that appear to be bubbles, with such steep gains and ever-accelerating trends, the “bubble” part of the rally is often completely erased before conditions stabilize and then improve. Silver’s rally is now erased, which means the market is likely washed out and left for dead. Even so, there is a bullish RSI condition in place for the white metal, just as there is for gold.
The Long Goodbye – by Andy Xie
The recent tumbling of Internet and biotech stocks may indicate that the speculation in such stocks has peaked. But, unlike in 2000, the bursting will occur in slow motion. The financial market structure has radically changed in the past 15 years. Too many money managers have a one-sided incentive to long such stocks.
The global financial system has experienced one bubble after another because major central banks have kept monetary policy loose. Prolonged loose monetary policy has made the financial system extraordinary large relative to the real economy. This change forces central banks to respond to negative shocks, like the bursting of a bubble, from the financial system. Such responses make the financial system even bigger. This vicious cycle explains why speculation has become such a powerful force.
A bubble cannot expand forever, even in an environment of loose monetary policy. The balance between fear and greed can tip over when the price of an asset becomes too high, like Internet stocks now relative to the average. The subsequent deflating bubble, in a continuing environment of loose money, just shifts air into other assets.
The talk of monetary tightening in the United States or China will not be followed up with strong enough actions. Real interest rates will remain negative until another crisis, like high inflation or hyperinflation or political crisis, force the hand.
Gold is the safe asset in today’s environment. As paper currencies lose credibility, the demand for gold will surge. The alternative digital currencies are fool’s good, really scams to take advantage of people’s fear over the potential collapse of paper currencies.
Two changes in the past 15 years have made bubble formation a constant feature of financial markets around the world. The inefficiencies in capital allocation and income redistribution to finance are the main reason for today’s sluggish global economy.
At the macro level, globalization has made inflation slow to emerge, as multinational companies can shift production around the world in response to cost pressure. This force has given central banks more room in increasing money supply without facing the inflation consequences for years. Hence, central banks around the world have become more active in response to economic fluctuations. The consequence is a rising ratio of money supply or credit to GDP. By definition, this means a bigger and bigger financial system, which needs more and more income to survive.
The real economy, as the previous analysis indicates, can only bear so much. Bubble formation has become central to supporting a bloated financial system. A large and bubbly financial system is unstable. Its periodic collapse brings down the economy, which triggers more monetary stimulus. Hence, constant monetary stimulus and an ever-expanding and bubbly financial system have formed a vicious cycle.
What’s Up With Gold and Silver? (Market Anthropology)
Anecdotally, we are seeing and hearing from those anxiously long the precious metals sector and contentiously short. With gold and silver down sharply in the early morning session – then reversing violently higher, the emotional spectrum in the market is likely diverged at or near another extreme. Over the past 10 months, both bulls and bears alike have been waiting for the next leg to commence. Instead, the market has played the jester – traversing a narrowing range and taking turns at frustrating both sides.
When will the argument resolve itself ?
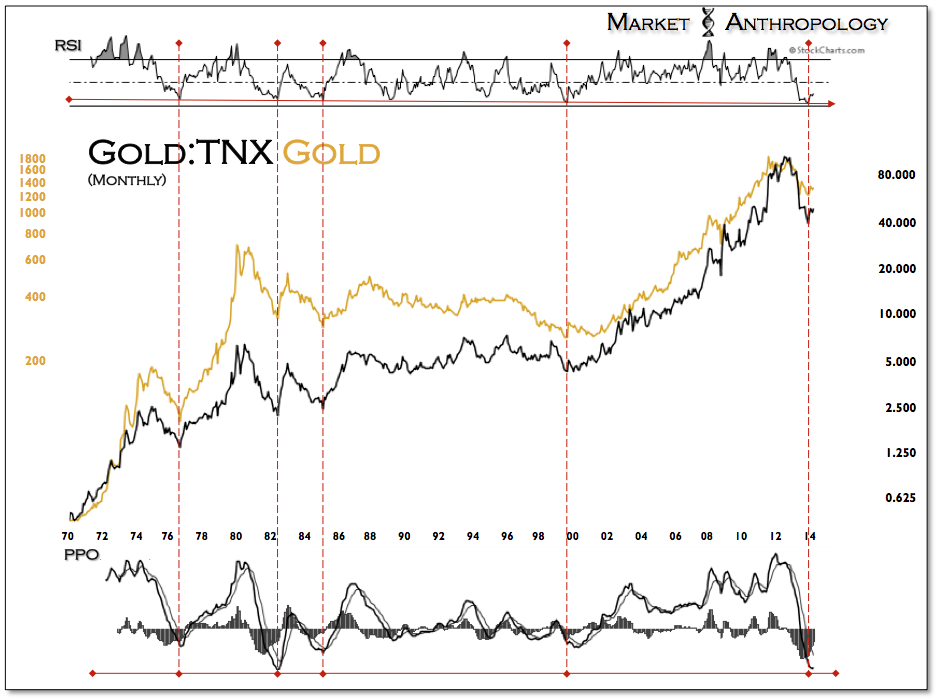
Although it’s felt like a standing room only performance of Waiting For Godot, we expect long-term yields still hold the key to the next chapter for precious metals and the broader market story. We continue to view the move in 10-year yields as historically stretched to a relative extreme (see chart), a notion apparently lost on many participants as the Fed tapers their way to the end of QE and through an esoteric Fed cycle.
Just this week we saw that a Bloomberg survey of 67 economists unanimously expected 10-year yields to rise over the next six months (see Here). From a contrarian point-of-view, this should wake up participants that underlying sentiment is dangerously listing towards one side and the downstream and kinetic effects could be severe in many markets. The ratio chart below depicts the relationship between gold and 10-year yields, which as we noted last December had also reached a historic extreme. If and when long-term yields breakdown, we suspect a much stronger tailwind to develop behind precious metals.
As the Nikkei was breaking down at the start of the 1990’s, risk appetites changed and developed a palette for the Nasdaq. After the Nasdaq cracked going through the Millennium, investors turned to precious metals. The cycle can also come full circle, as we believe the performance and seasonal presentments of the current risk du jour describes. As the biotech index now turns down just past its zenith, we expect silver and the precious metals sector to begin making their way materially out of the trough they have trended towards over the past three years.
Jeff Gundlach looks at the gold market. He’s not a big gold guy, but says that if you’ve held it this long (and through this much pain), “for god’s sake don’t sell it here!” He thinks the holders who remain are the quintessential, proverbial “strong hands” and that gold miner equities are completely underpriced for the potential of the metal running back up again. He’s more positive on commodities now in general, given how uninterested the investment community seems to be.
The end of the gold rally is a consequence of the improvement in the global economic situation, although many European countries are in an economic situation that could not secure at all times contribute to new increases in the value of gold in the short-and medium-term