March 19, 2024

American Eagle Gold Bullion Sales Plunge in February Following Weak 2014 Sales

gold-bullionThe US Mint’s February sales report for American Eagle gold bullion coins revealed slow sales in February continuing the weak sales trend set in 2014.

For the month of February 2015 total sales of the American Eagle gold bullion coins rang in at only 18,500 ounces, down 40.3 percent from the comparable prior year’s month and down a whopping 77.2 percent from the prior month’s sales of 81,000 ounces.  Who needs gold when you can buy government debt at negative interest rates?

The situation with gold and all other assets classes has been distorted beyond all traditional metrics by the ultra easy monetary policies of the world’s central banks.  Leverage in the world financial system now exceeds by many orders of magnitude that which existed prior to the financial crisis of 2008 which nearly brought the system to a grinding halt.  Where and when we go from here is anyone’s guess but I think it’s fair to conclude that at some future point gold will be acknowledged as the only store of value that cannot be devalued by desperate governments and central banks.

Until the investment masses reach that moment of clarity when they conclude that central banks cannot provide prosperity to the masses by printing money and monetizing government debt, gold may remain on the deep discount rack.  One has to wonder about the critical thinking skills of citizens such as Greece or Russia or Venezuela or many other countries in which the currency is plunging in value and life savings are being wiped out but yet the masses are not moving into a traditional universally accepted store of value such as gold.  Considering the fragile state of paper currencies and concerted efforts by central banks to destroy the purchasing value of the currency, it should be impossible to buy any amount of gold in many countries since no logical sellers would offer their gold at any bid.

Gold bullion sales in 2014 dropped to only 524,500 ounces after fairly robust sales of about 800,000 ounces during both 2012 and 2013.  The decline in the sale of US Mint gold bullion coins can be seen in the chart below.  Note that sales figures for 2015 include year to date totals through the end of February.

Although sales of gold bullion coins has been in a definite downtrend it is interesting to note that sales of the coins are still fairly robust compared to average sales in the years prior to the financial crisis.  After an increase in sales during 2013, sales of the gold bullion coins have declined every year since peaking during 2009 despite the fact that gold bullion did not reach its peak price of almost $1,900 per troy ounce during late 2011.

Listed below are the annual sales of the US Mint American Eagle gold bullion coins since 2000.


Gold Bullion U.S. Mint Sales Since 2000
Year Total Ounces Sold

2000

164,500

2001

325,000

2002

315,000

2003

484,500

2004

536,000

2005

449,000

2006

261,000

2007

198,500

2008

860,500

2009

1,435,000

2010

1,220,500

2011

1,000,000

2012

753,000

2013

856,500

2014

524,500

2015

                       99500

TOTAL

 9,483,000

2015 totals through February 28, 2015

Will 2015 turn out to be another year of low demand for American Eagle gold bullion coins?  Time will tell but based on annualzied year to date sales, total US Mint gold bullion coins would total 597,000 ounces, slightly above 2014 coin sales.

American Eagle Gold Bullion Coin Sales Up 25% In November

Liberty-EagleThe sale of the US Mint American Eagle gold bullion coins remained strong in November.

The US Mint reports that sales of the gold bullion coins were 60,000 ounces in November up by 24% from last year’s monthly sales of 48,000 ounces.  Sales for November slipped from October sales of 67,500 ounces which was the second biggest sales month of the year.  The year started off with a bang for the gold bullion coins when the US Mint sold 91,500 ounces in January.

Year to date sales of 506,500 ounces through November remain far below last year’s comparable sales of 800,500 ounces, a decline of 36.7%.  The sale of gold bullion coins has been in a general decline since 2009 as seen in the yearly sales chart below.

Gold has been in a nonstop bear market decline since early 2011 and gold sentiment weakened even further with today’s announcement that Swiss voters rejected a call for the Swiss National Bank to increase their gold reserves.

gold Technical chart [Kitco Inc.]

Shown below are the total ounces sold by year since 2000 of the American Eagle gold bullion coins.  Based on current sales trends sales of the gold bullion coins for 2014 will decline to the lowest levels since 2007.

American Eagle Gold Bullion Coin Sales Soar 132% In September

gold-bullionDespite the ongoing slump in the price of gold, buyers of physical gold seem to sense that gold has reached bargain levels.  The September sales report from the US Mint shows that sales of the American Eagle gold bullion coins soared by 132% over the previous month.

September sales of gold bullion coins totaled 58,000 ounces, up from 25,000 ounces in August and 13,000 ounces last year.  Sales of gold bullion coins reached the highest level of the year since January when the Mint sold 91,500 ounces.

Despite the monthly increase, sales of gold bullion coins remain weak compared to previous years.  Year to date 2014 sales total 379,000 ounces compared to 704,000 ounces in the comparable prior year.

Gold has reached what some think is a critical support level in the $1200 range, a point from which gold has rebounded three times in the last two years.

Courtesy: Kitco.com

Courtesy: Kitco.com

With the stock and bond markets delivering robust returns to investors due to the unprecedented easy money policies of the Federal Reserve interest in gold has diminished greatly.  History has shown time and again that the best time to invest in an asset class is when the crowd thinks there is no reason to buy.

Sales of gold bullion coins have been steadily declining since 2009 when sales soared to almost 1.5 million ounces.  Sales of gold bullion coins by year since 2000 are shown below.

Based on the present sales rate of the American Eagle gold bullion coins, total sales for 2014  could drop to the lowest level since 2007.

Gold American Eagle Bullion Coin Sales Soar 37% in June – Will Gold Outperform Stocks in 2014?

2014-proof-gold-eagleSales of the US Mint American Eagle gold bullion coins soared in June to 48,500 ounces from the previous month of May during which sales totaled 35,500.  Demand for gold bullion coins, however, has been relatively soft compared to previous years.

June sales of the gold bullion coins were down from the year ago period when 57,000 ounces were sold during June 2013.  At the current sales pace 2014 annual sales of the gold bullion coins would come in at roughly 500,000 ounces down significantly from total sales of 856,500 ounces during 2013.  Sales of the American Eagle gold bullion coins hit a record high of 1,435,000 ounces during 2009 when the financial system was still in intensive care and the Federal Reserve initiated a massive money printing campaign to “save” the world.

Gold should always have a presence in an investment portfolio but since mid 2011 stocks have become a powerful competing investment alternative to precious metals. The easy money policies of the Federal Reserve have served to inflate asset values of stocks and bonds to dangerously overvalued levels according to many analysts.

Will stocks and bonds continue to enjoy easy gains of 20 to 30 percent a year or will the entire house of cards built on easy printed money come tumbling down when the world least expects it?  Just this week the Bank for International Settlements (a consortium of the world’s biggest central banks) issued an alarming warning about growing levels of debt and the dangerous unintended consequences of zero interest rate policies.

The report issued by the Bank for International Settlements (BIS) noted that “Overall, it is hard to avoid the sense of a puzzling disconnect between the markets’ buoyancy and underlying economic developments globally.”  The head of the BIS’s economic department further noted that  “Financial markets are euphoric, in the grip of an aggressive search for yield…and yet investment in the real economy remains weak while the macroeconomic and geopolitical outlook is still highly uncertain.”  The BIS noted the obvious when it cautioned that the ultra low levels of interest rate due to financial repression by central banks is encouraging further borrowing but an eventual rise in interest rates will amplify the problem of excessively high levels of debt, a consequence that no one seems prepared for.

So who needs gold when stocks are heading straight up and the consensus is that this wealth machine of easy money and asset inflation is unstoppable?

Gold, silver and stocks

At some unknowable point in time and for some unpredictable reason the euphoria of the credit bubble created by the central banks will burst just as all bubbles in history have burst.  The resulting financial chaos that ensues from the bursting of a central bank induced credit bubble will be calamitous since the situation could well become uncontainable by world monetary authorities.  As the BIS notes, “keeping interest rates unusually low for an unusually long period can lull governments into a false sense of security” whereby they continue to borrow vast amounts of low cost funds to such excess that further expansion of government borrowings become impossible.  Governments that are unable to finance additional borrowings when the next economic downturn comes will turn to their only savior – the central banks.  Unable to stimulate the economy through rate cuts since rates are already at zero, central banks will be forced to monetize government debts on a monumental scale and when this day arrives we should all want to have a heavy percentage of our portfolios in gold.

The current mania for paper assets seems to have even infected China and India who have historically turned to gold as a safeguard against profligate governments and paper money backed only by the promises of lying politicians.   According to the Wall Street Journal demand for gold is expected to decline in both China and India during 2014.

The crowd seems to be leaning heavily towards paper assets and away from gold, suggesting that a turnaround is probably forthcoming.  Gold has already had its correction and is now on track for what will probably be a historic rally.  Consider that despite widespread bearishness on gold, the price during 2014 has held its own and is actually up on the year.  From a price of $1,225 per ounce at the start of the year gold has moved up to $1,326, not exactly a sign of weak demand.

What’s the Difference Between Gold Cast Bars, Gold Minted Bars and Gold Bullion Coins?

2014-Australian-Kangaroo-1kg-Gold-Bullion-Coin-Obverse-SBesides offering an incredible selection of gold and silver precious metal products at fair prices, the Perth Mint excels at educating its customers.

The Perth Mint has specialized in the production of precious metal coins since 1899.  The Perth Mint operates and owns the only gold refinery in Australia and is owned by the Gold Corporation which operates under the statutory authority of the Government of Western Australia.

All gold and silver bullion coins and bars produced by the Perth Mint are available in 99.99% pure gold and are issued as legal tender in Australia.

In this week’s Bullion News, the Perth Mint explains to potential buyers the different factors to take into account when deciding whether to buy gold cast bars, gold minted bars, or gold bullion coins.

Cast Bars, Minted Bars and Bullion Coins

Gold Cast Bars

Investors seeking to pay the lowest premium over spot gold prices will typically consider purchasing gold cast bars since they have the lowest fabrication cost.  The Perth Mint warns buyers that when buying gold cast bars it is essential to make purchases from a totally trustworthy seller to ensure weight, purity and re-saleability.

The Perth Mint sells gold cast bars in 1 ounce, 2 1/2 ounce, 5 ounce, 10 ounce, 20 ounce, and 50 ounce weights.  The current markup over spot on a 1 ounce cast bar is only $35.  Investors planning to make larger purchases such as a 20 oz cast bar can pick it up for less than $100 over the current spot price of $25,633.

Gold Minted Bars

Gold minted bars are cut from rolled gold, have a better finish and appearance, and are stamped with various designs on a minting press.  I have observed while traveling that gold minted bars are extremely popular in gold and jewelry stores in China since they can be purchased in sizes as small as 0.3 grams and often come in a tamper proof security container.

The Perth Mint sells gold minted bars in 5 g, 10 g, 20 g, 1 oz, 50 g, 100 g, and 10 oz.  A one ounce gold minted bar currently sells for a premium over spot of around $44.

Gold Bullion Coins

Gold bullion coins are typically favored by many small investors since they are issued and guaranteed by governments, come in numerous sizes, are difficult to counterfeit due to their thin size, and are issued with distinctive and detailed designs which add another dimension to the desirability of owning gold.  The minting process to produce a gold bullion coin is far more complex than that for producing bars and therefore the premium over the gold spot price is significantly higher.

The Perth Mint sells gold bullion coins ranging in size from only 1/20 ounce to a massive 1 kilogram.  The one kilogram gold bullion coin currently sells for about $42,000.

Gold Advance Stymied by Investor Worries and High Gold Silver Ratio

feature-300x200The price of gold has held its own this year despite a long list of reasons from bearish analysts for not owning gold.  From a closing price of $1,225 at the start of the year gold has managed to eke out a small gain of 1.8% to a price of $1,247.50 at Friday’s close.  In mid March gold had reached a high of $1,385 but quickly surrendered those gains.

In a recent interview with Bloomberg several analysts listed various reasons for the unease in the gold market including:

  • selling by hedge funds
  • a lack of upward price momentum which is discouraging investors from making new purchases
  • anxiety over future gold and silver pricing as major banks drop out of the market for establishing the daily gold and silver fix price
  • the risk of a large drop in the price of gold if it breaks technical support at $1,230
  • an increase in the gold silver ratio to almost 70 from the more normal long term average of around 55 to 60.
Courtesy: stockcharts.com

Courtesy: stockcharts.com

One analyst interviewed by Bloomberg expects the gold silver ratio to converge via a drop in the price of gold, which is one possibility.  Another way in which the gold silver ratio could drop, of course, is if silver outperforms gold.  Since mid 2012 gold has outperformed silver by a relative percentage of about 17%.

gld vs slv

On an absolute basis silver has experienced a major price decline from almost $50 per ounce in March 2011 to $19.94, a price last seen in early September 2010.

slv

Is it time to buy or sell gold and silver?  Based on information from precious metal analysts, which is probably already fully discounted by the markets, the risks of buying gold and silver today are very high.  Kinda reminds me of what stock analysts were saying about buying stocks in early 2009.

Gold Bullion Coin Sales Steady In May But Plunge From Previous Year

2014-proof-gold-eagleThe sale of gold bullion coins by the US Mint remained steady in May compared to the previous month but declined sharply from year ago levels.  There are numerous theories on why gold demand and prices have not recovered in 2014.

The world seems to have regained confidence in paper money despite the fact that the financial system is now more leveraged than before the financial crisis and the debt problems which caused the financial crisis have simply been papered over with more debt.  Meanwhile, investors in both the stock and bond markets perceive risk to be low and the bulls outnumber the bears by a margin reminiscence of the pre-crash year of 2007.

The only asset class with a preponderance of bears seems to be precious metals.  When the crowd is leaning in one direction, it’s a perfect setup for an eventual price reversal suggesting that long term precious metal investors currently enjoy the opportunity to be greedy when others are fearful.

Despite the constant bearish rants, gold has been relatively stable during 2014.  After starting the year at $1,225 per ounce gold reached a high of $1,385 on March 14 and is currently at $1,244.50 for a gain of 1.6% on the year.

Gold Bullion U.S. Mint Sales Since 2000 as of May 31, 2014
         Year                            Ounces Sold
2000 164,500
2001 325,000
2002 315,000
2003 484,500
2004 536,000
2005 449,000
2006 261,000
2007 198,500
2008 860,500
2009 1,435,000
2010 1,220,500
2011 1,000,000
2012 753,000
2013 856,500
2014 217,500
TOTAL                                                9,076,500

During May the US Mint reported sales of 35,500 ounces of the American Eagle gold bullion coins, down from 38,500 ounces in the previous month.   Gold bullion coin sales plunged from last May when the Mint sold a total of 70,000 ounces.

Since monthly gold bullion coin sales can vary dramatically a look at the average monthly and year to date sales can give a more enlightened view on demand.  As of May 31, 2014 a year to date total of 217,500 ounces of gold bullion coins were sold by the Mint compared to 572,000 ounces in the comparable year ago period, a decline of 61.8%.  Average monthly sales of gold bullion coins during 2014 through May 31 were 43,500 ounces compared to 114,000 ounces last year.

Based on year to date sales, annualized sales of gold bullion coins for 2014 are projected at 522,000 ounces or a decline of 39.1% from the 856,500 ounces sold during 2013.

Strong Gold Demand and Dwindling Gold Deposits Make Gold a Compelling Investment

gold-bullionRobust gold demand and dwindling ore deposits represent an imbalance between supply and demand that almost guarantees higher long term gold prices.  As discussed in Peak Gold, almost all of the earth’s supply of gold reserves have already been mined.

At the end of 2012 it is estimated that all the gold ever mined in history totaled approximately 173,000 metric tonnes.  According to the Perth Mint, a study done by Natural Resource Holdings estimates that there are only about 56,674 metric tonnes of recoverable gold reserves left.  If this bleak assessment is correct, over 75% of the world’s total gold reserves have already been mined.

Further confirmation of the basic imbalance between supply and demand for gold can be seen in today’s release by the World Gold Council of gold demand trends for the first quarter of 2014.

  • Global jewellery demand rose 3% in the first quarter to 571 tonnes
  • Total investment demand fell slightly to 282 tonnes from 288 tonnes last year
  • The outflows from gold ETFs slowed dramatically to 0.2 tonnes compared to 177 tonnes in the first quarter of last year
  • Gold purchases by central banks was 122 tonnes in the first quarter, the 13th consecutive quarterly that central banks were net purchasers
  • Mine production increased by 6%

Although mine production increased slightly in the first quarter, new gold discoveries have plunged and the quality of ore reserves being mined is declining.  The Wall Street Journal reports that One argument for Big Gold: There ain’t much gold left.

The depletion of global gold mines, and the resulting increase in extraction costs, is one of the main forces pushing gold miners to combine as they look for efficiencies or to gain access to rivals’ high-grade deposits.

“There is every reason to do that deal, and the reasons not to do it weren’t geology, but man-made,” said Douglas B. Groh, a fund manager at Tocqueville Asset Management LP, which owns Newmont stock. “The nature of geology is such that gold does not occur in large volumes, but the capital exploiting it is robust.”

The gold industry ramped up exploration as prices increased by a factor of six from 2001 through 2012 to $1,750 a troy ounce. Prices since have tapered off to around $1,300 an ounce.

Discoveries also have tapered off. In 1995, 22 gold deposits with at least two million ounces of gold each were discovered, according to SNL Metals Economics Group. In 2010 there were six such discoveries, and in 2011 there was one. In 2012: nothing.

Even in Nevada, which mines around three-quarters of all U.S. gold, production has dropped a third since peaking in 1998. Around 40% of Newmont’s and Barrick’s production comes out of Nevada, with that possible economy of scale a big factor in their proposed merger.

“Deposits are simply harder to discover,” said John Muntean, an associate professor of mines and geology at the University of Nevada.

There also is simply less gold to unearth. All the gold ever mined could fit in a 60-foot cube. At around 0.005 parts per million, gold’s presence in the Earth’s crust is minute compared with that copper, at over 50 parts, or iron, at more than 50,000.

Miners are plowing through available gold reserves faster than they are other metals. Global gold production was equal to 5.1% of the 54,000 tons in available reserves last year, according to the U.S. Geological Survey, theoretically meaning it would take 19.5 years to exhaust supply. That compares with 38.5 years for copper and 28 years for iron ore.

On a long term basis, the supply and demand situation in the gold market strongly suggests much higher prices in the future.

Why Gold and Silver Could Outperform Every Other Asset Class in 2014

gold-buffalo
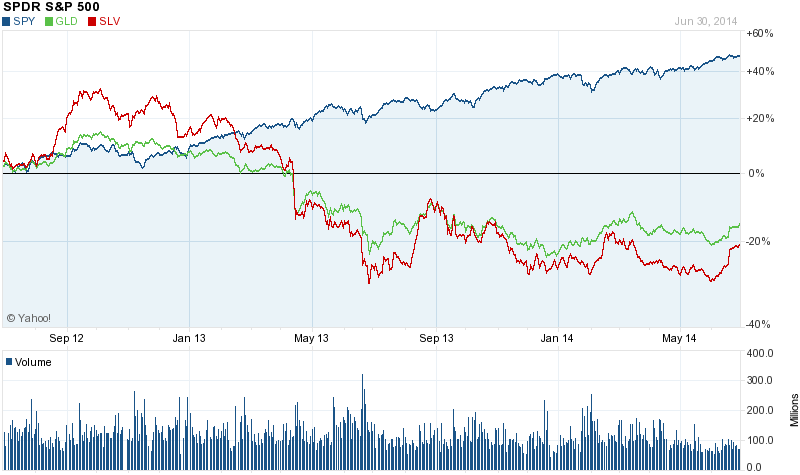
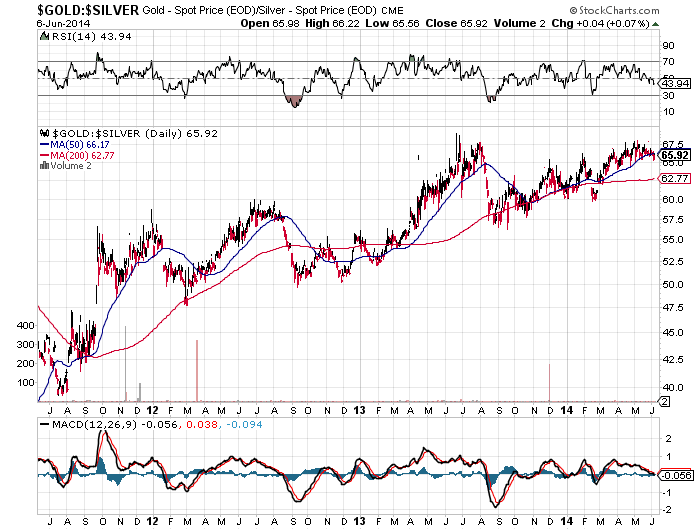
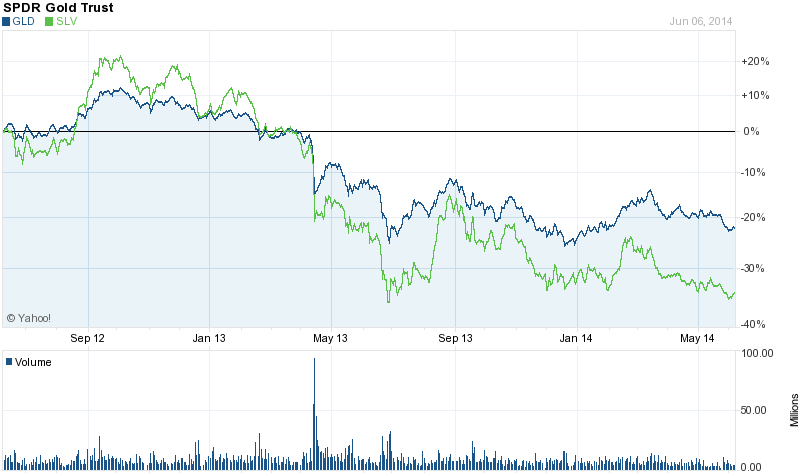
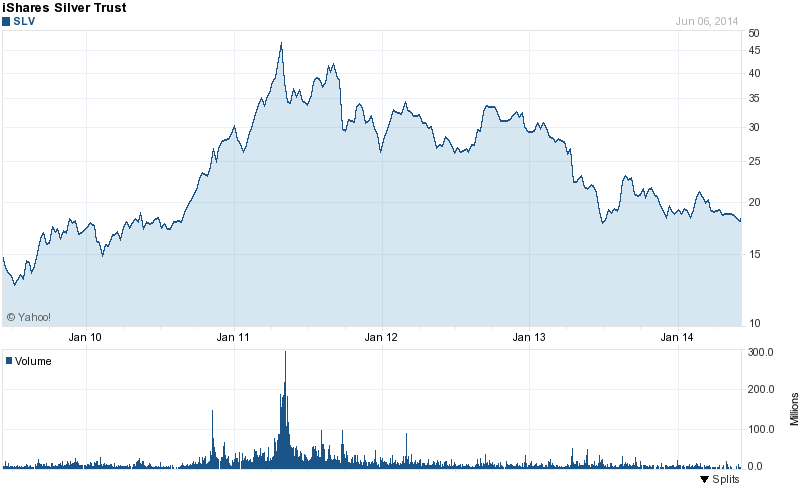
After almost a three year bear market in gold and silver it’s safe to conclude that most of precious metal bears have sold out and moved on.  As gold and silver prices corrected sharply over the past three years, the chorus of bearish sentiment in the mainstream press has become endemic, thus setting the stage for a powerful and unexpected contra rally.

What will set off an explosive rally in precious metals remains to be seen but there are plenty of potential triggers including war in the Ukraine or South Korea as well as the significant financial risk of collapsing asset bubbles engineered by the extremely loose monetary policies of the world’s central banks.

Here’s some of the most interesting recent commentaries on why 2014 could be a big year for gold and silver.

Gold and Silver Are Almost Ready to Rally

While every journey does begin with the first step, we need more evidence than a minor rally day to declare that a bull market has arrived. For the SPDR Gold Trust ETF (ticker: GLD), the April 24 rally was not very remarkable other than the fact that the day started with a loss and ended with a gain.
Now let’s talk about what it was rather than what it wasn’t.

For starters, it was an encouraging hold of short-term support from March. And the failure to set a lower low for the current two-month decline also falls on the bullish side of the ledger.

But more importantly, it was a suggestion that prices will not travel to the bottom of a giant year-long trading range again. In other words, any further strength now would tell us that investors are ready to buy. They will not wait for “better” prices to buy at the bottom of the range, and that means a shift in sentiment for the better.

Finally, the gold market has a “golden cross” in place. This is a condition where the 50-day average crosses above the 200-day average, and while it is really a stock market indicator, the macro look and feel are the same to me. After a long decline and period of sideways movement, this is the market’s first sign it has had enough healing. As long as the sideways trading range is not so long that the averages are completely flat, I think the signal is worthy of respect.

We can also we look at rising momentum indicators as bullish. Weekly charts show the relative strength index (RSI) setting higher lows between June and December even as prices set equal lows. This means the bears were tired as 2013 ended, and the fact that this indicator continued to rise this year suggests the bulls are starting to wake up.

Silver also had a bullish short-term reversal last week, but it has a lot more technical damage to repair. It does not have a moving average golden cross in place, and has already fallen rather close to its previous major lows from last year. Generally, that’s not a good sign, but in this case it’s not so clear cut.

When we look at the bigger picture using the iShares Silver Trust (SLV), we will see something really interesting. Recall 2010, when both gold and silver shot higher, but silver moved at a much faster pace than gold did. On the charts, we can see the technical launching point and breakout in August of that year.

As we see in many markets that appear to be bubbles, with such steep gains and ever-accelerating trends, the “bubble” part of the rally is often completely erased before conditions stabilize and then improve. Silver’s rally is now erased, which means the market is likely washed out and left for dead. Even so, there is a bullish RSI condition in place for the white metal, just as there is for gold.

 The Long Goodbye – by Andy Xie

The recent tumbling of Internet and biotech stocks may indicate that the speculation in such stocks has peaked. But, unlike in 2000, the bursting will occur in slow motion. The financial market structure has radically changed in the past 15 years. Too many money managers have a one-sided incentive to long such stocks.

The global financial system has experienced one bubble after another because major central banks have kept monetary policy loose. Prolonged loose monetary policy has made the financial system extraordinary large relative to the real economy. This change forces central banks to respond to negative shocks, like the bursting of a bubble, from the financial system. Such responses make the financial system even bigger. This vicious cycle explains why speculation has become such a powerful force.

A bubble cannot expand forever, even in an environment of loose monetary policy. The balance between fear and greed can tip over when the price of an asset becomes too high, like Internet stocks now relative to the average. The subsequent deflating bubble, in a continuing environment of loose money, just shifts air into other assets.

The talk of monetary tightening in the United States or China will not be followed up with strong enough actions. Real interest rates will remain negative until another crisis, like high inflation or hyperinflation or political crisis, force the hand.

Gold is the safe asset in today’s environment. As paper currencies lose credibility, the demand for gold will surge. The alternative digital currencies are fool’s good, really scams to take advantage of people’s fear over the potential collapse of paper currencies.

Two changes in the past 15 years have made bubble formation a constant feature of financial markets around the world. The inefficiencies in capital allocation and income redistribution to finance are the main reason for today’s sluggish global economy.

At the macro level, globalization has made inflation slow to emerge, as multinational companies can shift production around the world in response to cost pressure. This force has given central banks more room in increasing money supply without facing the inflation consequences for years. Hence, central banks around the world have become more active in response to economic fluctuations. The consequence is a rising ratio of money supply or credit to GDP. By definition, this means a bigger and bigger financial system, which needs more and more income to survive.

The real economy, as the previous analysis indicates, can only bear so much. Bubble formation has become central to supporting a bloated financial system. A large and bubbly financial system is unstable. Its periodic collapse brings down the economy, which triggers more monetary stimulus. Hence, constant monetary stimulus and an ever-expanding and bubbly financial system have formed a vicious cycle.

What’s Up With Gold and Silver? (Market Anthropology)

Anecdotally, we are seeing and hearing from those anxiously long the precious metals sector and contentiously short. With gold and silver down sharply in the early morning session – then reversing violently higher, the emotional spectrum in the market is likely diverged at or near another extreme. Over the past 10 months, both bulls and bears alike have been waiting for the next leg to commence. Instead, the market has played the jester – traversing a narrowing range and taking turns at frustrating both sides.

When will the argument resolve itself ?

Although it’s felt like a standing room only performance of Waiting For Godot, we expect long-term yields still hold the key to the next chapter for precious metals and the broader market story. We continue to view the move in 10-year yields as historically stretched to a relative extreme (see chart), a notion apparently lost on many participants as the Fed tapers their way to the end of QE and through an esoteric Fed cycle.
Just this week we saw that a Bloomberg survey of 67 economists unanimously expected 10-year yields to rise over the next six months (see Here). From a contrarian point-of-view, this should wake up participants that underlying sentiment is dangerously listing towards one side and the downstream and kinetic effects could be severe in many markets. The ratio chart below depicts the relationship between gold and 10-year yields, which as we noted last December had also reached a historic extreme. If and when long-term yields breakdown, we suspect a much stronger tailwind to develop behind precious metals.

As the Nikkei was breaking down at the start of the 1990’s, risk appetites changed and developed a palette for the Nasdaq. After the Nasdaq cracked going through the Millennium, investors turned to precious metals. The cycle can also come full circle, as we believe the performance and seasonal presentments of the current risk du jour describes. As the biotech index now turns down just past its zenith, we expect silver and the precious metals sector to begin making their way materially out of the trough they have trended towards over the past three years.

The Reformed Broker

Jeff Gundlach looks at the gold market. He’s not a big gold guy, but says that if you’ve held it this long (and through this much pain), “for god’s sake don’t sell it here!” He thinks the holders who remain are the quintessential, proverbial “strong hands” and that gold miner equities are completely underpriced for the potential of the metal running back up again. He’s more positive on commodities now in general, given how uninterested the investment community seems to be.

http://www.thereformedbroker.com/wp-content/uploads/2014/04/25.jpg

The Rationale for Owning Gold and Silver Is Stronger Than Ever

1933-double-eagle1By: GE Christenson

Consider our economic world from two perspectives:

The Deviant View – as represented by those who visit deviantinvestor.com, read alternate media, are skeptical of the “official” news, and who critically examine the financial world.
or
The others – call it the mainstream media view.
Deviant readers are more likely to believe:

  • The US government gold supposedly stored in Fort Knox and at the NY Federal Reserve is mostly gone. (Deviant Investor survey showed that over 81% believe that less than 20% of the gold is actually available.)
  • The Federal Reserve will eventually be forced to increase QE instead of reducing it. (Deviant Investor survey showed that 62% believe that QE will be increased to $100 Billion per month, or more, by the end of 2014.)
  • Gold bottomed in December and is going to new highs. (Deviant Investor survey indicates that 92% believe that gold has bottomed and is going to new highs.)
  • The Federal Reserve has, over the past 100 years, debased the dollar, produced inflation, and substantially increased the profits for the financial industry mostly at the expense of the American people.
  • Dollars are unbacked debt based Federal Reserve Notes that work well for daily commerce. However, they have no intrinsic value and, in terms of decades, been not been a good store of value.
  • Gold and silver are excellent for savings and investing at the present time, have intrinsic value, and are a store of value over the long term.

SILVER DOLLARS

Mainstream Media View

  • Of course the gold is still physically stored in Fort Knox and at the NY Federal Reserve! Why would it not be there?
  • QE will be reduced, the economy is beginning to grow, and the economy will appear much healthier in time for the 2016 elections.
  • The Syria intervention that did not happen was mostly about human rights, not gas pipelines or control over energy markets.
  • The stock market is a good measure of economic health, even though it primarily benefits the upper ten percent of the US populace.
  • Pension funds are seriously underfunded, but they will be fine – with only a few exceptions – as always.
  • Social Security is a “pay as you go” retirement plan for Americans; and even though it is a legally sanctioned “Ponzi Scheme,” it is a solid system.
  • Politicians will be politicians, but for the most part, the US political system works with only a modest amount of corruption and inefficiency.
  • If you like your health plan, you can keep it. If Crimea votes to join Russia, they can. If you don’t want to pay taxes, … well, that is a different issue.
  • If you run a too-big-to-fail bank, you need not worry about breaking the law or prosecution, since the bank is necessary for the survival of the economy.
  • Stocks are good, gold is bad. Per Warren Buffett, “Gold gets dug out of the ground in Africa, or someplace. Then we melt it down, dig another hole, bury it again and pay people to stand around guarding it.” From Charlie Munger, “Civilized people don’t buy gold.”

And there you have it – a simple summary of the Deviant view versus the Mainstream view.

Implications

Suppose that 50% to 80% of the gold in Fort Knox and the NY Fed is either gone, leased, or rehypothecated. Suppose that China has amassed the largest horde of gold in the world. Do these suggest the price of gold is likely to increase over the next few years?

Suppose that the Federal Reserve is forced via market conditions (interest rates rising, the S&P crashing, war, dollar collapse, financial melt-down, or other possibilities) to expand the QE program and to “print and purchase” $100,000,000,000 or more per month of distressed paper, damaged derivatives, flaky mortgage-backed securities, and increasingly large quantities of dumped T-bonds and notes. Do you think this will support the price of gold over the next few years?

money printing

Suppose that gold double bottomed in June and December 2013 after being crushed by the naked short sales in April and June of 2013. Suppose that the unintended consequence of that market take-down was increased demand for physical gold, particularly from Asia and the Middle East. Does the new uptrend and increasing world-wide demand for gold suggest higher prices in the next few years?

Suppose that, for whatever reason, the world launches into another cycle of war, several countries send troops to various spots around the world, and the US engages in one or several hot wars. Will this increase the deficit, increase the national debt, increase financial and social anxiety, upset the stock market, and suggest higher gold prices?

Summary

The Deviant View: Gold has bottomed, the US deficit will expand, the national debt will continue its exponential increase, and consumer prices for the things we need, such as food and energy, will substantially increase. War, fraud, and corruption will increase prices more rapidly.

The Mainstream View: You can keep your health plan, NSA spying on everyone is mostly good, wars keep the economy healthy and moving, the stock market will continue to roar higher, and, as former Vice President Dick Cheney stated, “Reagan proved that deficits don’t matter.”

Another View On Gold: The following are comments that I have paraphrased from another site that dislikes gold. (I disagree with all of these comments.)

  • If and when humanity advances, the value of gold will be zero.
  • The problem is that gold is not an asset because it produces no return.
  • Gold is not only high-risk but also costly since it pays no return.
  • Gold is not a savings vehicle.

I express my opinions, and I expect others to do the same. There will be disagreements. We all experience the consequences of our thoughts and actions. This is why it is so important to perceive economic reality clearly. A belief in current delusions and the uselessness of gold will be expensive.

Additional Reading

Andrew Hoffman: “Deflation,” and Why You Must Own Precious Metals – Now!

Hugo Salinas Price: We Cannot Get Away From Gold or Silver

GE Christenson
aka Deviant Investor