April 26, 2024

Global Debt Bubble Will Push Gold and Silver Prices Higher

money printingBy: GE Christenson

To paraphrase William Shakespeare, “the debt ceiling drama is a tale told by idiots, full of sound and political fury, signifying nothing.” We now have a reprieve for three months – the 11th hour deal, complete with payoffs and the usual corruption, will keep the world safe for more ineptitude, deficit spending, administrative hypocrisy and the guarantee of a sequel. All is well! Celebration! Champagne! Cut to a prime-time commercial promoting big government and Obamacare…

And back in the real world where people work and support their families, life goes on, few noticed the lack of government “services,” and in three months we will be blessed with another episode of our “Congressional Reality Show.”

Gold, Silver, and National Debt

Examine the following graph. It is a graph of smoothed* annual gold and silver prices and the official U.S. national debt since 1971 when the dollar lost all gold backing and was “temporarily” allowed to float against all other unbacked debt based currencies. All values start at 1.0 in 1971.

The legend does not show which line represents gold, silver, or the national debt. Why? Because it hardly matters! Government spends too much money to perform a few essential services and to buy votes, wars, and welfare, and thereby increases its debt almost every year, while gold and silver prices, on average, match the increases in accumulated national debt.

Our 435 representatives, 100 senators, and the administration listened to their corporate backers and chose to increase the debt ceiling, continue spending as usual, not “rock the boat,” and carry on with the serious business of politics and payoffs for another three months. It is safe to say that, on average, gold and silver will continue rising, along with the national debt, as they all have for the past 42 years. Further, like the national debt, both gold and silver (and probably most consumer prices) will increase substantially from here, until some traumatic “reset” occurs. What sort of reset?

  • A “black swan” event that is unpredictable, by definition.
  • Middle East war escalation.
  • Derivative melt-down.
  • A dollar collapse when foreigners say “enough” to the dollar debasement policies pursued by the Fed and the US government.
  • A collapse of the Euro or Yen for any number of reasons.
  • A banker admits that most of the official gold supposedly held in New York, London, and Fort Knox is gone and has been sold to China, India, and Russia.
  • You name the false flag operation.

My guess: Gold and silver prices will rise gradually for a while, and then quite rapidly after one of the above “financial icebergs” smashes into our “Titanic” world monetary system. Further, we will have difficulty locating physical gold available for sale after such an event occurs, even at much higher prices. Now would be a good time to purchase physical gold and silver for storage in a secure storage facility. Paper gold will not be safe…

Congress has acted. The President has spoken. The Federal Reserve will continue “printing” dollars to increase banker profitability, fund the government, and fight the forces of deflation. This is business as usual – as it has been for the past 42 years.

Here is the second version of the graph with gold, silver, and national debt labeled. Note how relatively undervalued silver is at the present time! Dashed lines indicate guesses for the future normalized values for gold, silver, and the national debt.

The debt ceiling drama and “Congressional Reality Show” will return to prime time in January and February, right after “Dancing with the Senators” and just before “House Wives of Salt Lake City.” Expect sound and fury signifying nothing.

Further commentary on the case for gold and silver:

The Reality of Gold and the Nightmare of Paper Silver: The Noise is Deafening
GE Christenson
aka Deviant Investor

* Gold and silver prices were smoothed by taking monthly closing prices and a 24 month simple moving average. Annual prices graphed are the average of the 12 average monthly prices per year.
Physical Gold Bar and Coin Sales Soar 78% To All Time High

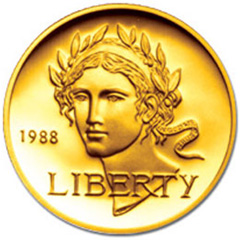
1988-olympic-goldPurchases of physical gold have been hitting new all time records.  Demand has been fueled by the recent pullback in gold prices and the massive amount of money printing being conducted by central banks in Europe, Japan and the United States.  The recent decision by the Federal Reserve to postpone any curtailment of its $85 billion per month of money printing could mark the end of the correction in gold and silver.  The Fed’s refusal to reduce the ongoing program of securities purchases signals that QE has morphed from an emergency measure to a permanent Fed policy.
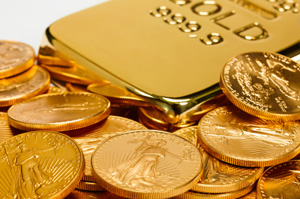
The demand for gold has been particularly intense in Asia as Thai Gold Buyer Doubles Imports After Bear Slump.

YLG Bullion International, Thailand’s biggest domestic gold importer, expects to more than double purchases this year after the bear market in prices spurred a surge in demand for physical metal.

The company may import as much as 200 metric tons in 2013, from 92 tons last year, Chief Executive Officer Pawan Nawawattanasub said in an interview yesterday. First-half shipments advanced to 112 tons, accounting for 60 percent of the country’s total, she said. A ton is valued at $42.6 million.

Gold tumbled 21 percent this year, heading for the first annual retreat since 2000, as some investors lost faith in the metal as a store of wealth. With prices now 32 percent below the record reached in September 2011, the rout is boosting demand for bullion bars and coins, global sales of which surged 78 percent to an all-time high in the second quarter, according to the London-based World Gold Council.

“Cheaper prices are attracting customers to buy bullion bars as they see it as money better spent than on something like a Hermes bag,” said Pawan, whose Bangkok-based company supplies retailers and investors in Southeast Asia’s second-biggest economy. “Demand in Thailand can continue to grow, partly because collecting gold is in our culture.”

Golden Buddha of Bangkok, World’s Largest Gold Statue -estimated gold value $250 million

Gold demand in Thailand is exceeded only by China and India.  Total gold demand in China and India in the form of jewelry, bars and coins is expected to reach 1,000 tons this year and gold demand in Thailand should reach 200 tons.  Total Asian gold demand from China, India and Thailand could amount to half of total world gold production of approximately 2,400 tons in 2013.

Even more astonishing is the fact that the entire world’s production of gold this year will be purchased by only three sources.  According to King World News, total gold buying by central banks, China and India is “almost equivalent to the annualized gold production of the entire world.”  It is only  a matter of time before a shortage of physical gold based on huge demand results in significantly higher prices.

Gold and Silver Soar As Fed Rejects Tapering and Revs Up The Printing Presses

Physical-GoldThe months long guessing game on whether or not the Fed would start tapering its $85 billion per month of treasuries and mortgage securities came to a conclusion today as the Fed promised to keep the printing presses going full blast.
Many analysts had come to the conclusion that the economy had strengthened enough for the Fed to begin reducing monetary stimulus but they were wrong as Fed, in Surprise Move, Leaves Bond-Buying Intact.

The Federal Reserve postponed any retreat from its long-running stimulus campaign Wednesday, saying that it would continue to buy $85 billion a month in bonds to encourage job creation and economic growth.

As Congressional Republicans and the White House hurtle toward another showdown over federal spending, the Fed said it was concerned that fiscal policy once again “is restraining economic growth,” threatening to undermine what the Fed had described just months ago as a recovery gaining strength.

Proponents of aggressive asset purchases, including Mr. Bernanke, also face mounting pressure from internal critics who argue that the modest benefits of bond-buying are increasingly outweighed by the risk that the Fed is encouraging excessive speculation or interfering with normal market function.

Some critics inside and outside the Fed have even begun to argue that the central bank’s bond-buying is preventing a return to normalcy.

“The economy is positioned to benefit from modestly higher longer-term interest rates,” Ms. George said earlier this month. She noted that higher rates could increase the income of retirees and bolster bank profits without a commensurate increase in risk-taking.

Despite the growing criticism of his securities purchase program the Fed decided that the time was not yet right for reducing the one trillion dollar securities purchase program which is financed by the Fed’s money presses.  According to the FRB press release:

Taking into account the extent of federal fiscal retrenchment, the Committee sees the improvement in economic activity and labor market conditions since it began its asset purchase program a year ago as consistent with growing underlying strength in the broader economy. However, the Committee decided to await more evidence that progress will be sustained before adjusting the pace of its purchases. Accordingly, the Committee decided to continue purchasing additional agency mortgage-backed securities at a pace of $40 billion per month and longer-term Treasury securities at a pace of $45 billion per month.

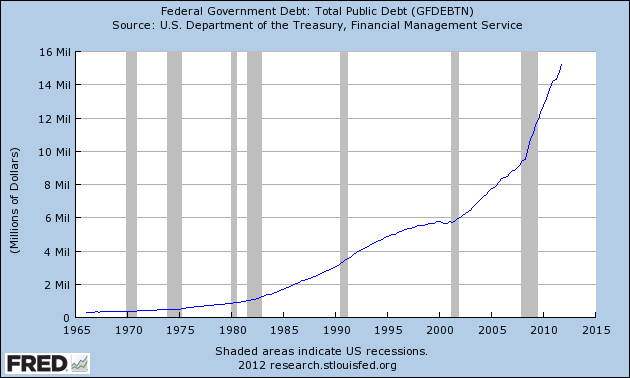
The Fed has already blown up its balance sheet to $4 trillion and the federal government has almost tripled its debt load to $17 trillion from $6 trillion in 2002.  After this massive stimulus of $15 trillion into the economy, the Fed now tells us that more is needed.

US Debt

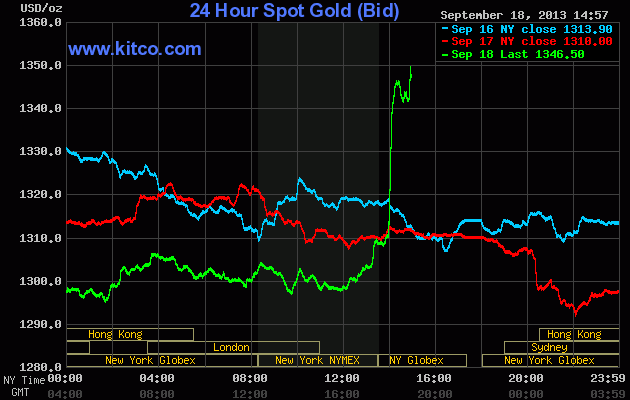
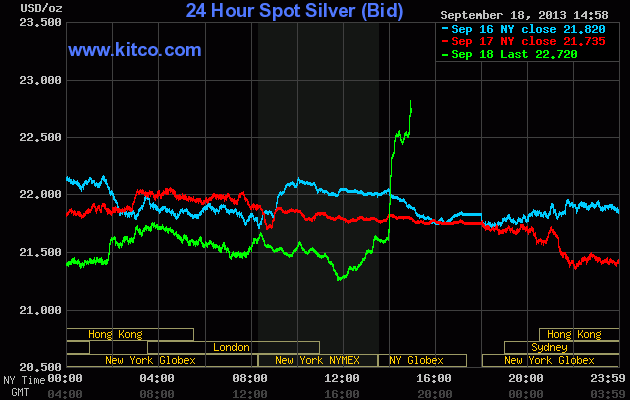
Today’s actions tell us that the Fed will never find an opportune time to reduce its money creation and the gold  and silver markets reacted accordingly.  After the Fed’s announcement gold skyrocketed by over $50 per ounce and silver shot up by almost $1.50 per ounce.

The reasons for holding gold and silver have never been stronger despite the recent pullback in prices and today’s announcement by the Fed serves to further prove this assertion.

gold soars

silver soars

Gold To Silver Ratio Says Silver Is A Screaming Buy

washington-quarterBy: GE Christenson

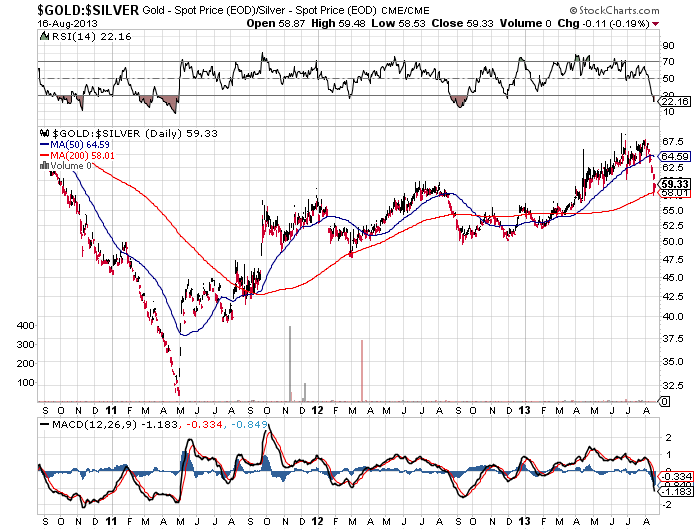
Six of eight significant silver market lows in the past 23 years occurred when the GSR (gold to silver ratio) was > 64 and the RSI (Relative Strength Index of the GSR was < 35.

Silver, in late June and early July 2013, met the above criteria, along with a near record low RSI of the GSR, and a record low in the TDI Trade Signal Line. These are strongly bullish conditions.

Previously, two other important lows occurred about 4.7 years ago, and 9.2 years ago. Both of those lows were followed by explosive rises that took silver prices much higher. The June/July 2013 low looks similar to the 2004 and 2008 lows. We will see if the upcoming rally is similarly explosive or not.

October 2008: $8.53 to nearly $50.00

May 2004: $5.50 to about $21.00

The Analysis:

Much has been made of the gold to silver ratio. It is currently (August 8, 2013) about 64, with gold about $1312 and silver about $20.41. After examining the data for the GSR for the past 23 years, we find that:

• The highest ratio was about 102 in February of 1991. (silver very low) • The lowest ratio was about 32 in April of 2011. (silver quite high) • The average ratio (weekly closes) since 1/1/1990 has been about 65. • The average ratio for the past 10 years has been lower at about 58.

All significant price lows in the past 23 years occurred at (GSR) ratios greater than 64. However, a better indicator of significant lows is the Relative Strength Index of the GSR based on 21 weekly closes combined with the GSR.

Not all significant lows were marked by HIGH ratios and a LOW RSI of the ratio. But, a high ratio along with a low RSI were strongly indicative that a significant price low had just passed (typical) or was due very soon. The low in the RSI usually occurs about two weeks after the actual price low. Think of this as confirmation of the price low.

Gold/Silver Ratio Courtesy kitco.com

Gold/Silver Ratio
Courtesy kitco.com

Further:

July 05, 2013 had a silver low of $18.73 (weekly close – actual low was in June). Silver had fallen 46% in 9 months since a temporary high of $34.57 in October of 2012.

about 4.7 year earlier:

October of 2008 marked a silver low of $9.29 (weekly close – actual low was $8.53). Silver had fallen 55% in 7 months since a high of $20.94 in March of 2008.

about 4.5 year earlier:

May of 2004 marked a silver low of $5.60 (weekly close – actual low of $5.50). Silver had fallen 33% in 1.5 months since a high of $8.31 in April of 2004. The rapid price collapse (only 1.5 months) did not allow the RSI of the ratio to reach a low value. The TDI Trade Signal Line Indicator (an overbought / oversold oscillator) made its lowest (most oversold) reading in July 2013 in the past 39 years – the entire range of my data. Many other oscillators were also deeply oversold and similarly bullish.

The near future for silver prices is uncertain, especially with the increasing use of High Frequency Trading (HFT) and the post 2008 “managed” markets. Perhaps the good people at JP Morgan or Goldman Sachs have another crash planned, which we will find out in due time. But indications are that the big players (JP Morgan etc.) are more long and less short in the paper gold market than in many years, or perhaps ever. Hence they are nicely positioned to profit from a large rise in the price of gold.

Silver seems likely to rally, shoot ahead of gold with a larger percentage increase, and thereby decrease the ratio below 40.

CONCLUSIONS:

Six of eight significant silver market lows in the past 23 years occurred when the GSR (gold to silver ratio) was > 64 and the RSI (Relative Strength Index) of the GSR was < 35.

Silver, in late June and early July 2013, met the above criteria, along with a near record low RSI of the GSR, and a record low in the TDI Trade Signal Line. These are strongly bullish conditions.

Previously, two other important lows occurred about 4.7 years ago, and 9.2 years ago. Both of those lows were followed by explosive rises that took silver prices much higher. The June/July 2013 low looks similar to the 2004 and 2008 lows. We will see if the upcoming rally is similarly explosive or not.

October 2008: $8.53 to nearly $50.00
May 2004: $5.50 to about $21.00

Read: Back to Basics – Gold, Silver and the Economy

GE Christenson
The Deviant Investor

Gold Could Quickly Rally Over $2,000

tenth oz gold-eaglesBy GE Christenson:

Background: Gold prices peaked in September 2011 and have dropped over one-third in the past 22 months. Sentiment by almost any measure is currently terrible. Few in the US are interested in gold (although gold is selling well in China), most have lost money (on paper) if they bought in the last two years, and the emotional pain seems considerable. It reminds me of the S&P, gold, and silver crashes in 2008-9.

So, will gold drop under $1,000 or rally back above $2,000?

To help answer that question, I examined the chart of gold for the last 25 years and identified several long-term cycles. Then, I constructed a spreadsheet that attempted to model the price of weekly gold based on those cycles and a few assumptions.

Assumptions

  • Use only long-term cycles – a year or longer.
  • The weight assigned to each cycle is approximately proportional to its length. A 200-week cycle should be approximately twice as heavily weighted as a 100-week cycle.
  • This is NOT a trading vehicle but a long-term indication of reasonable price projections based on past relationships. Those past relationships may or may not continue, even if they have been valid for over 20 years.
  • Keep it simple. Do not over-complicate the model or aggressively “curve-fit” it.
  • Prices are assumed to rise more slowly than they fall, so 62% of the cycle is related to the rising portion of the cycle, and 38% of the cycle is related to the falling portion of the cycle.

Data

Low-to-Low cycles: 100 weeks, 122 weeks, and 162 weeks

High-to-High cycles: 88 weeks and 270 weeks

Exponential growth: 1/1/1990 – 1/01/2002: growth of negative 3.0%/year, and 01/01/2002 – present: 18% per year, calculated weekly

Process

Find the beginning dates (lows) for the 100, 122, and 162 week cycles and assign those beginning dates an index value of -1.0. Proportionally increase those index values from -1.0 to +1.0, and then reduce those index values from +1.0 to – 1.0, and repeat for each low-to-low cycle. Use the beginning index value on the 88 and 270 week high-to-high cycles as + 1.0. Extend the proportional increases on all time cycles from -1.0 to + 1.0 so that the rising period takes 62% of the cycle time.

Assign each cycle a weight approximately proportional to the cycle length. Use a beginning value and calculate the exponential increase (-3% or +18% per year) for each week, and then add or subtract the percentage changes for each weekly time cycle. Adjust the cycle index weights to obtain the best visual fit on a graph of actual gold prices versus the calculated price of gold.
What Could Go Wrong?

The exponential increase might not continue from 2013 forward. I expect gold prices to accelerate higher, but it is possible that they will continue falling. See Caveats.

The cycles, although relevant for over 20 years, might be less relevant from 2013 forward.

The calculated price was “curve-fit” to the actual prices, and that “curve-fit” result might be less accurate from 2013 forward.

Results
Statistical correlation over the last 20 years is slightly larger than 0.97 (quite high). The calculated gold price is generally consistent with the actual gold price, even though occasional large variations are clearly evident.

Highlights: (based on weekly closing prices)
Calculated high: December 2006 at $779
Actual high: May 2006 at $712

Calculated high: April 2008 at $784
Actual high: March 2008 at $999

Calculated low: April 2009 at $618
Actual low: October 2008 at $718

Calculated high: August 2011 at $1,931
Actual high: September 2011 at $1,874 (daily high was $1,923)

Calculated low: July 2013 at $1,267
Actual low: July 2013 at $1,213 (actual weekly low, so far)
The Future

This simple model, which uses only five cycles and an exponential increase, indicates that a low in the gold price is expected approximately now (May – October 2013), and that the next high is projected for approximately September 2014 – June 2015, possibly in the $2,500 – $3,500 range. (From the current lows, a price of $3,000 seems unlikely, but gold traded below $700 in October 2008 and rose to over $1,900 by September 2011, so a substantial rise is quite possible.)

Caveats!

There are many. This is not a prediction; it is simply a projection based on the entirely reasonable, but possibly incorrect, assumption that gold prices will continue to rise about 18% per year, on average, and that these five cycles will push actual prices well above and below that exponential growth trend.

Why will gold prices continue to increase? Our current monetary system depends upon an exponentially increasing debt and money supply. It seems likely that the US government will continue to run massive budget deficits and thereby increase total debt. In addition, the central banks of Japan, the EU, and the US will continue to monetize debt and increase the money supply to promote asset inflation and to overwhelm the deflationary forces in their respective economies. Gold supply increases slowly, the demand increases more rapidly, while each Dollar, Euro, and Yen purchase less, on average, each year. It seems quite reasonable to expect that gold (and silver) prices will increase substantially from their current low level. Read: Gold & What I Know for Certain.

Timing: The model was basically correct (over the last decade) on timing and price with some large variations. Clearly, there are more factors driving the price of gold than five simple cycles. Those political, HFT, emotional, and economic factors will inevitably push the price higher or lower, sooner or later, than the model indicates. Regardless, the model has some value indicating the approximate price and timing for long-term highs and lows in the price of gold.
Use it while appreciating its limitations. Read: Back To Basics: Gold, Silver, and the Economy.

GE Christenson
aka Deviant Investor

Does The Decline In Gold Signal An Imminent Financial Collapse?

GOLD COINBy: GE Christenson

Unsustainable trends can survive much longer than most people anticipate, but they do end when their “time is up” – at the culmination of their time cycles. Examples of these trends include deficit spending, exponential debt increases, overpriced bond markets, and unbacked paper currencies, to name a few. For perspective on how and when these trends could change direction, we analyzed more than 20 different cycles. They nearly unanimously point to tectonic shifts in the months and years ahead. We have been warned!

At this point, we have enough confirmation to accept that the precious metals crash – starting in April of 2013 – was the first warning of what is coming globally.

Financial crashes and economic collapses are not inevitable, but they seem more likely in the next few years, starting later this summer. Preparation might appear to be a waste of time and resources, but lack of preparation could result in the loss of wealth, incomes, jobs, and lives. Perhaps our leaders will guide the world economies through some upcoming hard times, but they might also aggravate those hard times by following policies that benefit the political and financial elite at the expense of the middle class and the poorer classes. Look at current trends in government and banking, and decide for yourself!

The remainder of this decade is likely to be quite problematic for most of the world’s population, particularly the poor. People who have the majority of their assets in stocks, bonds, and paper debt may also be hurt as the currencies are inflated and purchasing power declines sharply.

We have presented a summary of cycles for stocks and bonds, war, gold and silver. We show the source of the cyclic information, the relevant timing, and some commentary.

Summary

There are many cycles that suggest a stock market correction or crash is near. That correction/crash will probably be accompanied by a correction in the bond market that reverses much of the bullish action of the past 30 years. (Signs of a bond bear market are already visible.) Gold and silver should rally substantially as their cycles are turning up while money flees the stock and bond markets and attempts to find safety in an increasingly dangerous world. Financially and socially, many cycles have turned downward; and many will not bottom until later in this decade. Much can go badly wrong during the next seven years. Now is NOT the time for complacency or procrastination.

Along with the decline in equities, bonds, and the value of paper money will come – probably – more social unrest, considerably higher consumer prices for food and energy, bankrupt local, state and national governments, more debt defaults, higher unemployment, possible monetary and/or economic collapse, and a likely escalation in regional and global wars.

A gradual cooling (NOT warming) will reduce crop yields and drive already expensive food prices much higher. The world’s poor will suffer. Hungry people are inclined to rebel and threaten governments. Hence governments will become more repressive and will increase their information gathering on all those viewed as potentially threatening to the status quo.

(Read entire article here.)

GE Christenson

aka Deviant Investor

“Sentiment on Gold and Bonds Incredibly Negative” – Marc Faber Predicts Endless QE

Liberty-EagleIts hardest to buy at bottoms since you never know where the bottom is.  Equally hard to do is to buy when the sentiment is incredible negative as it was in early 2009 for stocks and 2000  for gold and silver.
Marc Faber, editor of Gloom Boom & Doom Report discussed the current status of the global markets and investment strategies on Bloomberg Television.

Faber said that the sentiment on gold and bonds in incredible negative and that the Fed, regardless of who winds up replacing Bernanke, will be forced to engage in endless monetary stimulus.   According to Faber “as I said already three years ago, we are going to go with the Fed to QE99.”

Faber notes that the cost of living continues to increase  on a global basis and the benefits of QE are mainly benefiting the richest members of society who hold large amounts of assets.  As money printing destroys the purchasing power of the middle class there will be worldwide social unrest which has already erupted in numerous countries.

As to what the price of gold will be at year end, Mr. Faber declined to speculate saying that “I am not a prophet but I will continue to buy gold.”

Some People Are Celebrating The Gold Collapse – Taking A Long Term View On The Future

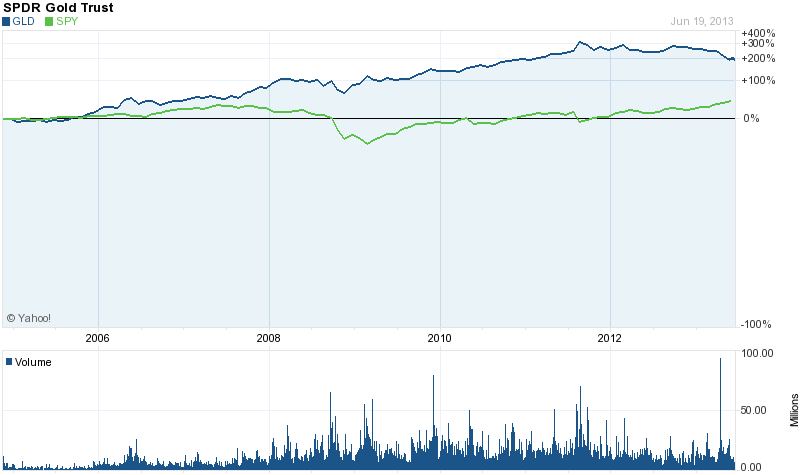
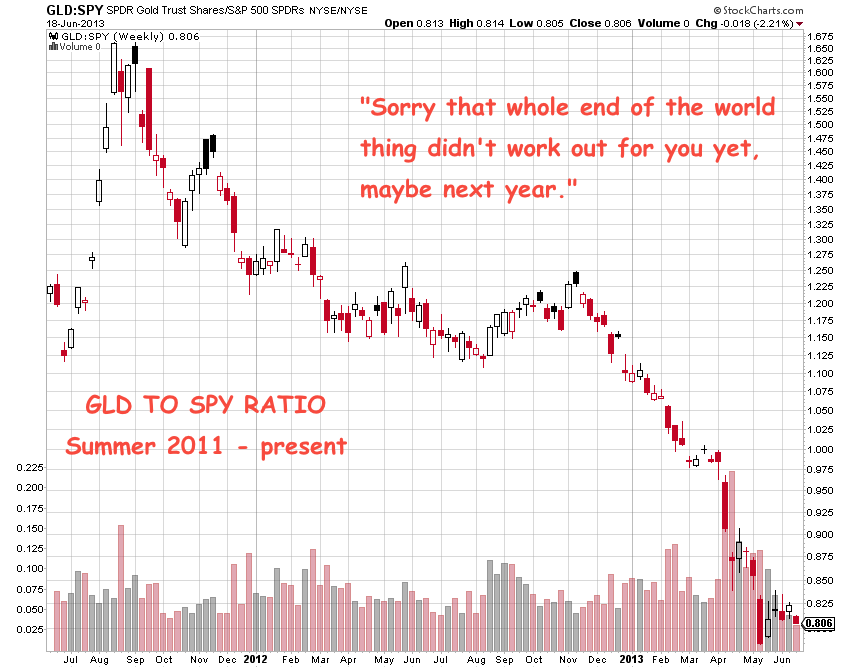
American-Gold-EagleMany financial bloggers who never bought into the “yes, it’s important to own some gold” theory have been almost hysterically gloating over the recent divergence between gold and stocks.  An example of this is a recent blog post comparing the performance of the SPDR Gold Trust (GLD) to the Standard & Poor’s 500 (SPY).

Reality cannot be ignored – owning stocks over the past two years has been a black hole for investors compared to stocks

Here’s the ugly chart proving that investors who thought that precious metals had a golden future are wrong.

Courtesy: thereformedbroker.com

Courtesy: thereformedbroker.com

Short term views can be misleading and the biggest gains are made by making the right investment and holding for the long term. The picture of the GLD vs. the SPY looks quite different if we go back to 2005.

courtesy: yahoo finance

courtesy: yahoo finance

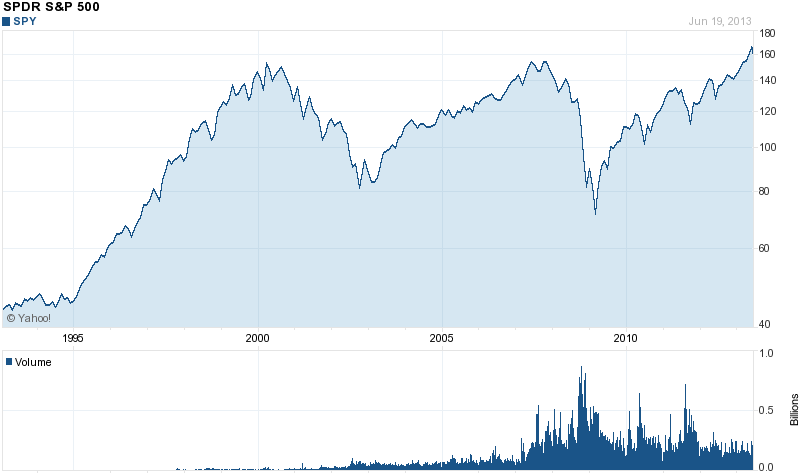
In addition, let’s not forget that the stock market as measured by the S&P 500 is just about where it was over a decade ago in 2001.

courtesy: yahoo finance

courtesy: yahoo finance

Considering the perilous state of world economic affairs and notwithstanding the recent significant drop in the price of precious metals, maintaining a position in gold and silver seems like a prudent long term option.

Barclays Sees Gold At $1,500 By Year End

gold buffaloIs there any hope for a recovery in gold and silver prices by year end?

Precious metals analyst Suki Coper discuses the prospects for the gold and silver markets in an interview with Bloomberg Television.

Ms. Coper notes that silver tends to follow the gold market but should show more price weakness relative to gold.  In order for the price of silver to stabilize, the precious metal needs investment support from both the industrial and investment side.   Economic weakness in both China and Europe currently portend weak industrial demand for silver.

Despite the current weakness in both gold and silver, Ms. Coper sees the price of gold approaching $1,500 by the end of the year.

Since the beginning of the year, the price of gold has dropped by $303 per ounce or 18%, to a closing price of $1,378.50 at the close of Tuesday’s trading in London.

courtesy: kitco.com

courtesy: kitco.com

Silver’s price decline has been even steeper than gold with a drop of $9.07 per ounce or 29.4% since the beginning of the year.

courtesy: kitco.com

courtesy: kitco.com

Why All Governments Hate Gold

bars-of-goldMOTIVE: The various governments of the world and their central banks produce and distribute a product – paper currencies. Those currencies are backed by confidence, faith, and credit, but not by gold, oil, or anything real. Those currencies are digitally printed to excess, since almost all governments spend more than their revenues. The UK, Japan, and the USA are prime examples.

Politicians want to spend more money, but they also need to maintain the illusion that the money is still valuable, that it will retain most of its purchasing power over time, and that inflation is under control. The illusion weakens when food, gasoline prices, and other consumer goods are wildly rising in price. At a more abstract level, gold indicates the same lack of confidence in the printed pieces of paper that our central banks distribute.

Hence, central banks and governments have a strong motive to “manage” the inevitable price increases in gold. They have a motive to suppress the price and to allow it to rise gradually over time, while occasionally smashing it down and temporarily destroying confidence in gold as an alternative to unbacked paper currencies. The press helps by regularly claiming gold is in a “bubble.”

Yes, there is a clear and compelling motive.

MEANS: This brings up a heavily debated topic – do governments and central banks have the means to manage the price of gold? Ask yourself these questions:

  • Did banks manipulate rates in the LIBOR market?
  • Does the Federal Reserve (and other central banks) set (manage – manipulate) interest rates in the credit markets?
  • Do banks exercise considerable influence over regulators and Congress?
  • Are the various central banks of the world centers of power and wealth?
  • Do they use their wealth and power to achieve their policy objectives?
  • If the Fed can create and lend/loan/swap/give away over $16 Trillion dollars after the 2008 crisis, is it possible that some of that $16 Trillion was used to influence the gold market?
  • Did Greenspan, when he was Chairman of the Federal Reserve, make a statement in 1998 that central banks were ready to lease gold if the price of gold rose? Link is here.
  • If central banks lease gold to bullion banks and those banks SELL that gold into the market, would that have any influence on price?
  • Are central banks allowed to claim leased gold, which they no longer physically possess, as an asset on their balance sheet? (Lease it into the market but still claim they have it – this works until they run out of gold or the physical gold is audited.)

Yes, central banks and governments have the MEANS to suppress the price of gold.

OPPORTUNITY: As long as:

  • Governments spend more than their revenues
  • Central banks and governments control their gold in secrecy
  • Physical gold is not audited (last real audit of the USA gold was about 60 years ago)
  • Gold can be leased out while being listed as owned,

then there is opportunity.

Further, if a few billion dollars can be created and then used by a futures trader, and that trader sells (naked shorts) a large number of gold contracts on the futures exchange, that will drive the gold price down rapidly. Look at the chart of gold prices for April 11 – April 16 and ask yourself if that looks like a managed market.

Yes, central banks and governments have the OPPORTUNITY to suppress the price of gold.

But there is more to the story!

Central banks and governments have, to one degree or another, the motive, means, and opportunity to manage the price of gold. Clearly, their bias is to hold the price of gold low and to restrict its upward movement. Similarly, they want bond and stock markets to move higher, but that is another story.

YOU have motive, means, and opportunity to protect yourself and to profit from this process.

You know that unbacked paper currencies are declining in purchasing power. The path is erratic but clearly lower over the last four decades. You want to protect your purchasing power – you have a MOTIVE to own gold instead of owning devaluing currencies that pay next to nothing in interest.

You probably have paper dollars that are “invested” in stocks, bonds, IRAs, and other savings. You have the MEANS to protect yourself. Sell some paper and buy gold. The Chinese and Russians are doing it as rapidly as they can. What do they see that you might not fully understand?

You have the OPPORTUNITY to buy gold and silver at a huge discount to their real value – just my opinion – but both are “on sale” at current prices. (Gold is currently priced about the same as in late 2010.) “But can’t they go lower?” Yes, of course, gold could drop to $1,000, the Middle East could be transformed into a region of tranquility, peace, and cooperative people, and the US Congress could balance the budget. But as long as governments and central banks are “pushing paper,” digitally printing unbacked currencies, and overspending their revenues, the price of gold will increase – just my opinion – to much higher than it is today.

Gold and silver are in long-term bull markets. One of the objects of a bull market is to arrive at the peak with very few long-term participants. The “bull” wants to buck you off periodically. It usually happens. Basic human nature – fear and greed – makes it difficult to ride the bull most of the way up and exit at the proper time. Fortunately for gold and silver bulls, there are many more years of deficit spending and increasing debt that will push metals prices much higher.

Read from the DI: Why Buy Gold?

GE Christenson
aka Deviant Investor