 By: GE Christenson
Six of eight significant silver market lows in the past 23 years occurred when the GSR (gold to silver ratio) was > 64 and the RSI (Relative Strength Index of the GSR was < 35.
Silver, in late June and early July 2013, met the above criteria, along with a near record low RSI of the GSR, and a record low in the TDI Trade Signal Line. These are strongly bullish conditions.
Previously, two other important lows occurred about 4.7 years ago, and 9.2 years ago. Both of those lows were followed by explosive rises that took silver prices much higher. The June/July 2013 low looks similar to the 2004 and 2008 lows. We will see if the upcoming rally is similarly explosive or not.
October 2008: $8.53 to nearly $50.00
May 2004: $5.50 to about $21.00
The Analysis:
Much has been made of the gold to silver ratio. It is currently (August 8, 2013) about 64, with gold about $1312 and silver about $20.41. After examining the data for the GSR for the past 23 years, we find that:
• The highest ratio was about 102 in February of 1991. (silver very low) • The lowest ratio was about 32 in April of 2011. (silver quite high) • The average ratio (weekly closes) since 1/1/1990 has been about 65. • The average ratio for the past 10 years has been lower at about 58.
All significant price lows in the past 23 years occurred at (GSR) ratios greater than 64. However, a better indicator of significant lows is the Relative Strength Index of the GSR based on 21 weekly closes combined with the GSR.
Not all significant lows were marked by HIGH ratios and a LOW RSI of the ratio. But, a high ratio along with a low RSI were strongly indicative that a significant price low had just passed (typical) or was due very soon. The low in the RSI usually occurs about two weeks after the actual price low. Think of this as confirmation of the price low.
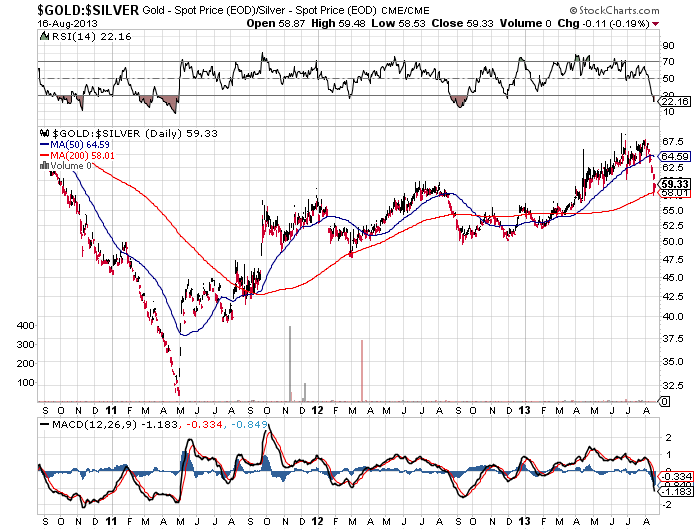
Gold/Silver Ratio
Courtesy kitco.com
Further:
July 05, 2013 had a silver low of $18.73 (weekly close – actual low was in June). Silver had fallen 46% in 9 months since a temporary high of $34.57 in October of 2012.
about 4.7 year earlier:
October of 2008 marked a silver low of $9.29 (weekly close – actual low was $8.53). Silver had fallen 55% in 7 months since a high of $20.94 in March of 2008.
about 4.5 year earlier:
May of 2004 marked a silver low of $5.60 (weekly close – actual low of $5.50). Silver had fallen 33% in 1.5 months since a high of $8.31 in April of 2004. The rapid price collapse (only 1.5 months) did not allow the RSI of the ratio to reach a low value. The TDI Trade Signal Line Indicator (an overbought / oversold oscillator) made its lowest (most oversold) reading in July 2013 in the past 39 years – the entire range of my data. Many other oscillators were also deeply oversold and similarly bullish.
The near future for silver prices is uncertain, especially with the increasing use of High Frequency Trading (HFT) and the post 2008 “managed” markets. Perhaps the good people at JP Morgan or Goldman Sachs have another crash planned, which we will find out in due time. But indications are that the big players (JP Morgan etc.) are more long and less short in the paper gold market than in many years, or perhaps ever. Hence they are nicely positioned to profit from a large rise in the price of gold.
Silver seems likely to rally, shoot ahead of gold with a larger percentage increase, and thereby decrease the ratio below 40.
CONCLUSIONS:
Six of eight significant silver market lows in the past 23 years occurred when the GSR (gold to silver ratio) was > 64 and the RSI (Relative Strength Index) of the GSR was < 35.
Silver, in late June and early July 2013, met the above criteria, along with a near record low RSI of the GSR, and a record low in the TDI Trade Signal Line. These are strongly bullish conditions.
Previously, two other important lows occurred about 4.7 years ago, and 9.2 years ago. Both of those lows were followed by explosive rises that took silver prices much higher. The June/July 2013 low looks similar to the 2004 and 2008 lows. We will see if the upcoming rally is similarly explosive or not.
October 2008: $8.53 to nearly $50.00
May 2004: $5.50 to about $21.00
Read: Back to Basics – Gold, Silver and the Economy
GE Christenson
The Deviant Investor