April 18, 2024

Gold Has Outperformed Stocks By 300% Over The Past Decade

By Axel Merk

Superior Performance of Gold

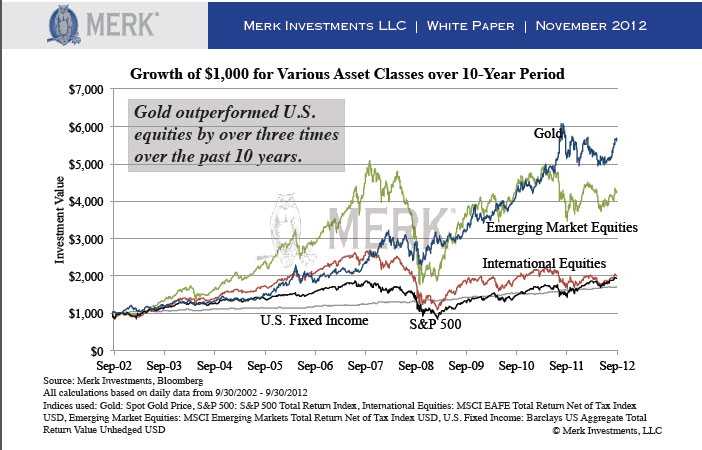
Over recent years, gold has performed remarkably well relative to other asset classes, in terms of both absolute performance and risk-adjusted performance. Over the preceding 10 years, an investment in gold would have significantly outperformed a corresponding investment in the S&P 500 Index or U.S. bonds, not to mention international and emerging market equities. Over the past 10 years, gold outperformed U.S. equities by over three times:

Courtesy: merkinvestments.com

Gold Shines even when Under-performing

Note that even during time periods when gold underperforms other asset classes, as it did during the 20-year time period analyzed above, the addition of a gold component improves the overall risk-adjusted return profile of a risky portfolio. We consider this to be largely driven by the low levels of correlation between the two assets and thus the positive impact it has on the volatility profile of the hypothetical portfolio above. For example, we find that a portfolio comprised 50% gold and 50% the S&P 500 would have exhibited an annualized standard deviation of returns of 12.7% over the 20-year period ended September 30, 2012.  This is a significant reduction to the annualized standard deviation of returns exhibited by a portfolio comprised 100% the S&P 500, which was 19.2% over the same time frame.

Read the full article here.
Gold Ready For Explosive Rally Based On Sentiment, Seasonal Factors and Fed Money Printing

Gold has had a volatile year.  From January’s opening price of $1,598, gold quickly moved up by $183 per ounce by the end of February.  An ensuing correction that lasted into July brought the price of gold down by $225 per ounce to $1,556 in mid July, the low of the year.  In August gold started to rally, closing yesterday at $1716.25 per ounce, up $118.25 or 7.4% on the year.
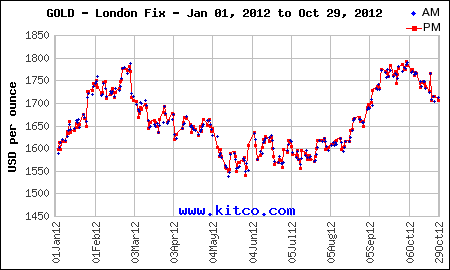
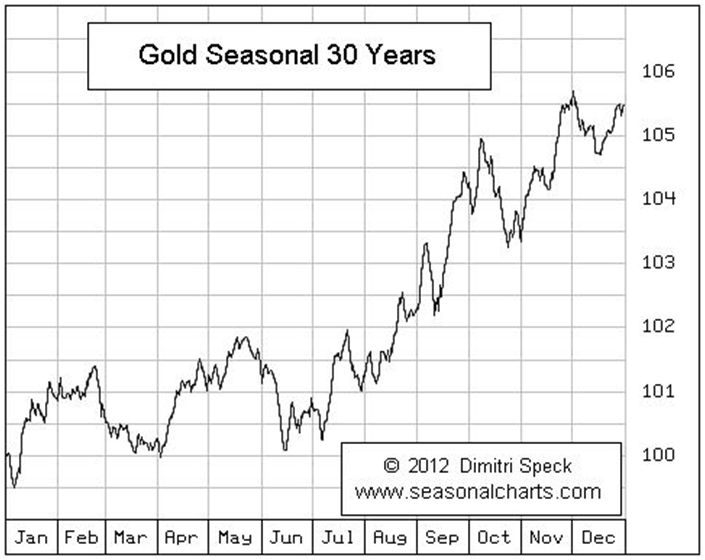
Gold now appears ready to mount an explosive rally that could easily push prices past $2,000 based on sentiment, seasonal factors and rampant money printing by the Federal Reserve.

Gold Traders Bullish

According to Bloomberg, gold traders are the “most bullish in 10 weeks…the highest level since August 24.  Gold rallied strongly from August 24th, adding $124 per ounce by October 4th.

Gold traders are the most bullish in 10 weeks and investors are hoarding a record amount of bullion as central banks pledge to do more to spur economic growth.

Eighteen of 27 analysts surveyed by Bloomberg expect prices to rise next week and five were bearish. A further four were neutral, making the proportion of bulls the highest since Aug. 24. Holdings in gold-backed exchange-traded products gained the past three months, the best run since August 2011, data compiled by Bloomberg show. They reached a record 2,588.4 metric tons yesterday, the data show.

The Bank of Japan (8301) expanded its asset-purchase program on Oct. 30 for the second time in two months, increasing it by 11 trillion yen ($137 billion). The Federal Reserve said last week it plans to continue buying bonds and central banks from Europe to China have pledged more action to boost economies. Gold rose 70 percent as the Fed bought $2.3 trillion of debt in two rounds of quantitative easing from December 2008 through June 2011.

“Central banks are all very concerned about a depression, so they’re keeping monetary policies as loose as possible,” said Mark O’Byrne, the executive director of Dublin-based GoldCore Ltd., a brokerage that sells and stores everything from quarter-ounce British Sovereigns to 400-ounce bars. “People are buying gold as a store of value to protect against currency depreciation.”

Seasonal Factors

Gold has a pronounced seasonal tendency to rally strongly in the last quarter of the year.  The chart below from GoldCore shows the seasonal strength of gold over the past 30 years.

Courtesy goldcore.com

Rampant Money Printing By The Federal Reserve

Central Banks worldwide have gone on a money printing rampage to save governments that are unable to control spending or raise sufficient tax revenues.  David Einhorn, President of Greenlight Capital, who has a brilliant investment track record, is rampantly bullish on gold and raises the question of what type of truly desperate measures central banks will take if the world economy enters another recession or suffers an exogenous shock.

“It seems as if nothing will stop the money printing, and Chairman Bernanke in fact assures us that it will continue even after the economic recovery strengthens.  Even after the economy starts to recover more quickly, even after the unemployment rate begins to move down more decisively, we’re not going to rush to begin to tighten policy.  Apparently, anything less than a $40 billion per month subscription order for MBS is now considered ‘tightening’.  He’s letting us know that what once looked like a purchasing spree of unimaginable proportions is now just the monthly budget.”

“If Chairman Bernanke is setting distant and hard-to-achieve benchmarks for when he would reverse course, it is possibly because he understands that it may never come to that.  Sooner or later, we will enter another recession.  It could come from normal cyclicality, or it could come from an exogenous shock.  Either way, when it comes,  it is very likely we will enter it prior to the Fed having ‘normalized’ monetary policy, and we’ll have a large fiscal deficit to boot.  What tools will the Fed and the Congress have at that point? If the Fed is willing to deploy this new set of desperate measures in these frustrating, but non-desperate times, what will it do then?  We don’t know, but a large allocation to gold still seems like a very good idea.”

Big Money Is Bullish On Gold

Big money managers are bullish on gold according to the pros interviewed in Barron’s latest fall survey.  A resounding 69% of big money managers are bullish on gold and 22% forecast that precious metals will be the best performing asset class over the next six to twelve months.

Courtesy Barron’s

The big money is bearish on Federal Reserve strategy with over 60% of poll respondents disapproving of the Fed’s current interest rate policy.  Reinforcing their low opinion of Fed strategy, an overwhelming 78% of the pros believe that additional Fed easing policies will be counter productive.  Summing up the general opinion on Ben Bernanke’s money printing schemes, one money pro said “The Fed is well past the point of interest-rate policy having any meaningful impact on the economy.  Bernanke & Co. now risk damage to both the dollar and the Fed’s own balance sheet.  This is the biggest misallocation of capital in the history of mankind.”

Not surprisingly, the overwhelming consensus (89%) of the big money pros think that treasuries are severely overvalued.  Although the pros don’t see interest rates rising significantly in the next six months, Barron’s notes that even a small increase in interest rates would result in losses to bondholders.  The Fed has manipulated interest rates to such a low level, that few money pros see any value in treasuries.  One money pro noted that without massive security purchases by the Fed, the 10 year bond would currently yield 5%, representing a real yield of 2% plus 3% for inflation.   Absent Fed efforts to suppress free market yields on treasuries, bondholders would be faced with shocking losses as interest rates rose.

The big money bearish sentiment on Bernanke and bullish forecast for gold tells us that the pros don’t expect implementation of sound monetary policy by the Fed any time soon.

Why Are Americans Underinvested In Gold and Silver?

Although there are no definitive statistics on how many Americans own gold or silver, the number is certainly small.  A Gallup poll earlier this year showed that 28% of respondents thought that gold was the “best investment” but the actual number of people actually owning some form of gold or silver bullion is far less.  A Kitco poll indicated that the number of Americans owning precious metals may be as low as 1%.
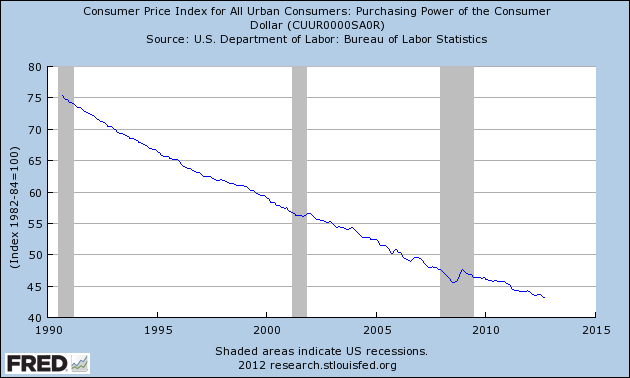
Despite the steady erosion in the purchasing power of the U.S. dollar, Americans retain their faith in paper money, apparently oblivious to the destruction of their wealth.  Monetary debasement is an insidious process that few Americans fully understand as explained by economist John Maynard Keynes in 1921.

“By a continuing process of inflation, Governments can confiscate, secretly and unobserved, an important part of the wealth of their citizens. By this method they not only confiscate, but they confiscate arbitrarily; and, while the process impoverishes many, it actually enriches some …. Those to whom the system brings windfalls …. become “profiteers” who are the object of the hatred … the process of wealth-getting degenerates into a gamble and a lottery .. Lenin was certainly right. There is no subtler, no surer means of overturning the existing basis of society than to debauch the currency. The process engages all the hidden forces of economic law on the side of destruction, and does it in a manner which not one man in a million is able to diagnose.”

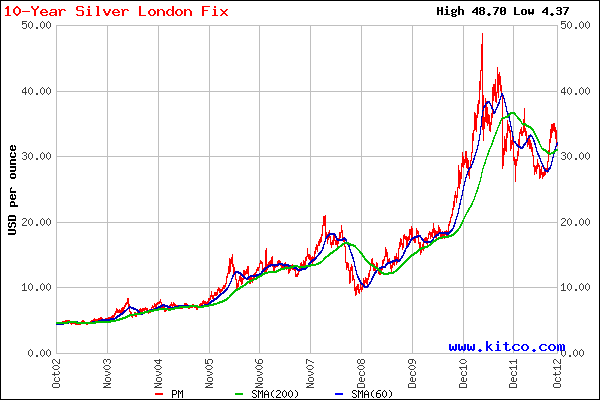
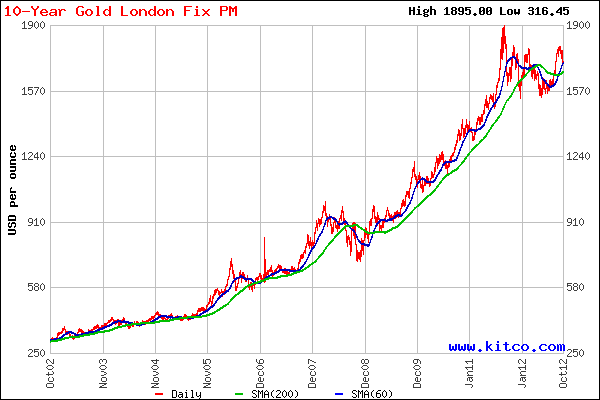
Most Americans don’t bother trying to understand economic theories but it is not hard to understand the following charts.

courtesy: kitco.com

When the average American finally realizes what is happening to the value of the dollar, the rush to gold and silver will result in a massive upward surge in precious metal prices.  That day has not yet arrived and until it does, buy gold and silver with impunity, especially on corrections.

Global Gold Production Set For Major Decline As South African Mines Close

Global gold production could drop sharply as South African miners plan to dismiss thousands of workers for illegally striking.  South African precious metal miners have been beset by labor unrest for months as workers protest low wages and dangerous working conditions.  The latest disruption came Wednesday as South Africa’s largest gold miner announced plans to dismiss about 12,000 workers.
South Africa’s biggest gold miner by output, AngloGold Ashanti Ltd., said Wednesday it will begin a process to dismiss about 12,000 workers, following in the footsteps of other mining companies desperate to end crippling strikes.

If AngloGold follows through on its threat, it means more than 35,000 mining workers at several companies have been dismissed for illegally striking in recent weeks. The mass firings have prompted criticism from unions and the government, but so far have not provoked a repeat of the violence that sparked national labor unrest in South Africa in August.

Several major South African gold and platinum producers are struggling to end weeks of wildcat strikes that have halted thousands of ounces of gold and platinum production and caused billions of rand in lost revenue.

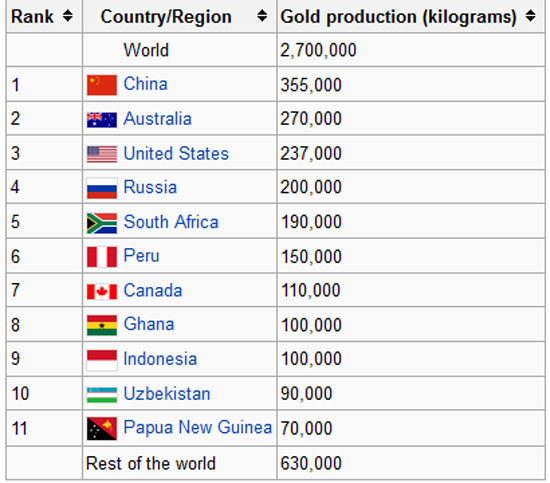
Gold production problems in South Africa run deeper than merely resolving a labor/management dispute over low wages.  The cost and effort to mine gold has grown exponentially as the easy to reach grades of gold ore have been depleted.  Miners have had to dig much deeper to reach low grades of ore with a corresponding increase in extraction costs.  South Africa, once the leading country in gold production has dropped to fifth place.

Courtesy wikipedia.com

In 2006, South Africa produced 272,128 kilograms of gold, but by 2011 output had plunged by 30% to only 190,000 kilograms.  With workers no longer willing to work for what amount to slave labor wages, along with declining ore reserves, gold output from South African mines will continue to decline dramatically.  SBG Securities analyst David Davis says “Almost all of the gold mines on strike are mature.  These mines were going to have to be restructured and downsized anyhow in the next 12 to 36 months.”

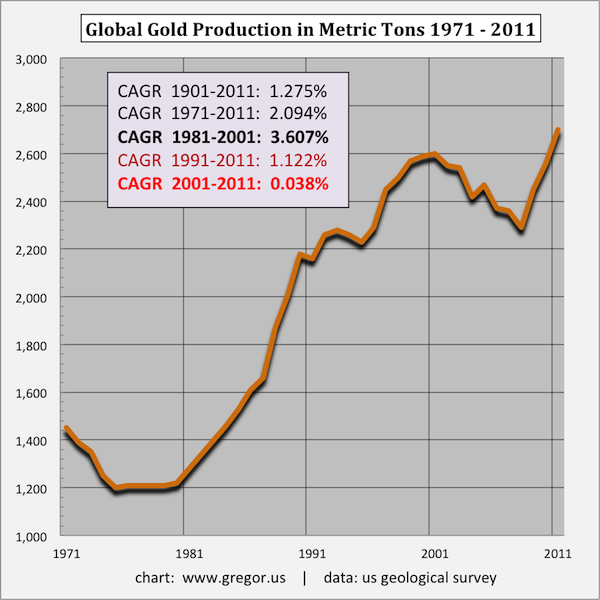
Further reductions in future global gold supply will continue based on the constantly increasing costs of mining lower grade ores and the lack of major new gold discoveries.  According to the US Geological Survey, gold production decreased in every year from 2001 to 2008, a remarkable statistic in light of the huge increase in gold prices during that period of time.  Gold sold for only around $300 per ounce in 2001 compared to today’s price of over $1,700 per ounce.

Over the past three years from 2009 to 2011, gold production increased as miners went all out to take advantage of surging gold prices.  According to the World Gold Council, mine production rose from 2,611 tonnes in 2009 to 2,822 tonnes in 2011.  The previous production peak for yearly gold production occurred in 2001 at 2,600 tonnes.  As the current situation in South Africa shows, much of the recent increase in gold production came as mining companies desperately worked old mines to depletion while paying workers as little as possible.   Those days are now over and South African gold production will continue to plummet.

Ironically, gold production soared from 1981 to 2000 as gold declined in price from $750 per ounce in 1981 to under $300 by the turn of the century.  Gold miners were forced to produce as much gold as possible to stay in business as revenues constantly declined due to the drop in the price of gold.

Absent major new discoveries of large gold deposits, gold mining production could decline substantially in future years.  Declining supplies, along with massive currency printing by central banks worldwide, will create the perfect storm for a continuation of the decade long bull market in gold.  Note to Ben Bernanke – no, you can’t print gold.

Would A Romney Victory Cause Gold To Collapse?

By Axel Merk & Yuan Fang

Monetary Cliff?

As the presidential election is rapidly approaching, little attention seems to be getting paid to the question that may affect voters the most: what will happen to the “easy money” policy? Federal Reserve (Fed) Chairman Bernanke’s current term will expire in January 2014 and Republican candidate Mitt Romney has vowed that if elected, he would replace Bernanke. Given the tremendous amount of money the Fed has “printed” and the commitment to keep interest rates low until mid-2015, the election may impact everything from mortgage costs to the cost of financing the U.S. debt. Trillions are at stake, as well as the fate of the U.S. dollar.

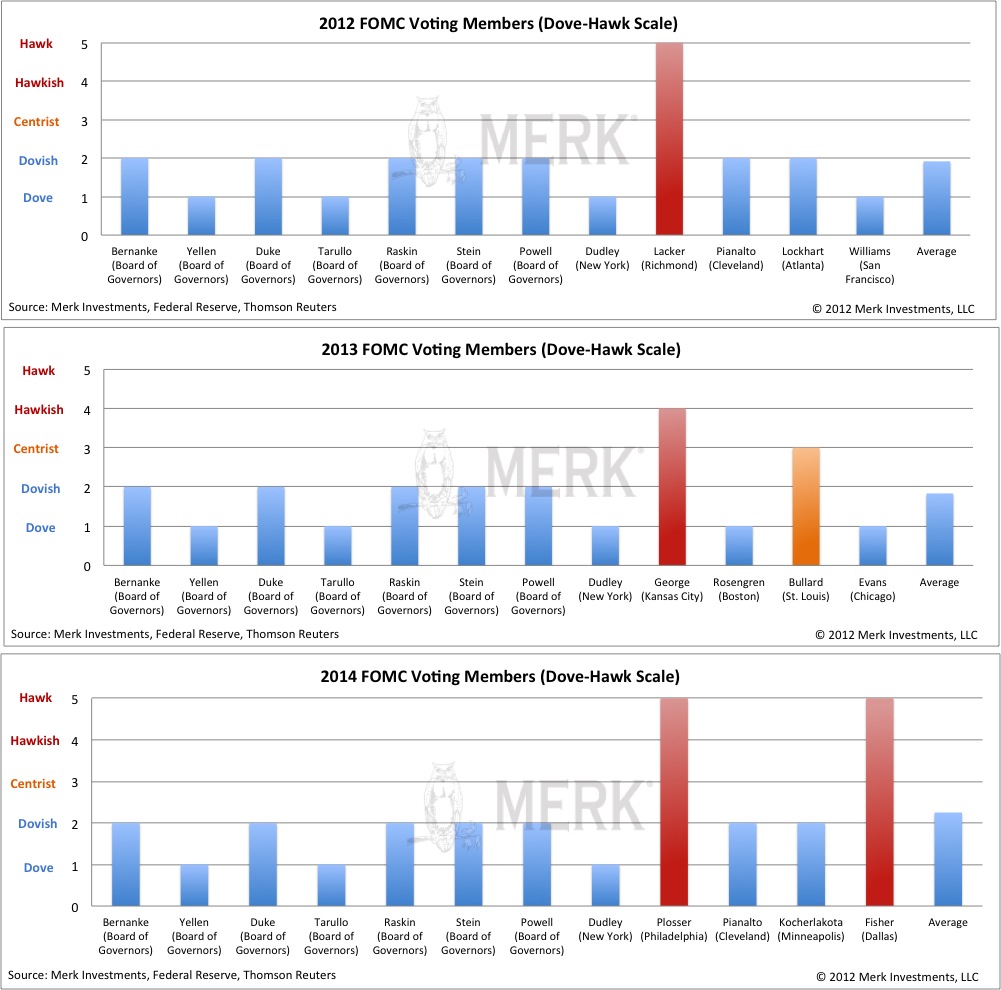
Should Obama be re-elected, Bernanke might continue to serve as Fed Chairman; other likely candidates include the Fed’s Vice Chairman Janet Yellen and Obama’s former economic advisor Christina Romer. With any of them, we expect the Fed policy to be continuingly dominated by the dovish camp, and moving – with varying enthusiasm depending on the pick of Fed Chair – towards a formal employment target, further diluting any inflation target. We are not only talking about Bernanke and the other two candidates’ individual policy stances (though all three are known as monetary “doves”, i.e. generally favoring more accommodative monetary policy), but also the composition of voting members of the Federal Open Market Committee (FOMC), as we will discuss below.

If Romney were to be elected, a front-runner for the Fed Chairman post is Glenn Hubbard, Dean of Columbia Business School and a top economic adviser to Romney. Hubbard has expressed his skepticism about the mechanism that Bernanke used to boost the economy. In our analysis, an FOMC led by Hubbard (or another Romney appointee) will be leaning toward mopping up the liquidity sooner. Extending forward guidance to mid-2015 will also be under question. It will no doubt add uncertainty to monetary policy and increase market volatility.

More importantly, however, a “hawkish” Fed Chair, i.e. one that favors monetary tightening, might put to the test Bernanke’s claim that he can raise rates in “15 minutes”. Technically, of course, the Fed can raise rates by paying interest on reserves held at the Fed or sell assets acquired during various rounds of quantitative easing. The challenge, no matter who the Fed Chair is going to be, is the impact any tightening might have on the economy. Bernanke has cautioned many times that rates should not be raised before the recovery is firmly “entrenched.” What he is referring to is that market forces may still warrant further de-leveraging. If the stimulus is removed too early, so Bernanke has argued, the economy might fall back into recession. A more hawkish Fed Chair, such as a Glenn Hubbard, may accept a recession as an acceptable cost to exit monetary largesse; however, because there is so much stimulus in the economy, just a little bit of tightening may well have an amplified effect in slowing down the economy. Keep in mind that European countries are complaining when their cost of borrowing rises to 4%, calling 7% unsustainable. Given that the U.S. budget deficit is higher than that of the Eurozone as a whole, and that our fiscal outlook is rather bleak, it remains to be seen just how much tightening the economy can bear. Our forecast is that with a Republican administration, we are likely to get a rather volatile interest rate environment, as any attempt to tighten may have to be reversed rather quickly. Fasten your seatbelts, as shockwaves may be expressed in the bond market and the “tranquility” investors have fled to by chasing U.S. bonds may well come to an end. Foreigners that have historically been large buyers of U.S. bonds may well reduce their appetite to finance U.S. debt, with potentially negative implications for the U.S. dollar.

Let’s dig a little deeper and look at who actually decides on interest rates: it is the voting members of the FOMC that ultimately make the imminent monetary policy decisions, rather than the noise creating pundits and non-voting members.

Three factors will further boost the dovish camp, which already dominates the FOMC committee:

    • Two previously vacant seats on the Fed’s Board of Governors were recently filled by Jeremy Stein and Jerome Powell this May. Like other board governors, both Stein and Powell appear to be in favor of Bernanke’s dovish policy. Stein was a Harvard economics professor and used to be more ‘hawkish’ before he took office. But in his first keynote speech as a board governor on Oct. 11, Stein openly supported QE3 and called for continuing asset purchases in absence of a substantial improvement in the labor market. Jerome Powell was a lawyer and private equity investor as well as an undersecretary under George H.W. Bush. Powell has also expressed support for more easing, with inflation an afterthought. Their appointments not only fill all voting seats at the Fed for the first time since 2006, but also further increase the board’s dove-hawk ratio from 9-1 to 11-1. The influence will also carry on to the following years, as board governors hold non-rotating voting rights.
    • Additionally, four current voting members will be replaced next year, including Richmond Fed president Jeffrey Lacker, who has dissented in every FOMC meeting this year. Regional Fed Presidents, unlike Governors, vote on a rotating basis. In 2013, Kansas Fed president Esther George is likely to be the only voting member who appears to hold a hawkish stance. George has expressed her opposition to QE3 and the Fed’s balance sheet expansion, echoing her predecessor Thomas Hoenig’s hawkish tone. But given that she is not a Ph.D. economist, her passion and influence is likely to be more on regulatory than monetary issues; we doubt she will be as vocal as Hoenig or Lacker. In our assessment, the FOMC committee may be “über-dovish” in 2013.
    • Finally, Minneapolis Fed President Narayana Kocherlakota, who was known as a monetary policy hawk, has recently shifted to a more dovish stance. He surprised the market with remarks supporting the Fed’s decision to keep rates extraordinarily low until the unemployment rate has fallen below 5.5%, as long as inflation remains below 2.25%. Kocherlakota will be a voting member in 2014, but his shift of stance will weaken the hawkish voice. With fewer dissidents on the board, the Fed may continue to err firmly on the side of inflation and stick to to its mid-2015 low rate pledge.

No matter who wins the election, we will see a policy dilemma for the Fed in the coming years: On the one side, should economic data continue to surprise to the upside, it will be increasingly difficult for the Fed to carry on its dovish policies. On the other side, if the Fed were to abandon its current commitment, we foresee rising market volatility. The U.S. economy is likely to face a “monetary policy cliff” in addition to the “fiscal cliff”. With easy money, inflation risks may well continue to rise, possibly imposing higher bond yields (lower bond prices) and a weaker dollar. With tight money, the Fed may induce a bond selloff. Historically, because foreigners are active buyers of U.S. bonds, the dollar has weakened during early and mid-phases of tightening, as the bond bull market turns into a bear market. It’s only during late phases of tightening that the dollar has historically benefited as the bond market turns yet again into a bull market. We encourage investors to review their portfolios to account for the risk that bonds may be selling off, taking the U.S. dollar along with it.

Please sign up to our newsletter to be informed as we discuss global dynamics and their impact on gold and currencies. Please also register for our Webinar on Thursday, November 8th, 2012, where we will focus on implications on China and Asian currencies.

Axel Merk

Axel Merk is President and Chief Investment Officer, Merk Investments

Yuan Fang is a Financial Analyst at Merk Investments and member of the portfolio management group.

U.S. Mint Numismatic Precious Metals Sales Decline

According to Coin Update, sales of numismatic precious metal coins showed weekly sales declines.  Future sales, however, may increase due to an upcoming price decrease based on the recent correction in precious metal prices.

The latest report of the United States Mint’s numismatic product sales shows mostly lower numbers for precious metals products. Elsewhere in the report, the Chester Arthur Presidential $1 Coin and Alice Paul Bronze Medal Set makes its debut.

Ten out of sixteen gold numismatic products showed weekly sales declines compared to the prior period. The US Mint currently has these products priced based on an average gold price within the $1750 to $1799.99 range. With the market price of gold below this range for the entire reporting period, buyers may be showing restraint as they await the next weekly pricing adjustment.

Eighteen out of twenty-seven of the silver numismatic products showed weekly sales declines compared to the prior period. The US Mint raised prices for many of these products earlier in the month when the market price of silver was approaching $35 per ounce. Silver has since fallen back from this level, although the higher product prices remain in effect. The America the Beautiful Five Ounce Silver Coins showed sales declines across all nine options currently available. Gains were seen for the 2012 Proof and 2012-W Uncirculated Silver Eagles compared to the prior period.

The 2012 Proof Platinum Eagle, which is the only available platinum product, showed negative sales on the week.

See the full sales report for U.S. Mint numismatic products here.

Month to date figures for U.S. Mint gold and silver bullion coins remains strong.  Through October 24th, the U.S. Mint sold 2,584,000 one ounce American Eagle Silver Bullion coins.  If the current sales pace continues, monthly sales could exceed 3.5 million ounces which would be the second best monthly sales total after January when 6,107,000 silver Eagles were sold.

Sales of the American Eagle Gold Bullion coins also remain strong through October 24th with 48,500 ounces sold.  If the current pace of sales is maintained, total sales of the American Gold Bullion coins should reach almost 65,000 for October which would be the third highest sales month of the year.  In January the U.S. Mint sold 127,000 ounces of gold bullion coins followed by 68,500 ounces in September.

Although gold prices have soared over the past decade and the purchasing power of the dollar has collapsed, the American public still does not recognize the value of gold and silver as a store of wealth.  Expect this to change as the bull market in precious metals continues.

The Fed’s Efforts To “Print” New Jobs Is Failing – What Does The Fed Do Next?

In an effort to expand credit and spur job creation, the Federal Reserve has massively expanded its balance sheet with the most aggressive monetary policies in the history of the Federal Reserve.  Since the start of the financial crisis, the Fed instituted two rounds of quantitative easing under which over $2.75 trillion of debt securities were purchased by, in effect, printing money.
The first two phases of quantitative easing resulting in soaring stock and gold prices but did little to reduce the unemployment rate which has remained stubbornly high.  In early September, Fed Chairman Bernanke went all in on his aggressive monetary policies with the announcement of QE3 under which the Fed will conduct open-ended asset purchases.

The Federal Reserve said it will expand its holdings of long-term securities with open-ended purchases of $40 billion of mortgage debt a month in a third round of quantitative easing as it seeks to boost growth and reduce unemployment.

“We’re looking for ongoing, sustained improvement in the labor market,” Chairman Ben S. Bernanke said in his press conference today in Washington following the conclusion of a two-day meeting of the Federal Open Market Committee. “There’s not a specific number we have in mind. What we’ve seen in the last six months isn’t it.”

Stocks jumped, sending benchmark indexes to the highest levels since 2007, and gold climbed as the Fed said it will continue buying assets, undertake additional purchases and employ other policy tools as appropriate “if the outlook for the labor market does not improve substantially.”

Bernanke is enlarging his supply of unconventional tools to attack unemployment stuck above 8 percent since February 2009, a situation he called a “grave concern.”

Bernanke said the open-ended purchases would continue until the labor market improved significantly. “We’re not going to rush to begin to tighten policy,” he said. “We’re going to give it some time to make sure that the economy is well established.”

While the U.S. has “enjoyed broad price stability” since the mid-1990s, Bernanke said, “the weak job market should concern every American.”

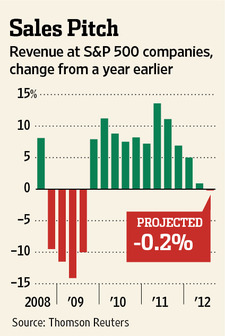
Although Bernanke’s goal is laudable, many consider his extreme monetary policies ineffective while massively debasing the value of the U.S. currency.  Printing money is not the primary precursor for job creation or increased national wealth, and the latest economic results prove this assertion.  Sales revenues of America’s largest corporations have declined for six consecutive quarters and companies have fired the largest number of employees since 2010.

Courtesy Wall Street Journal

If economic conditions continue to deteriorate, expect Bernanke to implement even more extreme unconventional monetary policies,  all of which would involve money printing on an unimaginable scale.

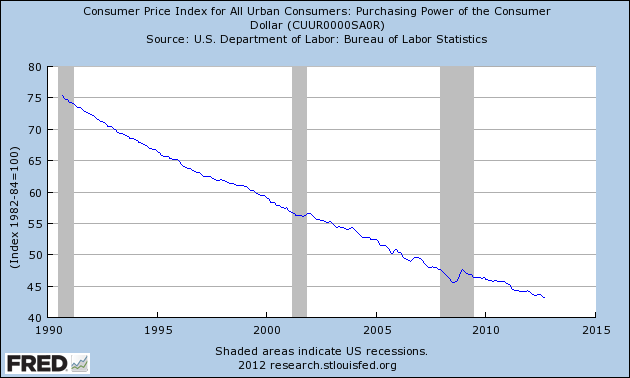
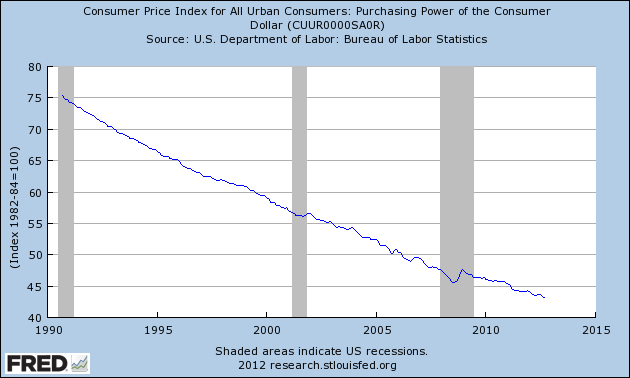
The ludicrous assertion by Fed Chairman Bernanke that the U.S. has “enjoyed broad price stability” since the 1990’s is revealed as an outright falsehood by the Fed’s own statistics on the loss of purchasing power of the U.S. dollar.  Meanwhile, gold, the only currency with any intrinsic value is reflecting the true extent to which the U.S. dollar has been debased by Fed policies.  As the economy weakens and the Fed expands its monetary madness, the price of gold will continue to soar.


Is The Gold Correction Over? A Technical Look At Gold, HUI And The U.S. Dollar

By Vin Maru

Gold Analysis

Looking at the gold chart below, we can see that gold has been correcting over the last two weeks. When applying some technical analysis to the gold chart, we can clearly see that there would have been overhead resistance at $1800 since most of the year gold has traded between $1550 and $1800. A few weeks ago, we also noticed a big build in the short position on the Comex’s Commitment of Traders report COT by the commercial and bullion banks. The effort to stop gold’s advance at a key resistance level was successful in part because of the huge increase in the short position at that level, which is why we knew to take some profits and that would be an ideal place for a correction to start.

Now that the correction has started and gold is giving back some of its gains from the summer, the question now remains: How much of a retracement will we see on the price of gold? While the shorts are currently in control of driving the price down, support will come from other central banks and buyers of physical gold.

With gold at $1701, it is currently (noon on Tuesday Oct. 24) sitting below the 50 dma at $1720 which is above the 200 dma at $1662. The first line of support for this coming week was at $1720 and if it holds above the 50 dma the correction in gold could be over. If we continue to see weakness in gold over the next week or two, we can expect the correction will continue later this month and going into elections. This is something I suspect could happen if the overall markets continue to remain week.

Looking at the chart we suspect that buying will come in at the new support price range at about $1650 (+ or – $20) if the 50 dma at $1720 doesn’t hold this coming week. One thing to note is that the 50 dma crossed above the 200 dma around the end of September, which is an over good sign. However it needs to remain above the 200 dma for this advance higher in gold to hold before it can go on to make new highs. We remain optimistic that gold will either bounce here at the 50 dma of $1720 or at a retest of the 200 dma of $1662, which would still be bullish over all. If you are looking to add to your physical gold holdings and diversifying them internationally, scaling in now and at the $1650 price range would be a good place to start adding to current or new positions. Keep in mind that the support at the 200 dma may not hold, which means the price of gold can retrace right back to longer term support at $1550 which has been in place all year. However, I give it a small probability that we will correct back to that price range as we are entering a seasonally strong part of the gold cycle in November and December.

While I hate making predictions on what the gold price will do short term, I suspect it could consolidate between $1650 – $1750 for the remainder of the year. While we are entering a stronger part of the gold season and the fundamentals are lined up to suggest higher prices, we have conflicting events such as a huge concentrated short position, the US elections, the US fiscal cliff and tax loss selling to deal with for the remainder of the year. With 2 strong opposing forces acting on one another, the price of the metal may consolidate around $1650 – $1750 for some time until either the bulls or bears clearly take this market in one direction or another. Until then, all we can do is sit around and wait for a clear break outside the trading range that has been established over the last year.

HUI Gold Miners Index Analysis

Just like gold, the HUI index is also correcting since September. Earlier last month, we thought index would trade to 520 before meeting resistance, which we can clearly see it has done and it is now in the process of correcting. It would not be unusual for the index to give back up to 50% of its recent gains from the summer lows. Back in July, it looks like a low of 385 was made on the index and a recent high of 525 was achieved back in September; this is a 140 point gain. So if the market was to give back 50% of this gain or 70 points, we can expect the HUI to retrace back to about 455, which would be the next best time to add to positions.

Currently the HUI is at 495 which is still above the 50 dma at 482 and the 200 dma at 465, which is a positive alignment if the index can hold these gains. One thing to pay attention to from the chart below is the price action on the HUI from April this past year to the end of August, a period called the summer doldrums. During this period support came around 385 and was tested 2 different times, while overhead resistance was at 450 which also was tested a couple of times. Back then 450 was overhead resistance which was finally broken with a strong move higher during September; we suspect this will now become the new support level while 520 will act as resistance.

While we still remain cautiously optimistic that a new uptrend has started longer term, the HUI will most likely correct back to the 460 range ( + or – 10 points) over the coming months and 520 will now act as overhead resistance as a new trading range will be set. In general, support around 465 (the 200 dma) is where we would look to initiate new positions in some of the senior producers and hold them going into the New Year. At some point, I do expect overhead resistance at 520 will be breached to the upside at which point the HUI index could run to 580 and higher, but that would mean gold would have to be on fire and trading above its overhead resistance at $1800 on a holding basis. Until then, the miners will probably trade in a range where the HUI fluctuates between 460 and 520 as long as gold stays above $1650.

US Dollar Analysis

While the US dollar is looking good at the moment and getting a nice little bounce higher lately, this could be very short lived. The up channel that has been in place from August 2011 to August 2012 has been clearly broken and now it has started a new down trend channel this past August.

All we are seeing is a current bounce from oversold levels on the RSI and MACD and it already seem to be stalling out. The US dollar could move slightly higher to test the 50dma of 80.38 or the top of the new down channel at 81, but the rally should stop there. One thing to note is that the 50 dma just crossed below the 200 dma in the last few days, that is not a good sign. Once this relief rally is over, the dollar should continue downward and possibly to the bottom end of this downward channel. This could mean a definitive move below recent support around 78 on the index, if this happens and support is broken, it could lead to a cascading move downwards towards 75 or possibly 73.75 as the next major support level. If the dollar does break down, gold and silver will shoot much higher.

The best hope for the US dollar is for it to sit in a channel between 78 and 81.50 which is where I think it could trade sideways for some time until we clear the elections and get some direction on fiscal policy from the Fed.  If the dollar goes sideways, G and S will also trade in a sideways channel. More than likely we will get some clear direction once the election are done.


If you enjoyed reading this article and are interested in protecting your wealth with precious metals, you can receive our free blog by visiting TDV Golden Trader.   Also learn how you can purchase and protect your gold holdings by getting a copy of our special report Getting Your Gold out of Dodge or protecting the stock investments you currently own with Bullet Proof Shares.

Gold Expected To Continue Higher – World Gold Council Releases Q3 2012 Report

The third quarter 2012 Investment Statistics Commentary released today by the World Gold Council summarizes the performance of gold in various currencies and explores reasons why demand for gold should continue to increase.
Highlights of the Q3 2012 Report

During the third quarter, gold had a return of over 11% as central banks expanded measures to stimulate the economy.  The correlation of gold to other assets exhibited similar characteristics as those seen during the previous quarter.

Unconventional expansionary monetary policies were continued during the third quarter and are expected to increase going forward.  The primary goal of central bank policies include lowering borrowing costs and re inflating asset prices.

While financial assets have surged based on central bank monetary measures, gold has exhibited the strongest correlation to quantitative easing.

The World Gold Council expects investment demand for gold will remain strong based on the following four factors:

– Inflation risk
– Medium-term tail-risk from imbalances
– Currency debasement and uncertainty
– Low real rates and emerging market real rate differentials

The full report from the World Gold Council can be viewed at gold.org.

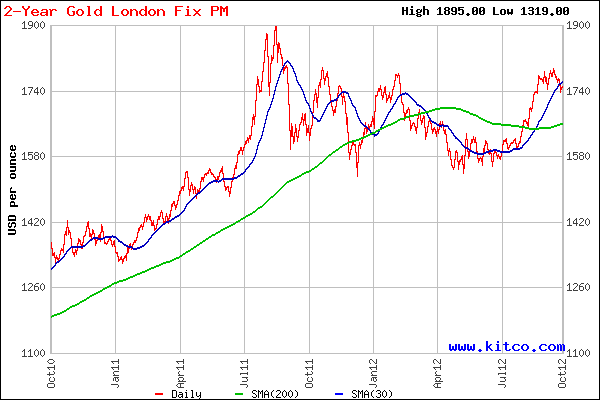
Gold has made what appears to be a triple bottom over the past year in the $1,580 range.  A breakout above last year’s high of $1,900 could wind up signaling the next phase of the gold bull market.

courtesy kitco.com