 Robust gold demand and dwindling ore deposits represent an imbalance between supply and demand that almost guarantees higher long term gold prices. As discussed in Peak Gold, almost all of the earth’s supply of gold reserves have already been mined.
At the end of 2012 it is estimated that all the gold ever mined in history totaled approximately 173,000 metric tonnes. According to the Perth Mint, a study done by Natural Resource Holdings estimates that there are only about 56,674 metric tonnes of recoverable gold reserves left. If this bleak assessment is correct, over 75% of the world’s total gold reserves have already been mined.
Further confirmation of the basic imbalance between supply and demand for gold can be seen in today’s release by the World Gold Council of gold demand trends for the first quarter of 2014.
- Global jewellery demand rose 3% in the first quarter to 571 tonnes
- Total investment demand fell slightly to 282 tonnes from 288 tonnes last year
- The outflows from gold ETFs slowed dramatically to 0.2 tonnes compared to 177 tonnes in the first quarter of last year
- Gold purchases by central banks was 122 tonnes in the first quarter, the 13th consecutive quarterly that central banks were net purchasers
- Mine production increased by 6%
Although mine production increased slightly in the first quarter, new gold discoveries have plunged and the quality of ore reserves being mined is declining. The Wall Street Journal reports that One argument for Big Gold: There ain’t much gold left.
The depletion of global gold mines, and the resulting increase in extraction costs, is one of the main forces pushing gold miners to combine as they look for efficiencies or to gain access to rivals’ high-grade deposits.
“There is every reason to do that deal, and the reasons not to do it weren’t geology, but man-made,” said Douglas B. Groh, a fund manager at Tocqueville Asset Management LP, which owns Newmont stock. “The nature of geology is such that gold does not occur in large volumes, but the capital exploiting it is robust.”
The gold industry ramped up exploration as prices increased by a factor of six from 2001 through 2012 to $1,750 a troy ounce. Prices since have tapered off to around $1,300 an ounce.
Discoveries also have tapered off. In 1995, 22 gold deposits with at least two million ounces of gold each were discovered, according to SNL Metals Economics Group. In 2010 there were six such discoveries, and in 2011 there was one. In 2012: nothing.
Even in Nevada, which mines around three-quarters of all U.S. gold, production has dropped a third since peaking in 1998. Around 40% of Newmont’s and Barrick’s production comes out of Nevada, with that possible economy of scale a big factor in their proposed merger.
“Deposits are simply harder to discover,” said John Muntean, an associate professor of mines and geology at the University of Nevada.
There also is simply less gold to unearth. All the gold ever mined could fit in a 60-foot cube. At around 0.005 parts per million, gold’s presence in the Earth’s crust is minute compared with that copper, at over 50 parts, or iron, at more than 50,000.
Miners are plowing through available gold reserves faster than they are other metals. Global gold production was equal to 5.1% of the 54,000 tons in available reserves last year, according to the U.S. Geological Survey, theoretically meaning it would take 19.5 years to exhaust supply. That compares with 38.5 years for copper and 28 years for iron ore.
On a long term basis, the supply and demand situation in the gold market strongly suggests much higher prices in the future.


 Gold has been on a rampage since the early 2000’s with yearly gains for 12 years in a row. Nothing lasts forever and the number 13 is starting to look very unlucky for gold. Barring a major upset in the world financial system, it looks increasing likely that gold will decline in the 13th year of its long rally in the year 2013.
 In an
In an 
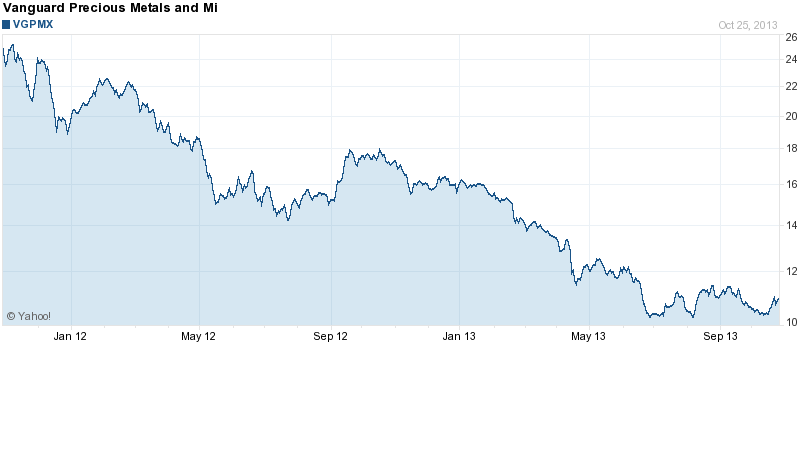
 The bear case for gold and silver stocks is well known and investors have reacted by dumping mining stocks indiscriminately. The staggering decline in gold and silver stocks over the past two years now exceeds the decline that occurred during the crash of 2008 when the financial system was at the brink of collapse.
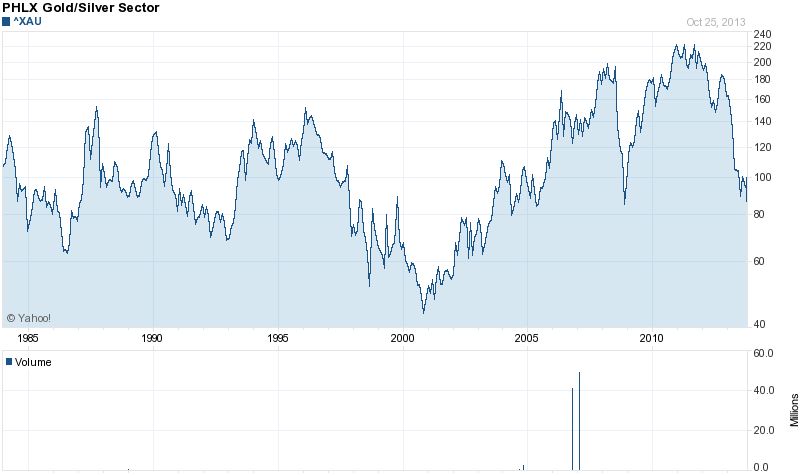
 Kyle Bass recently summed up the thoughts of many gold investors when he said “the largest central banks in the world, they have all moved to unlimited printing ideology. Monetary policy happens to be the only game in town. I am perplexed as to why gold is as low as it is. I don’t have a great answer for you other than you should maintain a position.”


 By
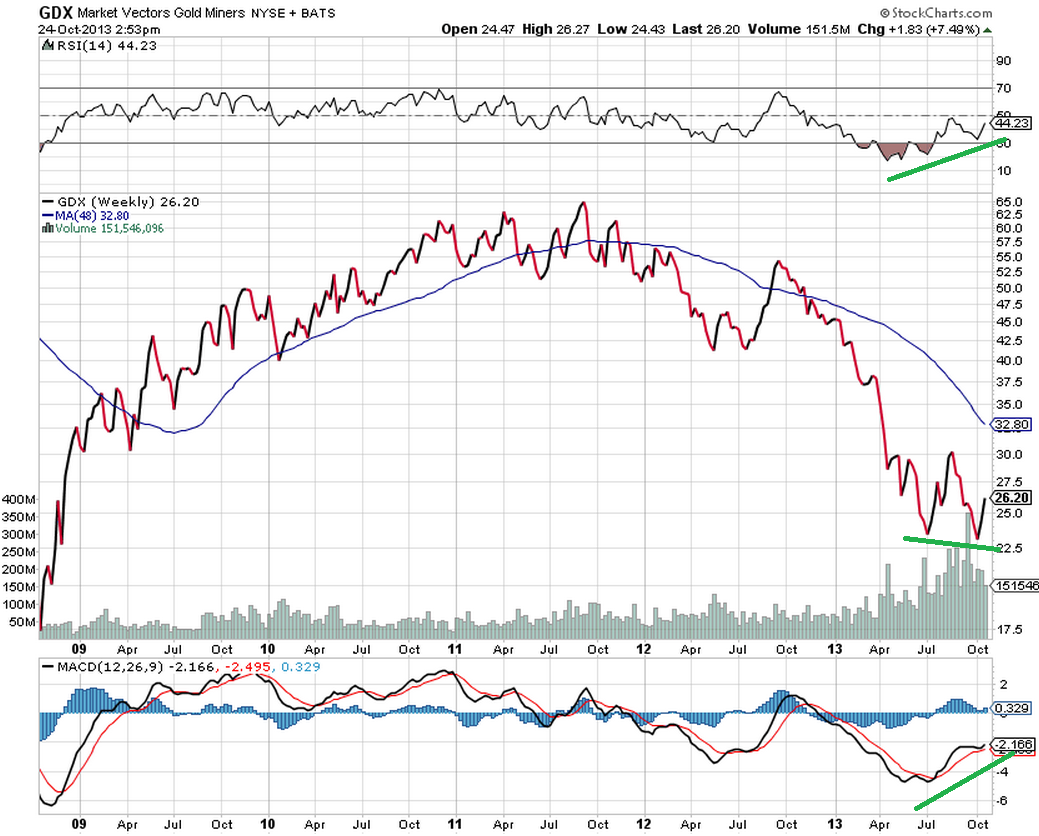
By  General Outlook for Gold and the Miners

