March 28, 2024

Gold’s Next Big Move Is Up – Every Bull Market Has Pullbacks

gold generalBy: GE Christenson

Gold peaked in August of 2011 and fell erratically into December 2013.

Was that the end of the collapse, or is there more downside coming in gold prices?

Bearish Scenario: Listen to the banks who are forecasting weak prices in 2014 and thereafter. “Nothing to see here folks, the dollar has weakened drastically since 1971, gold sells for 30 times its 1971 price, but it’s all good. Just move on and pretend… Gold will drop below $1000 before you can say 2016 elections…”

I’m not a fan of:

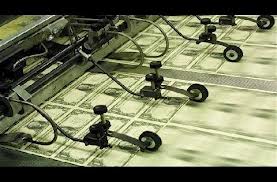
The bearish gold scenario when decades of Federal Reserve “printing” and US government budget deficits have all but guaranteed continued destruction of the purchasing power of the dollar.

Belief that even though dollar debasement practices have accelerated since the 2008 crash, gold prices will fall because bankers say so.

Propaganda that gold is useless and that unbacked debt based fiat currencies are solid and stable.

Large High Frequency Trading companies that short the gold market, loudly proclaim that gold prices will fall, dump a huge number of paper contracts on the Comex, quietly cover their shorts after the gold price crash, book huge profits, and then reverse the process as they push prices up. These traders are in the business of making profits so none of this is surprising.

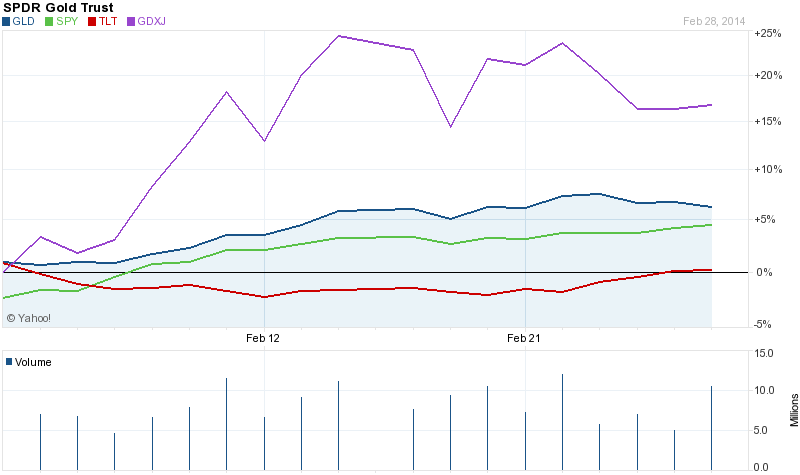
Instead of listening to self-serving banker opinions, let’s examine the data. The following chart shows monthly prices for gold since 2000. Note that highs and lows as listed in the monthly data are slightly different from actual hourly highs and lows. For this analysis over 14 years, the differences are immaterial.

This table shows the price and approximate number of years.

table3102014

Summary: The price of gold bottomed in 2001, rallied for 3.0 years, fell for 1.1 years, rallied for 2.8 years, fell for 0.6 years, rallied for 2.8 years, and fell for 2.4 years. Lows were about 4 years apart, highs were about 3.5 years apart, and the rallies lasted, on average, about 3 years.

Gold in December of 2013 had dropped to the lower logarithmic
trend line after falling for 2.4 years. The patterns suggest that the next move should be a rally that lasts approximately 3 years to new highs near the top of the trend channel well above $3,500.

roosevelt

But there is more: (If you distrust Technical Analysis, skip this section.)

  • Gold prices made a double-bottom in June and December 2013 thereby indicating a successful test of the lows formed in June.
  • The MACD – a technical indicator (first chart) which tracks the difference between two moving averages – registered a very low reading in December 2013. Further, the moving averages in the indicator have turned up. This is strongly supportive of the analysis that December marked a major low in gold prices.
  • The TDI-Trade-Signal line – another technical indicator (first chart) – registered its lowest reading in 15 years at the June 2013 low and has also turned up. This is another strong indication that gold bottomed in December.
  • The RSI – Relative Strength Index – as shown on the second chart was at a 15 year low at the June 2013 gold price lows. It has turned upward.
  • The disparity index, which is simply the deviation between the monthly prices and the 12 month simple moving average (second chart), was at a 30 year low and flashing a buy signal after the June 2013 gold price lows.

For those who have no faith in technical analysis:

Consider this GEM – Gold Equilibrium Model (thanks to Nick Migliaccio for the name). I summarized the model in this short article. The model is based on three variables and calculates the equilibrium gold price with no reference to oscillators or technical indicators. The GEM model projects a “fair” or equilibrium price for gold in March 2014 of approximately $1,580. Gold prices, based on this long-term model, are currently low and are likely to move much higher over the next several years. This long-term model produced an excellent statistical correlation with the smoothed price of gold over the 42 years from 1971 – 2013.

Conclusions

  • The GEM indicates that, over the next several years, gold prices are headed much higher.
  • The chart of gold prices since the year 2000 (log scale) shows a “megaphone pattern” of higher lows and higher highs. Currently the gold price is near the bottom of the exponentially up-trending pattern.
  • Technical oscillators indicate important bottoms in June and December – at levels not seen in more than a decade.
  • The disparity index shows that gold prices in June were well below the 12 month moving average. Similarly daily and weekly prices were well below their moving averages. Prices tend to regress to the mean – another indication that prices are likely to rise from the deep lows in June and December.
  • Short term prices could rise or fall a little from here – I’m offering no opinion – but gold prices should be much higher in 2015 and 2016.
  • Gold is for savings and investing, not trading. Dollars buy groceries while gold buys safety, insurance, and peace of mind.
  • As Darryl Robert Schoon always says, “Buy gold, buy silver, have faith.” It is good advice.

GE Christenson, aka Deviant Investor

Gold Bear Forecasts $500 Price Plunge Even as Gold Prices Climb

Physical-GoldWhen gold was hitting new highs during 2011 the mainstream media was full of articles with “experts” predicting further price gains but the exact opposite happened.

As speculators, short term traders, and price manipulators  took the price of gold down by over $600 an ounce the experts switched their tune and the chorus of gold bears grew steadily.  By the end of 2013 when declining prices had shaken out all the weak hands in the gold market and all the experts were bearish, prices had nowhere to go but up.

With the start of the new year gold ignored the bears and has been on a tear in 2014.  Two months into the new year with gold bullion and gold stocks far outpacing the gains in stocks and bonds, the “experts” still insist that it’s time to bail out of gold before prices collapse.

Gold vs stocks and bonds

Courtesy: yahoo finance

The Top Two Gold Forecasters selected by Bloomberg remain steadfast in their views that gold is undergoing a dead cat bounce that will soon run out of steam.

“I just see this as a corrective move,” said Robin Bhar, the head of metals research at Societe Generale SA in London and the most-accurate forecaster tracked by Bloomberg in the past two years. “We would still want to be bearish gold,” said Bhar, who expects a fourth-quarter average of $1,050.

“Haven demand plays well when gold is cheap, but it’s no longer cheap,” said Justin Smirk, a senior economist in Sydney at Westpac Banking Corp. and the second most-accurate forecaster tracked by Bloomberg in the past two years. “I’m a little surprised by the volatility in the market, but it really doesn’t change my overall view,” said Smirk, who expects a slide through the year to a fourth-quarter average of $1,020.

Barron’s took note this week of The Gold Rally’s Fatal Flaws forecasting that a tighter Fed policy, low inflation along with an easing of investment demand from China and India will send gold prices lower.

Another concern is that gold prices are already up so much that investors in China and India are suffering sticker shock. The two nations together account for roughly half of the world’s gold demand, buying gold gifts to celebrate weddings, birthdays, and religious festivals. These regular purchases help create a floor for the market and were instrumental in stemming the violent sell-offs that gold suffered last year.

BUT WHILE SOME Indian and Chinese buyers felt they were getting gold on sale in December, when prices dipped below $1,200 an ounce, this is no longer the case. “For gold, physical demand keeps slipping as the price moves up,” says Walter de Wet, head of commodity strategy at Standard Bank.

Even more bearish was commentary by respected analyst Mark Hulbert who notes that the sentiment among short term gold market timers has soared to the bullish side in the past month, typically a contrary bearish omen.

Even more wildly bearish is Claude Erb, a professor at Duke University interviewed by Hulbert who is forecasting a major crash in the price of gold.


Erb, along with Duke University finance professor Campbell Harvey, was the co-author of a January 2013 study published by the National Bureau of Economic Research — which I featured in a February 2013 column for Barron’s on the price of gold. The study suggested that gold remained significantly overvalued, even though its bear market at that point was already 16 months old. By the end of the year gold had shed nearly $500 an ounce.

Unfortunately for the gold bulls, Erb’s and Harvey’s study suggests gold is still overvalued. One valuation indicator they point to is equivalent to a stock’s price/earnings ratio: It is the ratio of gold’s price to the Consumer Price Index. According to their calculations, and given the historical average level for this gold/CPI ratio and where the CPI index currently stands, gold’s “fair value” today is around $820 an ounce — about $500 lower than where it now trades.

The reasons articulated above for being bearish on gold and silver have already been well advertised and discounted by the markets which is probably why gold and silver have been soaring this year.  It wouldn’t be surprising if the “experts” are wrong and gold and silver turn out to be the best place to keep your money this year.

U.S. Mint Bullion Coin Sales for February 2014 Show Silver Up, Gold Down

2013-w-gold-eagleSales of bullion coins by the U.S. Mint were mixed in February with silver bullion coins showing an increase and gold bullion coins a decline.

After hitting all time record sales in 2013 sales of the American Silver Eagle bullion coins are off to a slower sales pace in 2014.  According to the U.S. Mint a total of 3,750,000 silver bullion coins were sold in February, up by 381,500 ounces or 11.3% over the comparable prior year period.  February 2014 year to date sales of silver bullion coins total 8,525,000 ounces, down by 2,341,500 ounces or 21.5% from the previous year.

Retail investors have long regarded silver bullion coins as an excellent investment.  The price pullback in silver since 2011 provided an excellent opportunity to make additional purchases at bargain prices and investor took advantage of the situation.  Silver bullion coin demand soared last year to almost 42 million ounces and the U.S. Mint could not keep up with demand.  Demand for silver coin was so great that the U.S. Mint ran out of coins and suspended sales for most of December and part of January 2014.

Sales of silver bullion coins are shown below by year.  The sales for 2014 are through February 28th.  Sales of silver bullion coins have exploded since the financial meltdown of 2008 when the Federal Reserve began printing trillions of dollars out of thin air, a program which continues to this day.

Sales of the American Eagle gold bullion coins slowed dramatically in February compared to last year.  Total sales of gold bullion coins was 31,000 ounces compared to 80,500 last February.   2014 year to date sales through February totaled 122,500 ounces compared to 230,500 ounces for the comparable prior year period.

Gold coin sales can fluctuate considerably from month to month but sales have exploded since the financial crisis in 2008 and remain very high by historical standards.  After declining for three years in a row, sales of gold bullion coins strengthened during 2013 with sales above 2012 levels.

2014 totals through February 28th.

According to Reuters the decline in gold bullion coin demand was due to large sales of coins by hedge fund speculators and other large investors.  As the sale of these coins flooded into dealer vaults they had less need to purchase coin from the U.S. Mint.

american-silver-eagle

The American Eagle silver bullion coins cannot be purchased by individuals directly from the U.S Mint.  The coins are sold only to the Mint’s network of authorized purchasers who buy the coins in bulk based on the market value of silver and a markup by the U.S. Mint.  The authorized purchasers sell the silver coins to coin dealers, other bullion dealers and the public.  The Mint’s rationale for using authorized purchasers is that this method makes the coins widely available to the public with reasonable transaction costs.

U.S. MINT BULLION COIN SALES
MONTH GOLD SILVER
2014 2013 2014 2013
JANUARY       91,500   150,000    4,775,000     7,498,000
FEBRUARY       31,000      80,500    3,750,000     3,368,500
TOTALS     122,500   230,500    8,525,000   10,866,500

With economic and political turmoil spreading across the globe and central banks standing ready to flood the world with paper currencies, gold and silver continue to remain a safe haven for many investors.  It would not be surprising to see gold and silver surge in price this year in defiance of the bearish calls of many analysts.

The Ultimate Irony – Gold Bullion Is a Poor Investment According to “Too Big To Fail Banks”

coinAnalysts at the “Too Big To Fail” banks are unanimously predicting lower gold prices and telling their clients to dump gold.

On January 12, 2013 Goldman Sachs predicted that gold could fall to as low as $1,000 this year due to a less expansive monetary policy by the Federal Reserve.

In a report to clients this week Morgan Stanley analysts cut their price targets on gold for both 2014 and 2015 citing a strong global economy, rising interest rates and a reduced need for safe haven assets.

Not wanting to miss out on the “gold is dead party” Wells Fargo chimed in this week with their opinion that investors should eliminate their gold exposure on any rallies.

banks gone wild

The irony of the herd mentality on gold by the Too Big To Fail banks is beyond incredible.  Yes, these are the same “Too Big To Fail” banks who were selling billions of A rated mortgage backed securities to clients in 2007 that suddenly all defaulted in 2008.  Cynical types who remember the financial meltdown in housing of a few years back may also recall that the same banks now advising clients to dump gold were telling home buyers with shit credit and no income that, yes, you can afford that $800,000 house.

The big banks analysts seem to be engaging in a major group think exercise that justifies their dire predictions for future gold prices based on nothing more than an extrapolation of the gold price over the past two years.  We won’t even get into the part about how everyone at the big banks that almost blew up the financial world wound up getting bonuses instead of jail terms.

bankers

In any event there are many people who are ignoring the sage advice of the “Too Big To Fail” banks and buying gold anyways.

Japanese investors, who are growing increasingly alarmed by the concerted efforts of Prime Minister Abe to put Japan back on the “right track” by creating inflation with printing press money, are buying gold at a frenetic pace.

Gold sales by Japan’s biggest bullion retailer surged 63 percent to a five-year high as prices slumped and investors sought refuge from Prime Minister ShinzoAbe’s campaign to stoke inflation and weaken the yen.

Sales of bars to local investors by Tanaka Kikinzoku Kogyo K.K. soared to 37.3 metric tons in 2013, from 22.9 tons a year earlier, the Tokyo-based company said in a statement today. Sales exceeded purchases for the first time since 2004.

Demand for physical gold in China is also exploding as investors seek a safe haven asset that cannot be produced in infinite supply by the central banks of over indebted nations.

Increased demand in China, which probably overtook India as the world’s largest consumer last year, helped gold rebound from a six-month low of $1,182.52 on Dec. 31. China imported 1,017 tons of gold from Hong Kong in the first 11 months of 2013, almost double 2012’s total, Hong Kong government data show.

With the universally bearish outlook for gold by big money managers don’t be surprised if gold outperforms all other assets classes in 2014.

14 Tough Questions Gold Investors Have for the Federal Reserve

Liberty-EagleBy: GE Christenson

“Those who cannot remember the past, are condemned to repeat it.” George Santayana.

1. What mistakes from the past are we condemned to repeat?

2. Since unbacked paper currency systems have always failed in the past, why have bankers and economists promoted an unbacked paper currency system since 1971?

3. Would the Federal Reserve, which is owned by private banks, seek to enrich its member banks and the financial elite by implementing monetary policies such as QE that purchase distressed bank assets and boost the stock and bond markets?

4. Janet Yellen is the new leader of the Fed and new leaders are almost always confronted with a financial crisis early in their term. What should we expect during the next 18 months?

economic collapse

5. ALL paper money systems have eventually failed due to excessive “printing” of the paper currency. How many years of “printing” $85 Billion per month qualifies as excessive “printing”?

6. Human nature changes very slowly if at all. Politicians have lied to most of the people most of the time during the past several thousand years to serve their own self-interest. Are politicians currently lying about ObamaCare, strength of the economy, employment, the NSA, big banks, the IRS, Syria, and so much more?

7. Why does gasoline currently sell for approximately $3.50 per gallon even though it cost only $0.15 per gallon about 50 years ago? Why does a cup of restaurant coffee no longer sell for $0.10? Why do $20 gold coins containing nearly an ounce of gold now sell for over $1,250?

8. The S&P 500 Index is trading near an all-time high and is by most measures and sentiment severely over-bought on a weekly and monthly basis. Is it ready to correct downward?

9. Why is the official unemployment rate falling even though fewer Americans are working and the labor participation rate is at 30 year lows?

10. The Federal Reserve has been levitating the stock market and bailing out banks. Is it possible the Fed policies will backfire and those policies will eventually accomplish the opposite of what the Fed wants?

11. If the national debt of $17 Trillion can never be repaid, and if the U.S. government must borrow to pay the interest every year, and if the Federal Reserve must “print” those dollars, what is the real value of that debt? Is it $17 Trillion or perhaps a great deal less? The economist Hyman Minsky called this “Ponzi Finance” – the final stage of a debt based economic system when payments on the debt must be made from additional borrowing.

money printing

12. If a soaring gold price encouraged people to question the value of the U.S. dollar, and if the U.S. government had the means to suppress the price of gold, would the U.S. government manipulate the price of gold lower?

13. Germany requested their gold be returned from the NY Federal Reserve vaults about a year ago. It has NOT been returned. What happened to the German gold? Further, how much, if any, of the gold supposedly stored in Fort Knox is physically there and not “leased” or otherwise encumbered?

14. Gold has been money – a store of value, divisible, a medium of exchange, a unit of accounting, and intrinsically valuable – for 5,000 years. Paper money has usually been little more than a politician’s promise of integrity and responsibility. Which do you trust – gold or a politician’s promise?

These questions and their answers suggest that:

Drastic restructuring of the current monetary system seems inevitable, whether or not it is imminent.

Before the system resets it seems likely that governments around the world will scramble to locate and nationalize assets in order to maintain their power for a while longer. Capital controls and financial repression via artificially lowered interest rates are already in place. Pension plans, savings accounts, and IRA and 401(k) plans seem vulnerable to partial confiscation, bail-ins, or mandatory investment in government bonds. Such confiscations and bail-ins have already occurred in other parts of the world and could easily happen in the United States.

toned-morgan-dollar

Gold and silver have protected purchasing power and assets for 5,000 years. In this twilight period of the current debt based monetary system it seems likely gold and silver will increasingly be necessary for protection of purchasing power and assets. Are you prepared?

GE Christenson

aka Deviant Investor

How Gold Could Plunge to $500

coinBy GE Christenson

Yup, that is the story. The following arguments explain why Charles and I think gold will plummet to around $500 per ounce. Also, after my luncheon date with Elvis, I have a large bridge for sale. If you are interested and willing to make a SERIOUS OFFER, see below.

The price of gold has roughly followed (up, up, and away) the growth of the U.S. national debt since 1971. The national debt is rising like 8% per year or like $1,000,000,000,000 per year. But don’t jump to the conclusion that gold prices will continue rising along with the debt! Charles Ponzi and I have faith in congress, lobbyists, and the sincerity of the budget process. We believe the national debt will rapidly fall due to the positive economic stimulus from ObamaCare, from actual budget cuts, and therefore gold should drop to new lows. Mr. Ponzi thinks it could go real low – like $450 or $500.

courtesy: www.michaelianblack.net

courtesy: www.michaelianblack.net

The other day an out-of-work economist friend and I had lunch. He is a bright guy and he used to work for one of them central banks, or maybe a rating agency, or the IMF. Anyway, the subject of economic forecasting came up, he got this “far-away” look in his eyes, and he started babbling. Perspiration formed on his forehead, and his left eye started twitching. The mood was weird, like really, really strange. I ordered a fourth martini for each of us and gently suggested, “Show me how it is done.” He pulled out a handful of bones from his coat pocket and tossed them onto the table. He babbled something about magic Emu bones from the 19th century. Then his eyes bugged open wide and he started panting. He studied the bones for at least a minute and then pronounced, with a slur in his raspy voice, gold will drop to $496 by the end of 2014. Now folks, that was the most compelling forecast I have ever heard. Gold is going much lower, say to $496, fairly soon. Believe it!

It has been widely reported that nearly 50,000,000 people in the U.S. are receiving food stamps or, as it is now called, the SNAP program. I figure those people need the program to help buy food, and that means their job market is still weak. No jobs, no excess cash. No excess cash, no gold purchases by food stamp recipients. No gold purchases, and the price drops. Simple! This is one more reason why the price of gold will drop much lower – back down to the $450 – $550 range.

I read that the recent agreement with Iran was a breakthrough in middle-east politics – sort of a win-win for all parties involved, except for maybe the native tribes of northern Canada. I checked my perception with a bartender friend who works in D.C. where congressional staffers get drunk and hustle lobbyist funding. Based on what he overheard from staffers, he agreed. But I needed confirmation, so I called the White House and read several editorials in liberal newspapers and they all confirmed the triumphant break-through. Stay with me here! If the mid-east problems are solved and the political premium on the price of crude disappears, then gasoline will be a lot less expensive, people will have more confidence in the economy, and, like totally obviously, they will sell gold and buy lots more stuff. I figured I had another big winner – sell gold, sell oil company stocks, and buy consumer stocks. This new mid-east agreement is another big reason why I think gold will drop below $550 per ounce in the upcoming year.

pm high-relief-gold

Congressional approval ratings are so bad that I bet I can find more people who have had lunch with Elvis than who think congress is doing a bang-up good job. I figure it is high time for Elvis to make a comeback national tour and for congress to better manage the economy and the dollar. Hence, gold should drop to new lows. Look for $450 – $500 and a new Elvis love song.

Everybody knows the Chinese have been buying all the gold they can grab for the past several years. Even with all their buying, the price of gold has dropped a bunch. Now this is simple – if the price dropped when the Chinese were aggressively buying, how much further will it drop when they slow their buying or totally stop buying gold? Why do I think the Chinese will stop buying gold? Simple – they have bought so much in the past five years, they gotta stop soon – the world might even run out of gold. I figure 2014 is the year they give up on gold purchases and that will cause the price of gold to plummet, maybe even below $400.

I also saw an article in a newspaper called the “D.C. Rag” about a new gold rush. The story ranted on about this scandal of insider democrats buying land in California. They didn’t want the land but they wanted the massive deposit of gold that had been recently discovered there in a shallow mine. The “Rag” mentioned that the only problem was the area was overrun by the native Sasquatches, but I’m confident those congressmen will figure something out and get the gold. More gold mined, more supply, lower prices! This stuff is not difficult. Gold is going down!

ST G

So there you have it! Gold is gonna drop hard in 2014. Why? Simple! The national debt will go down because Charles Ponzi believes ObamaCare is a good plan and that congress will cut the budget and actually produce a surplus, a weak job market is limiting gold purchases by the people on food stamps, an economist predicted that gold will drop to $496 in 2014, we expect peace in the mid-east, the Chinese will reduce their purchases of gold in 2014, and a new supply of gold has been discovered in the Sasquatch zone of California. I figure it is “an open and shut case.” Gold prices are going through the floor, and I just proved it, with help from Elvis, Charles Ponzi, my economist and bartender friends, and simple logic.

Now, about that bridge I have for sale, I can give you a 30% discount if you act today. Serious offers only! Send your information requests to:

GE Christenson
aka Deviant Investor

U.S. Marches Down the Road to Financial Perdition – No One Cares Until It Matters

american-gold-eagleBy: GE Christenson

The reality is relatively simple even though the appearance is complicated and confusing. What are we talking about?

  • Wars that are hugely profitable for a few individuals and businesses
  • Unauditable Pentagon accounting
  • Government debt that will never be repaid
  • Levitation of S&P and bond markets
  • Gold price suppression
  • So much more

We all know “something is wrong” but we keep riding the same corrupt “gravy train” because it works for many powerful people. Consider the interlocking complicity involved in the following:

Iraq and Other Wars

The previous administration produced “evidence” that Iraq had weapons of mass destruction and then claimed it was necessary to invade Iraq, distribute oil contracts to American and British oil companies, initiate “no-bid” contracts to politically connected American military contractors, massively increase government debt, and create huge profits for selected companies and industries. Those profits flowed back to the financial elite, agreeable congressmen, others in government, and to many American workers.

Even though it is now generally agreed that Iraq had no weapons of mass destruction and no means of launching those non-existent weapons against the United States, a great many connected people and businesses benefited financially from the Iraq War. Interlocking complicity worked well to promote the war and to profit from it.

Pentagon Accounting

About 12 years ago, Secretary of Defense, Donald Rumsfeld revealed that $2.3 Trillion was “missing” from the Pentagon books. (“War Racket Update” by acting-man.com – site down temporarily)

“A number of knowledgeable observers admitted that the Pentagon’s ‘books are cooked’ and that in essence, a giant cover-up was going on. A mixture of waste and theft on a truly breathtaking scale was and still is underway.”

It has been my experience that bad or fraudulent accounting is enabled, encouraged, or actively created by management. We can safely assume that the many highly intelligent people who work at the Pentagon could more accurately and transparently manage their operations if they wanted to do so. Hence, fraud and theft exist because management wants it – many people benefit while accountability is neither encouraged nor beneficial to those who are actually in charge. The powers-that-be, congress, the administration, and military contractors are complicit in working the system so that all parties benefit, other people pay the costs, there is minimal accountability, and the necessary payoffs are made. Interlocking complicity works well for those in charge of Pentagon funds and for those receiving the funds.

money printing

Government Debt

Congress has not passed a budget in five years and has been deficit spending for decades. The shortfall between revenues and expenses is borrowed with the understanding that the debts will never be paid – just “rolled over.” The financial and political elite benefit, government pays out massive amounts for military contracts, health care, prescription drugs, retirement programs, Social Security payments, Medicare, unemployment, aid to states, and it goes on and on. That explains how the U.S. government is officially in debt over $17 Trillion and has accrued another $100 – $200 Trillion in liabilities that have been promised but are not currently funded. Since most Americans are benefitting from one or more of these government distributions, most Americans are complicit in this giant borrow, spend and print Ponzi scheme. Because so many people benefit, few individuals or businesses want the process materially changed. Of course many people talk about balancing the budget, cutting spending, and fiscal accountability, but it is only talk. Because Congress has been unable to pass a budget in five years and must borrow a $Trillion or so each year there will be no accountability or budget cutting anytime in the near future. Interlocking complicity rules while we ride the giant government gravy train.

mart1

QE and the Levitation of Stock and Bond Markets

Even a quick glance at the last five years of market prices shows that QE has been a huge benefit to the stock and bond markets and that much of the funny money being “created out of thin air” by the Fed finds its way into those markets. Hence the stock and bond markets have been levitated while “main street” and the bottom 90% (those who have little of their net worth in stocks and bonds) have derived minimal or no benefit from QE. However, most of us realize that the US government cannot limit spending to only the revenue it collects, and that QE greatly benefits the financial and political elite. Interlocking complicity dictates that QE will continue as long as possible, even though “printing money” and debasing the currency have never successfully worked throughout history.

mart2

Central Banks and Gold Price Suppression

Central Banks (Bank of England, Federal Reserve, ECB) have sold or “leased” gold into the market, via bullion banks, to suppress the price of gold and to promote the idea of Pound, Dollar and Euro strength. Since central banking rules allow them to claim that gold is still their asset, even though it is physically gone, this process can work until the central banks are unwilling or unable to sell or “lease” additional gold. The Chinese, Indians, and Russians have purchased the gold directly from bullion banks, or taken delivery on futures contracts, shipped the gold to Switzerland where it has been melted down into kilo bars, and then moved it to the Eastern countries. A huge amount of gold has left the west where it is undervalued and now is vaulted in the East where it is better appreciated.

During the past several years the Chinese have vastly increased their gold holdings at favorable prices while dumping some of their depreciating dollars. The Western central banks further the illusion of value in unbacked debt based paper money while claiming gold is in a bubble, gold and the gold standard are barbarous relics, and enabling paper currencies to survive for a while longer. Interlocking complicity in the gold leasing and gold price suppression scheme currently benefits both the eastern and western countries.

Summary

The Pentagon cannot account for $Trillions. Since there is little incentive to stop the fraud, waste, and phony accounting, and since there is a large incentive for it to continue, expect the graft, corruption, black budget items, and payoffs to continue. Interlocking complicity works especially well at the Pentagon.

The US government does not want to cut spending and has a limited ability to increase revenues. Expect borrow and spend politics to dominate until a “reset” occurs and then expect a crisis and many speeches from important politicians who just noticed what has been obvious for decades. Interlocking complicity works well for congressional payoffs, reelection speeches, increasing power to the administrative branch, and, of course, massive profits to the industries that benefit the most from deficit spending, such as military contractors, banking, health care, pharmaceuticals and others.

Gold price suppression benefits western governments and central banks while the Chinese and Russians benefit by purchasing valuable gold with increasingly devalued dollars. Expect gold price suppression to continue until the west runs out of gold that can be melted down and shipped east. However, demand for physical gold is quite strong while supply is limited. Expect gold to trade MUCH higher in the next few years.

Interlocking complicity produces a degree of stability as it helps maintain the status quo, which is very important to the powers-that-be. Interlocking complicity ensures that accountability, oversight, and ethical practices are low priorities, while payoffs and no-bid contracts will maintain their important role in government operations. Interlocking complicity ensures that little change will occur until it is forced upon us.

Ask yourself

  • Are you prepared for a reset of our financial and social systems?
  • The Chinese are trading increasingly less valuable dollars for increasingly more valuable gold and silver. Should you do likewise?
  • Can a government spend more than it collects in revenue – forever?
  • Debasing the currency has never worked well in the past. Will this time be different for Japan, Europe and the United States?
  • Will Wall Street, Congress, military contractors and the pharmaceutical industry lobby for what is good for you or for them?

GE Christenson
aka Deviant Investor

November Gold Drop of 5.5% Worst in 35 Years as “Unidentified Sellers” Continue to Dump Gold

tenth oz gold-eaglesNovember was a miserable month for gold investors as prices dropped by 5.5% for the Worst November in 35 Years.  Adding to the misery, gold is almost certain to have its first yearly decline after rising 12 years in a row.

NEW YORK—Gold prices logged their worst November since 1978 as a brighter economic landscape fanned fears of reduced stimulus efforts by the Federal Reserve.

Gold prices dropped 5.5% in November. The declines help put gold on track to end 2013 in negative territory, disrupting a 12-year winning streak that saw the precious metal set price records.

“Nothing goes up forever,” said Frank McGhee, a senior precious-metals dealer with Integrated Brokerage Services LLC. in Chicago.

“You’ve got the beginning of an economic pickup without any inflationary signs…[and] you have the specter of the end of easy money, and that’s bearish for gold,” Mr. McGhee said.

A record-breaking rally in U.S. equities also lured many traders away from the precious-metals market. On Friday, the S&P 500 touched a record high of 1813.

Gold’s losses haven’t been limited to the futures market, analysts at Barclays PLC said. Exchange-traded funds backed by physical gold, which take the hassle out of purchasing and storing physical gold for individual investors, have seen their holdings drop 38.4 metric tons through Nov. 26 as sales picked up from the prior month.

Still, November is far from the worst month for the precious metal—gold prices fell 12% this June and nearly 18% in October 2008.

Investors in both gold and silver are looking at losses as precious metal prices decline despite record demand for physical gold and silver.

money printing

Exactly who is causing the price of gold to drop by indiscriminately dumping gold  remains an intriguing mystery that the major news organizations have essentially ignored.   Zero Hedge recently questioned why a rational seller would dump large amounts of gold at odd hours into illiquid markets unless they were deliberately trying to drive the price of gold down.

Shortly after 1amET this morning, someone with no apparent fiduciary duty to their client’s for best execution or any apparent trade allocation expertise decided it was time to dump 1500 contracts into an entirely illiquid gold futures market. The 150,000 ounce notional sell order ($184.5 million), captured graphically by Nanex, sent the price down $10 instaneously, tripped the exchange’s circuit breakers and halted the market’s trading for 20 seconds (once again). This is now the 4th market halt in the past 3 months (and this time on no news whatsoever), as the manipulative monkey-hammerings from who knows whom (BIS?) is becoming increasingly obvious.

Via Nanex,

This sort of thing is happening far too often: see also the drops on April 12, 2013, September 12, 2013, October 11, 2013 and November 20, 2013 which also resulted in trading halts.

Will the mystery of who hates gold ever be solved?

gold-buffalo

As documented many times by the Gold Anti-Trust Action Committee (GATA), the “fat finger” on the gold manipulation button seems to have its origins at the highest levels of government and central banks; this being the case, no one should hold their breath waiting for an honest explanation of the mystery of pricing in the gold market.

U.S. Mint Runs Out of Silver Bullion Coins – Gold and Silver Coin Sales Hit Record Levels in November

rooseveltLong term proponents of sound money cannot seem to get enough of U.S. Mint produced gold and silver bullion coins.  Ever since the financial crash of 2008 many Americans remain profoundly skeptical of the paper dollar system backed by the “full faith and credit” of a nation that has borrowed itself into poverty and promised more in social benefits than the economy can possible provide.

From 2000 to 2007 sales of the U.S. Mint American Eagle gold bullion coins averaged about 341,000 ounces annually.  After the crash of 2008 exposed the risk of paper assets, sales of the gold bullion coins have averaged about 1,011,300 ounces annually from 2008 to 2013.

Year to date sales of the American Eagle gold bullion coins as of the end of November totaled 800,500 ounces, surpassing total 2012 sales of 753,000 ounces.  For November the U.S. Mint sold 48,000 ounces of gold bullion coins, slightly below the sales figures of 48,500 for the previous month.  Since 2000 investors have stashed away 8.8 million gold bullion coins currently worth about $11 billion.

Gold has retained its value throughout human history and strong demand for gold over the ages has resulted in the depletion of most gold deposits on the planet.  As noted in a previous post, about 75% of all gold deposits have already been mined which forebodes a future gold shortage.

american-silver-eagleAs noted in a previous post, sales of the U.S. Mint American Eagle silver bullion coins hit record annual sales volume in  November.  The U.S. Mint sold a total of 41,475,000 silver bullion coins as of November 30th, surpassing the previous record sales year of 39,868,500 coins in 2011.

Sales of the American Eagle silver bullion coins for November came in at 2,300,000, a decline of 787,000 coins compared to 3,087,000 in the previous month.  The lower sales figures for November do not reflect a drop in demand for silver bullion coins but rather the opposite due to the fact that the U.S. Mint has run out of coins due to unprecedented demand.

This same shortage situation existed last year when the Mint ran out of silver bullion coins in mid December  with orders for the new 2013 silver bullion coins not being accepted until January 7, 2013.  This situation resulted in a three week period during which the American Eagle silver bullion coins were simply not available.

The period of time during which silver bullion coins will be unavailable from December 2013 to January 2014 will be even longer than last year.

peace dollar

According to coinupdate.com silver bullion coins will not be available for investor purchase for over a month and supplies will be rationed when available.

The United States Mint recently provided authorized purchasers with information on year end ordering procedures and the availability of 2014-dated releases for the American Eagle and American Buffalo bullion programs. Based on the details provided, it seems that the American Silver Eagle bullion coins will experience roughly one month of unavailability between the final allocation of 2013-dated coins and the release of the first 2014-dated coins.

The situation for American Silver Eagle bullion coins differs from the prior year. Authorized purchasers will be offered the last weekly allocation of 2013-dated coins on Monday, December 9, 2013. With demand continuing to run ahead of the available supplies, the allocation will likely be quickly depleted.

The 2014-dated Silver Eagle bullion coins will not be available to order until Monday, January 13, 2014. The initial release will be subject to the US Mint’s allocation program, which rations supplies amongst the authorized purchasers.

With such a severe shortage of silver bullion coins, expect buyer premiums to increase significantly over the next two months.

Peak Gold – 75% of All Gold Deposits Have Already Been Mined

1933-double-eagle1The basic law of supply and demand dictates the quantity of goods offered for sale.  If prices are low and goods cannot be sold at a reasonable profit, producers will be unmotivated to increase production.  If prices  increase as demand for a product is soaring and producers can reap high returns, supply will increase as producers increase output to maximize profits.

When it comes to gold, however, the textbook equation for supply and demand can be thrown out the window.  Gold exists in finite quantities and has become increasing more difficult and expensive to mine.  In addition, major new gold deposits discoveries have dropped to zero in the past two years and ore grades have declined significantly to only 3 grams per tonne from 12 grams per tonne in 1950.

Even as gold exploded in price from under $300 per ounce in 2002 to $1,800 per ounce in 2011 gold production trended lower.  Despite much higher prices, gold miners were simply unable to increase supply.  According to the World Gold Council mine production over the past five years has not increased and average annual production has remained stable at approximately 2,690 tonnes per year.

On a long term basis gold production will continue to decline even further for the simple reason that most of the earth’s richest deposits of gold have already been mined and new gold deposit discoveries have declined significantly (see New Gold Discoveries Decline by 45%).

At the end of 2012 it is estimated that all the gold ever mined in history totaled approximately 173,000 metric tonnes.  According to the Perth Mint, a study done by Natural Resource Holdings estimates that there are only about 56,674 metric tonnes of recoverable gold reserves left.  If this bleak assessment is correct, over 75% of the world’s total gold reserves have already been mined as shown in the infographic below.

To keep things in perspective, the total global gold supply (including both mined gold and gold reserves) totals 230,000 metric tonnes worth about $9.2 trillion at the current gold price of $1,239.  By comparison, the U.S. deficit has exploded to over $17.2 trillion and the Federal Reserve has printed $4 trillion to drive down interest rates by purchasing mortgage backed securities and treasury debt.

In the bizarro world financial system created by the Federal Reserve and other central banks, the meaning of money has become distorted to the point where it is almost meaningless.  The recent decline in gold prices should be viewed as a long term opportunity to increase positions in a currency that central banks cannot create at will in infinite quantities.