April 25, 2024

Gold and Silver Bearish Sentiment Is At Extreme Levels

By:  John Townsend at The TSI Trader.

The usefulness of sentiment’s stealth crystal ball is about to be revealed to the litany of unsuspecting precious metal bears and skeptics who have convinced themselves that gold’s bull market is either over or, at the minimum, in need of lengthy ongoing retesting, restructuring and consolidation.

This article will bring us up to date as to the degree of current bearish sentiment regarding both gold and silver using no fewer than 5 sentiment indicators (with 9 illustrative charts), as well as provide the reader with an opportunity to observe the price outcome of previous bearish extremes using these sentiment indicators.

But first, let’s briefly consider the concept of investor sentiment.

Sentiment extremes, simply put, tell us that there are too many traders at one end of the boat and therefore the boat is about to tip over. Sentiment can strongly suggest that the trade, as some say, has become “crowded”. When someone finally yells “fire” in the “crowded” room there are so many of the market’s participants motivated to get out the same door and in the same direction that most get trampled – unable to reverse their trade fast enough.

Another way of characterizing a sentiment extreme is to say that the trade simply runs out of buyers or sellers, as the case may be. The extreme price momentum in one direction “exhausts” itself of all available ammunition to continue the trend and is sometimes signaled when someone yells “fire” in the “crowded” room, but often comes to a conclusion unrecognized by most traders as price reverses direction in an unassuming manner.

You may have heard comments when a particular market bottoms and then begins to trade higher and then continues to trade even higher yet, despite “bad” news, the assertion that the bullish price movement seems to make no sense – that it cannot possibly be sustained. At this time it appears to nearly everyone the common sense question to ask is how “bad” news that used to cause a market to go into free fall now seems to have absolutely no negative effect? And to observe that as this market continues higher, it always leaves behind those traders stuck in pessimism to declare that the market is “climbing a wall of worry”. That is, the “bad” news continues in the media, yet this particular market’s price reversal continues upwards.

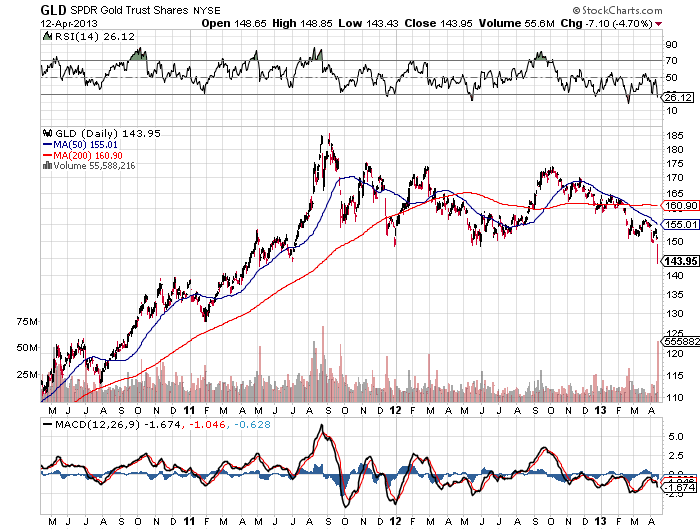
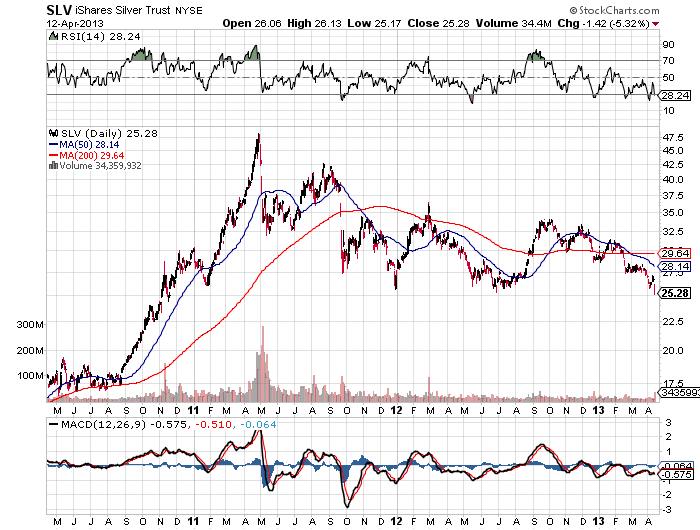
We will begin with the put / call volume ratio of the options trade of the Silver Trust ETF (SLV) and the SPDR Gold Trust (GLD). Charts courtesy of Schaeffer’s Investment Research.

Click on image to enlarge.

The red line in the charts are the ETF’s price movement over the recent 2 years (GLD above, SLV below). The blue line is the put / call volume ratio. This considers the trading day’s volume of puts traded and is divided by the volume of calls traded. Generally, the higher the put / call ratio, the more bearish traders are about the ETF’s likely price movement, while the lower the put / call ratio, the more traders believe the ETF is bullish and going to rally higher.

Click on image to enlarge.

Undoubtedly you have noticed that both charts reveal that the put / call ratio is at the highs of the past two years; meanwhile price is at the lows of the past two years. I will leave it to you to observe the repetitively flip flop relationship between this sentiment indicator and price movement. For me, anyway, this indicator leaves little doubt as to the upcoming direction of GLD and SLV.

Next up is the Hulbert Gold Sentiment Index. This chart courtesy of Mark Hulbert’s Newsletters.

Click on image to enlarge.

This first Hulbert Gold Sentiment Index chart shows us that gold sentiment at present is even more depressed than at gold’s infamous 2008 low.

So there you have it. Sentiment on GLD and SLV options is crazy extreme, Hulbert’s Gold Sentiment Index reveals sentiment is not only more bearish than the 2008 bottom – it’s more bearish than anytime in the past 17 years (at least).

Read complete article here.

Panic Selling Crushes Gold and Silver Prices – Bearish Sentiment Reaches Extreme Levels

goldThe precious metal markets, which have been under a constant drumbeat of negative news and bearish price forecasts for months, sold off sharply today.   Bearish investors seemed to reach the “give up” stage as gold and silver fell below key technical levels.  Panic selling continued to cascade throughout the day as precious metal investors hit the sell button and buyers stepped aside.

By the end of the trading day, gold dropped an astonishing $84 per ounce to close at $1,478, down over 5% on the day and below $1,500 per ounce for the first time since July 5, 2011.   Silver had an even worse day with a price decline of 6.5%, closing down $1.81 per ounce at $25.95.

Analysts had multiple reasons for the huge decline in gold and silver prices including the belief that inflation will remain subdued and the Federal Reserve would begin to slow the pace of monetary stimulus later this year.  In addition, many trend following investors are repositioning out of precious metals into other investment opportunities such as stocks which have appreciated by over 100% since the depths of the financial crisis.  By contrast, gold and silver  have been unable to breach highs reached in mid 2011.

Also weighing on investor’s mind was the fear that the proposed sale of over $500 million of Cyprus gold reserves would further pressure gold prices.  Comments in the Wall Street Journal suggested that other countries may also be forced to sell their gold reserves.

The news about Cyprus “gets people to wonder: Will there be central-bank liquidation of gold when other countries get into trouble?” said Adam Klopfenstein, senior market strategist with Archer Financial Services in Chicago. “Selling gold might be the new caveat for any future [bailout] deals.”

The match that ignited the explosive move to the downside was struck on Wednesday when Bloomberg reported that Goldman Sachs predicted sharply lower gold prices and suggested that investors actually short the gold market.

The turn in the gold price cycle is accelerating after a 12-year rally as the recovery in the U.S. economy gains momentum, according to Goldman Sachs Group Inc., which reduced forecasts for the metal through 2014.

The bank cut its three-month target to $1,530 an ounce from $1,615 and lowered the six- and 12-month predictions to $1,490 and $1,390 from $1,600 and $1,550. Goldman recommended closing a long Comex gold position initiated on Oct. 11, 2010 for a potential gain of $219 an ounce, analysts Damien Courvalin and Jeffrey Currie wrote in a report today.

“Despite resurgence in euro-area risk aversion and disappointing U.S. economic data, gold prices are unchanged over the past month, highlighting how conviction in holding gold is quickly waning,” the Goldman analysts wrote in the report. “While higher inflation may be the catalyst for the next gold cycle, this is likely several years away.”

Goldman cut its 2013 gold estimate to $1,545 an ounce from $1,610, trimmed its 2014 forecast to $1,350 from $1,490, and set year-end targets of $1,450 in 2013 and $1,270 in 2014. Goldman recommended starting a short Comex gold position, targeting $1,450 with a stop at $1,650, the analysts wrote.

Ironically, the biggest worry for gold and silver investors now comes from the precious metal ETFs, which greatly contributed to the precious metals bull market as investors poured billions of dollars in the SPDR Gold Shares (GLD) and the iShares Silver Trust (SLV).  If investors in the GLD and SLV initiate panic liquidations, a sharp rebound in gold prices may be wishful thinking despite today’s huge sell off.  According to Goldman Sachs,  “The fall in prices could end up being faster and larger than our forecast, as aggregate speculative net long positions across Comex futures and gold ETFs remain near record highs.”

COURTESY: STOCKCHARTS.COM

COURTESY: STOCKCHARTS.COM

COURTESY: STOCKCHARTS.COM

COURTESY: STOCKCHARTS.COM

The bearish sentiment and price action on gold and silver seemed to have reached extreme levels.  Does anyone hear a contrarian bell ringing?

Silver ETF Holdings Increase Slightly In January As The Stealth Silver Advance Continues

Silver has started off the new year with a scorching performance

For the month of January, silver gained $5.42 per ounce closing at $33.60, up 19.2% from the 2011 closing price of $28.18.  January’s gain has more than erased the 8.1% loss on silver during 2011.  Silver has far outperformed gold which closed at $1,738.00 on January 31st, up 10.4% on the month from the 2011 closing price of $1574.50 (all prices from the closing London PM Fix Price).

The large gain in silver’s price has been somewhat of a stealth advance, with little coverage in the press.  In addition, an apathetic response to silver by investors can be seen in the volume statistics and bullion holdings of the iShares Silver Trust (SLV).

Silver holdings of the iShares Silver Trust reached a record 11,390.06 tonnes on April 25, 2011, shortly before silver reached its peak price of $48.70 on April 28th.  The value of silver held by the SLV on April 28th was $17.3 billion compared to its current value of $10.4 billion, representing a decline in both the price of silver and total ounces of silver held by the Silver Trust.

Although silver prices have soared since the beginning of the year, holdings of the SLV have increased only modestly.  At the end of 2011, the SLV held 9,605.79 tonnes of silver compared to 9,608.95 on January 31, 2012, a negligible increase of only 3.16 tonnes.  The small increase in silver held by the iShares Silver Trust indicates that investors are not participating in the silver rally, a very bullish sign from a contrarian point of view.

The silver ETF is structured in a somewhat complicated manner in which authorized participants (AP) buy or sell shares of the SLV depending on the discount or premium of the SLV to the market price of silver.  High buying demand for the SLV results in premium pricing which results in the accumulation of physical silver by the trust due to hedging activity by the APs.

SLV - courtesy yahoo.com

Investor indifference to the silver rally can also be seen in the low volume trading of the iShares Silver Trust.  We are nowhere close to the high volume seen last May that preceded the rapid correction in silver prices.  The low trading volume in the SLV, despite rising prices, is bullish from a contrary viewpoint since it suggests that many investors are still on the sidelines.  As these sideline investors start buying, prices will continue to advance.

Also supporting future price advances by silver is the relentless physical demand for silver as seen in the record purchase volume of the American Silver Eagle bullion coins.  Sales of the silver bullion coin hit at all time record of almost 35 million coins during 2011. Large demand continues in January with the U.S. Mint reporting sales of over 6 million ounces.  2012 could turn out to be a sterling year for silver.

Gold And Silver ETF Holdings Remain Steady As Gold Plunges

Gold’s non stop advance since early July saw a rapid reversal on Wednesday as gold lost $104.20 to close at $1,752.30 in New York trading.

Gold prices have soared this year on fears of another financial crisis and the continual debasement of paper currencies by governments that are tottering on the brink of default.  Gold began the year at $1,388.50 and by early May traded over $1,550.  After consolidating for two months, gold broke out of its trading range in early July and breached the $1,900 level earlier this week.  Despite today’s sharp sell off, gold is still up $363.80 or 26% for 2011.

As short term trend traders, hedge funds and speculative buyers jumped into gold, prices became overbought with gold trading $423 above its 200 day moving average.  The same traders playing gold for short term profits jumped out just as quickly when prices started to reverse.  Two factors that encouraged profit taking in gold were reports that the Fed would not immediately announce another round of money printing and the sharp hike in margin requirements on gold futures by the CME Group.

On a short term basis gold was overbought and due for a correction after an almost vertical rise from $1,500 as can be seen below.


Gold - courtesy stockcharts.com

A view of a longer term chart gives a different perspective – the long term bull market in gold remains intact and the fundamental reasons for owning gold have not changed.


Gold - courtesy stockcharts.com

The non stop “gold bubble” chatter by talking heads who missed participating in the decades long gold rally are focusing on a short term price movement instead of the fundamentals that will continue to drive gold prices higher.  Every bull market has corrections and are an opportunity to add to positions.  As a long term investor in gold since the early 1990’s, I have seen other investors trade in and out, losing money each time, instead of simply going with the long term bull trend.

Many analysts have expressed concern that investors might be panicked out of the GLD causing the price of gold to plunge.  This does not seem to be the case despite the large drop in gold prices this week.  As of Wednesday, the GLD gold holdings declined by only 39.67 tonnes.  In addition, when silver spiked in early May, trading volume in the SLV exploded by 750% above the daily average trading volume.  Despite the volatility in gold this week, trading volume in the GLD expanded by only 350% above average trading volumes.  This would seem to indicate that investment in the GLD is a core holding by long term gold investors who are not inclined to sell on normal price corrections.

The SPDR Gold Trust currently holds 39.6 million ounces of gold valued at $70.1 billion.  There has been much hype about the value of the GLD exceeding that of the SPDR S&P 500.  A more proper context for comparison is to compare the value of the GLD to the increase in sovereign debt and money printing.  Bernanke’s latest episode of QE2 money printing was 850% larger than the entire value of the GLD and you can count on additional Fed currency debasement in the future.

GLD and SLV Holdings (metric tonnes)

August 24-2011 Weekly Change YTD Change
GLD 1,232.31 -39.67 -48.41
SLV 9,836.18 +109.08 -1,085.39

The iShares Silver Trust holdings gained 109.08 tonnes for the week ending August 24, despite the slide in silver prices.  The SLV has been building a base in the $35 to $40 range since the May correction.   Many analysts proclaimed that the “bubble” in silver prices had burst after the sharp price correction in May.  From a long term perspective, the May correction did little to diminish either the bullish fundamentals or the long term upward trend in silver prices.


SLV - COURTESY YAHOO FINANCE

The SLV currently holds 316.2 million ounces of silver valued at $13.3 billion.

Gold Prices Skyrocket, Stocks Plunge – Looking Like 2008 On Steroids

As politicians celebrated the debt limit increase and congratulated themselves for “saving” the nation that they destroyed, collapsing stock markets and soaring gold prices told a different story.  The public spectacle of a dysfunctional Congress debating the debt limit exposed to the world the horrendous extent to which the US government is addicted to endless deficit spending.

Republican presidential candidate Ron Paul summed up the outcome of the debt limit fiasco best:

This deal will reportedly cut spending by only slightly over $900 billion over 10 years. But we will have a $1.6 trillion deficit after this year alone, meaning those meager cuts will do nothing to solve our unsustainable spending problem. In fact, this bill will never balance the budget. Instead, it will add untold trillions of dollars to our deficit. This also assumes the cuts are real cuts and not the same old Washington smoke and mirrors game of spending less than originally projected so you can claim the difference as a ‘cut.’

The plan also calls for the formation of a deficit commission, which will accomplish nothing outside of providing Congress and the White House with another way to abdicate responsibility. In my many years of public service, there have been commissions on everything from Social Security to energy policy, yet not one solution has been produced out of these commissions.

Ron Paul also provided an explanation of what constitutes a “spending cut” in the bizarro world of government accounting and why, in the end, spending and debts will not decrease.

No plan under serious consideration cuts spending in the way you and I think about it. Instead, the “cuts” being discussed are illusory, and are not cuts from current amounts being spent, but cuts in projected spending increases. This is akin to a family “saving” $100,000 in expenses by deciding not to buy a Lamborghini, and instead getting a fully loaded Mercedes, when really their budget dictates that they need to stick with their perfectly serviceable Honda. But this is the type of math Washington uses to mask the incriminating truth about their unrepentant plundering of the American people.

The world was finally tuning in to the reality of the desperate financial condition of the United States.  The mainstream press was predicting a plunge in gold prices and soaring stock prices after Congress agreed to increase the nation’s debt limit.  Instead, the opposite happened as markets reflected underlying economic reality.

Since mid July, the Dow Jones Industrial Average has plunged by 858 points.  Since July 1st, gold has gained $178 per ounce.  Meanwhile, the debt crisis in Europe continues to intensify with bond yields soaring in Italy and Spain.  The world economy is marching off the edge of a cliff as governments lose the ability to contain the spiraling debt crisis.  It’s starting to look like a replay of 2008 on steroids.

Gold  soared by $39.80 on the day to close in New York trading at an all time high of $1,661.10.  Silver more than paced the gain in gold, adding $1.61 to close up 4.1% at $40.95.

SPDR Gold Trust Holdings Increase, Silver ETF Holdings Decline

Holdings of the SPDR Gold Shares Trust (GLD) gained almost 37 tonnes on the week.  For the first time this year, holdings of the GLD are greater than they were at the beginning of the year.  The record holdings of the GLD occurred on June 29, 2010 when the GLD held 1,320.47 tonnes of gold.

The SPDR Gold Trust currently hold 41.2 million ounces of gold valued at $67.5 billion.  Shares of the GLD hit an all time high, closing at $161.52.


GLD - COURTESY YAHOO FINANCE

Holdings of the iShares Silver Trust (SLV) declined by 90.93 tonnes after an increase of 112.15 tonnes in the prior week.  Since the beginning of July, holdings of the SLV have increased by 288.28 tonnes.

The SLV currently holds 315.9 million ounces of silver valued at $12.5 billion.

GLD and SLV Holdings (metric tonnes)

August 2-2011 Weekly Change YTD Change
GLD 1,281.75 +36.95 +1.04
SLV 9,824.93 -90.93 -1,096.64


Gold and Silver ETF Holdings Decline On Week While Europe’s Debt Crisis Expands

The iShares Silver Trust (SLV) showed a decline in holdings of 48.21 tonnes from the previous week, after rising by 21.23 tonnes in the previous week.   The net outflow of the SLV since the start of the year now totals 1,389.17 tonnes.

Silver opened the year at $30.67 per ounce and closed at $35.38 on July 6th. Despite the fact that silver has gained 15.4% since the start of the year, SLV holdings have declined by 12.7%.  Although increases or decreases in iShares silver holdings can be a guide to silver demand, physical holdings of the SLV do not correlate exactly with the price movements on the underlying metal.  This is due to the complex structure of the SLV which allows authorized participants to create or redeem shares in the SLV (see How Wall Street Made Profits On Silver ETF As Small Investors Sold).

There was, however, a close correlation between holdings of the SLV and the price of silver in late April.  As silver prices surged to a high of $48.70 on April 28th, holdings of the iShares Silver Trust hit an all time high of 11,390.06 tonnes on April 25th.

The iShares Silver Trust currently holds 306.5 million ounces of silver valued at $10.84 billion.  The all time high value of silver holdings by the SLV was reached on April 28th when the Trust held silver valued at $17.3 billion.

The SLV moved up on the week and is basing in the mid 30’s range.


SLV - COURTESY YAHOO FINANCE

Holdings of the SPDR Gold Shares Trust (GLD) declined slightly on the week by 2.42 tonnes after a small decline in the previous week of .91 tonnes.  The decline in GLD gold holdings since the beginning of the year totals 74.91 tonnes. The price of gold has increased 10% from $1388.50 at the beginning of the year to yesterday’s closing price of $1527.25.

The GLD currently holds 38.8 million ounces of gold valued at $59.2 billion.

Gold moved up $32.25 this week after dipping below $1,500 last week.  As measured by the closing London PM Fix Price, gold closed on Wednesday at $1527.25.  Gold has refused to give up its gains this year as distrust of paper money continues to justifiably expand.  The inevitable default by multiple member states of the European Union will require massive monetary support for insolvent banks holding trillions of dollars of sovereign junk debt.   The European Central Bank is desperately trying to maintain the facade of a successful debt restructuring by issuing more loans to insolvent nations.

Bloomberg this week discusses the looming debt crisis in Italy which has over 2 trillion in Euro denominated debt.

Italy, though, has close to 2 trillion euros in debt outstanding. It’s inconceivable that Germany or the IMF could provide a rescue to protect its creditors. Such a package would have to involve loans and guarantees of at least 500 billion, and possibly 1 trillion, euros to impress the markets. This would be a significant fraction of Germany’s gross domestic product of about 2.5 trillion euros. With a debt-to-GDP ratio of about 80 percent, Germany’s ability to take on new debt is limited.

The Netherlands, Finland and Austria, combined with Germany, have a GDP of about 3.5 trillion euros. France adds 2 trillion more, but its debt, already 85 percent of output, is expected to grow over the next several years.

It all adds up to one sobering fact: Europe does not have enough fiscal firepower to handle an Italian crisis — at least in such a way as to protect creditors completely. Beyond the difficult numbers, why would Germany or other EU countries lend to Italy, particularly when its politicians show no sign of coming to grips with their new reality?

The slow motion collapse of overly indebted countries in Europe is picking up speed.  Rising gold prices reflect the coming financial crisis which equity and debt markets have not yet fully discounted.  Expect to see gold prices soar as the debt crisis moves into high gear.


GOLD - COURTESY KITCO.COM

GLD and SLV Holdings (metric tonnes)

July 6-2011 Weekly Change YTD Change
GLD 1,205.81 -2.42 -74.91
SLV 9,532.40 -48.21 -1,389.17


Silver ETF Holdings Decline Again As Gold ETF Holdings Gain

Holdings of the iShares Silver Trust (SLV) declined again this week by 106.14 tonnes after a decline of 248.69 tonnes in the previous week.  The year to date decline in silver holdings by the SLV now totals 1,362.19 tons.

The decline in holdings of the SLV from its all time high of 11,390.06 tonnes on April 25, 2011 now totals 1,830.68 tonnes, or a decline of 16.1%.  There is not a direct and timely correlation between the price of silver and the holdings of the SLV as evidenced by the fact that silver has declined in price by a much larger percentage than holdings in the iShares Silver Trust.  From its high of $48.70 on April 28th, silver has had a price correction of 35.6%.

The holdings of silver by the SLV are structured in a complex manner.  The trust is set up so that the SLV price correlates closely to the price of silver.  This is accomplished by allowing Authorized Participants to arbitrage against a premium or discount of the SLV to the trust’s underlying net asset value  (see How Wall Street Made Huge Profits On Silver ETF Crash As Small Investors Sold).

As measured by the closing London PM Fix Price, silver closed today at $35.91, up slightly from last Wednesday’s close of $35.26.  Silver has been consolidating in the mid 30 range after the early May sell off.

As of June 22, 2011, the SLV held 307.3 million ounces of silver valued at $11.0 billion.


SILVER - COURTESY KITCO.COM

Silver seems to be building a base in the mid $30’s and presents a buying opportunity for long term investors.

GLD and SLV Holdings (metric tonnes)

June 22-2011 Weekly Change YTD Change
GLD 1,209.14 +9.09 -71.58
SLV 9,559.38 -106.14 -1,362.19

Holdings of the SPDR Gold Shares Trust (GLD) gained by 9.09 tonnes on the week after a decline of 11.52 tonnes in the previous week.   The GLD currently holds 38.88 million ounces of gold valued at $60.3 billion.

As measured by the closing London PM Fix Price, gold closed on Wednesday at $1,552.50, a new closing high on the year.  The price of gold remains in a solid uptrend supported by huge physical demand from investors and central banks.


GOLD - COURTESY KITCO.COM


Silver and Gold ETF Holdings Both Decline On Week

Holdings of the iShares Silver Trust (SLV) declined by 248.69 tonnes for the week after declining by 27.12 tonnes in the previous week.  The year to date decline of silver held by the SLV is 1,256.05 tonnes.

The holdings of the SLV hit an all time high on April 25, 2011 at 11,390.06 tonnes and the decline from this high now totals  a substantial 1,724.54 tonnes.  Total holdings of the SLV have declined by 15.1% from the high of April 25, while the price of silver has declined by 27.6%  from its high of $48.70 reached on April 28th.

Silver closed today at $35.26 (as measured by the closing London PM Fix price), up $8.58 from the low of the year at $26.68 reached on January 28th.  Shares of the SLV closed today at $34.88, down $13.47 from the high of the year at $48.35.


SLV - COURTESY YAHOO FINANCE

The iShares Silver Trust currently holds 310.8 million ounces of silver valued at $10.95 billion.  At the start of 2011, the SLV held 351.1 million ounces of silver valued at $10.9 billion.  The holdings of the iShares Silver Trust does not directly track the price movement in silver due to the manner in which it is structured.  For a discussion of how SLV shares are created or redeemed by Authorized Participants, see How Wall Street Made Profits On Silver ETF Crash.

According to the iShares website, the SLV closed yesterday at a premium of 2.54% to the fund’s net asset value.  On rare occasions when silver is exhibiting large price swings, the premium or discount to net asset value has been as large as 6%.

GLD and SLV Holdings (metric tonnes)

June 15-2011 Weekly Change YTD Change
GLD 1,200.05 -11.52 -80.67
SLV 9,665.52 -248.69 -1,256.05

Holdings of the SPDR Gold Shares Trust (GLD) declined on the week by 11.52 tonnes, after declining in the previous week by 1.30 tonnes.  The GLD currently holds 38.58 million ounces of gold valued at $59.0 billion.  The all time record holdings of the GLD was 1,320.47 tonnes on June 29, 2010.

Gold traded in a narrow range over the past week, declining by $8 per ounce.  Gold has stayed above the $1,500 level since May 20th and has gained $141.25 since the beginning of the year.

Shares of the SPDR Gold Trust closed at $149.12, up $0.45, not far off the year’s high of $153.61.


GLD - COURTESY YAHOO FINANCE

Gold and Silver ETF Holdings Decline On Week

Silver holdings of the iShares Silver Trust (SLV) declined for the week by 27.12 tonnes after being unchanged in the previous week.  The price of silver, as measured by the closing London PM Fix Price has declined by $1.73 or 4.6% since June 1st.

After reaching a high of $48.70 per ounce on April 28th, silver has declined by $12.48 or 25.6% based on today’s closing price.  From the low of $32.50 on May 12, silver has seen a price recovery of $3.72.

The iShares Silver Trust has seen a substantial reduction in silver holdings of 1,007.36 tonnes since the beginning of the year when silver traded at $30.67.  The decline in holdings by the SLV from late April have been even more dramatic.   The SLV hit an all time high for silver holdings on April 25, 2011 of 11,390.06 tonnes.  The decline in SLV holdings from the all time high registers at 1,448.73 tonnes or 46.6 million ounces of silver valued at $1.7 billion.

The iShares Silver Trust currently holds 318.7 million ounces of silver valued at $11.5 billion.  On April 27th, the value of silver held by the SLV was $16.1 billion.

At today’s closing price of $36.03, shares of the SLV traded at a premium of $0.71 or 2.0% to the net asset value of the Trust.  Since the beginning of the year, the SLV has gained 20.2% and over the past year has increased by 115.4%.  For a discussion on why silver prices may see a quick recovery to all time highs see – How Soon Will Silver Hit New Highs?

GLD and SLV Holdings (metric tonnes)

June 8-2011 Weekly Change YTD Change
GLD 1,211.57 -1.30 -69.15
SLV 9,914.21 -27.12 -1,007.36

Holdings of the SPDR Gold Shares Trust (GLD) were little changed on the week, declining by 1.3 tonnes, after a decline of 1.21 tonnes in the previous week.  The GLD currently holds 38.95 million ounces of gold valued at $59.9 billion.  Holdings of the GLD hit at all time record high of 1,320.47 tonnes on June 29, 2010.

Gold prices gained slightly on the week, closing up $4.00 per ounce from the June 1 close.  Gold has now gained $149.25 since the beginning of the year, up 10.75%.  Gold has remained in a narrow trading range for several months, consolidating its early year gains.  Gold has remained above the $1,500 level since May 20th when it closed at $1490.75 per ounce.

Silver and Gold ETF Holdings Decline Amidst Volatile Trading

In a week of volatile precious metals trading, holdings of both the iShares Silver Trust (SLV) and the SPDR Gold Shares Trust (GLD) saw modest declines.

The holdings of the SLV declined by 130.49 tonnes or 1.2% from last week to 11,053.20 tonnes.  Looking at the daily changes, however, provides a a better indication of the volatility in SLV holdings during the week.

The holdings of the SLV hit an all time record high amount of 11,390.06 tonnes on Monday April 25th.  The substantial decline of 336.86 tonnes over the following two days mirrors the volatile price action of the SLV, which declined more than $2 on Tuesday before recovering to all time  highs at Wednesday’s closing price.

SLV - COURTESY YAHOO FINANCE

The SLV currently holds 355.4 million ounces of silver valued at $16.1 billion.  The SLV is currently the largest silver ETF and has seen tremendous growth in holdings since the Trust’s inception in April 2006, when it held a mere 653.17 tonnes valued at $263.5 million.  According to the Silver Institute, at the end of the first quarter 2011, total holdings held by all silver ETFs was 612 million ounces.

Despite the tremendous appreciation of the SLV, the silver market remains a relatively small market which leads to speculation that silver prices are being manipulated.  Volatility in silver trading over the past week was enhanced by rumors of massive short positions by traders, attempts to corner the market by larger players, and the inability to deliver physical silver on futures contracts.

The recent volatility in silver is likely to continue as additional players are drawn into one of the hottest markets of 2011 and wide price swings may become the norm over the short term.

For long term  investors, the fundamentals of the silver market should overweight any short term volatility.  Sales of Silver Eagles by the US Mint in the first quarter of 2011 was 37% higher than the previous year reflecting continuing investor demand.

GLD and SLV Holdings (metric tonnes)

April27-2011 Weekly Change YTD Change
GLD 1,229.64 -0.61 -51.08
SLV 11,053.20 -130.49 +131.63

Gold holdings in the GLD declined modestly by 0.61 tonnes after an increase of 17.29 tonnes for the previous week.  The current holdings of the GLD amount to 39.5 million ounces of gold valued at $59.7 billion.

Gold hit another all time high today, recently trading at $1,531.  The Federal Reserve ignited a sharp rally in gold and silver after releasing details of this week’s FOMC meeting. The precious metal markets moved higher after the Federal Reserve said it would continue super aggressive monetary policies despite the June wind down of QE2.  The Fed indicated that it would not reduce the size of its balance sheet and would leave short term interest rates at zero.

The Fed also left the door open to future unconventional policy moves if deemed necessary.  Since the Fed cannot move rates below zero, any additional “unconventional easing” would almost certainly mean additional money printing by the Fed.   The US dollar traded lower on Fed comments and is now threatening to break to new all time lows.