April 25, 2024

Gold and Silver Bearish Sentiment Is At Extreme Levels

By:  John Townsend at The TSI Trader.

The usefulness of sentiment’s stealth crystal ball is about to be revealed to the litany of unsuspecting precious metal bears and skeptics who have convinced themselves that gold’s bull market is either over or, at the minimum, in need of lengthy ongoing retesting, restructuring and consolidation.

This article will bring us up to date as to the degree of current bearish sentiment regarding both gold and silver using no fewer than 5 sentiment indicators (with 9 illustrative charts), as well as provide the reader with an opportunity to observe the price outcome of previous bearish extremes using these sentiment indicators.

But first, let’s briefly consider the concept of investor sentiment.

Sentiment extremes, simply put, tell us that there are too many traders at one end of the boat and therefore the boat is about to tip over. Sentiment can strongly suggest that the trade, as some say, has become “crowded”. When someone finally yells “fire” in the “crowded” room there are so many of the market’s participants motivated to get out the same door and in the same direction that most get trampled – unable to reverse their trade fast enough.

Another way of characterizing a sentiment extreme is to say that the trade simply runs out of buyers or sellers, as the case may be. The extreme price momentum in one direction “exhausts” itself of all available ammunition to continue the trend and is sometimes signaled when someone yells “fire” in the “crowded” room, but often comes to a conclusion unrecognized by most traders as price reverses direction in an unassuming manner.

You may have heard comments when a particular market bottoms and then begins to trade higher and then continues to trade even higher yet, despite “bad” news, the assertion that the bullish price movement seems to make no sense – that it cannot possibly be sustained. At this time it appears to nearly everyone the common sense question to ask is how “bad” news that used to cause a market to go into free fall now seems to have absolutely no negative effect? And to observe that as this market continues higher, it always leaves behind those traders stuck in pessimism to declare that the market is “climbing a wall of worry”. That is, the “bad” news continues in the media, yet this particular market’s price reversal continues upwards.

We will begin with the put / call volume ratio of the options trade of the Silver Trust ETF (SLV) and the SPDR Gold Trust (GLD). Charts courtesy of Schaeffer’s Investment Research.

Click on image to enlarge.

The red line in the charts are the ETF’s price movement over the recent 2 years (GLD above, SLV below). The blue line is the put / call volume ratio. This considers the trading day’s volume of puts traded and is divided by the volume of calls traded. Generally, the higher the put / call ratio, the more bearish traders are about the ETF’s likely price movement, while the lower the put / call ratio, the more traders believe the ETF is bullish and going to rally higher.

Click on image to enlarge.

Undoubtedly you have noticed that both charts reveal that the put / call ratio is at the highs of the past two years; meanwhile price is at the lows of the past two years. I will leave it to you to observe the repetitively flip flop relationship between this sentiment indicator and price movement. For me, anyway, this indicator leaves little doubt as to the upcoming direction of GLD and SLV.

Next up is the Hulbert Gold Sentiment Index. This chart courtesy of Mark Hulbert’s Newsletters.

Click on image to enlarge.

This first Hulbert Gold Sentiment Index chart shows us that gold sentiment at present is even more depressed than at gold’s infamous 2008 low.

So there you have it. Sentiment on GLD and SLV options is crazy extreme, Hulbert’s Gold Sentiment Index reveals sentiment is not only more bearish than the 2008 bottom – it’s more bearish than anytime in the past 17 years (at least).

Read complete article here.
Have Gold Investors Become Too Bullish? Ask The Same Question At $5,000

Have too many investors gotten overly bullish on gold?

After a stunning advance of almost $200 per ounce from last year’s closing price, some are asking if gold has gotten ahead of itself.  After advancing almost nonstop since the beginning of the year, gold sold off sharply, dropping by $32.50 to close in New York trading at $1725.90.

Analyst Mark Hulbert, who tracks investor sentiment as reported in the Hulbert Gold Newsletter, reports that bullish sentiment on gold has become extreme.  At the end of 2011, short term gold timers were completely out of the gold market.  The Hulbert Gold Newsletter Sentiment Index (HGNSI) registered 0.3% on December 29th compared to 51% today.  Mr. Hulbert sees the rapid return to bullishness by gold investors as a worrisome signal and notes that the HGNSI never got as high as it is today when gold previously traded at current price levels.

Mr. Hulbert notes that his indicator can be early as was the case last year.  In early December Hulbert noted that bearish sentiment was reaching extreme levels but gold subsequently plunged from $1,752 on December 1st to $1,574.50 on December 30th.

One indicator of gold sentiment that does not seem to be signaling an imminent sharp correction in gold is the CBOE Gold ETF Volatility Index (Gold VIX) which measures gold volatility based on SPDR Gold Trust (GLD) options trading.  As bearish put positions on the GLD increase, the VIX rises as it did last August prior to a sharp correction in the price of gold.  After peaking at 40 last year, the VIX is currently at 22.

CBOE Gold VIX (GVZ) - courtesy cboe.com


Could the price of gold correct in the short term? Yes.  Should long term investors who hold gold as a safe haven against a government that has an official policy of debasing the currency be worried?  No.

A short term correction is nothing more than a buying opportunity for long term investors.  Why would one care if gold corrects to $1,600 on its way to $5,000?  Here are a few items for consideration by those worried about a “correction” in the price of gold.

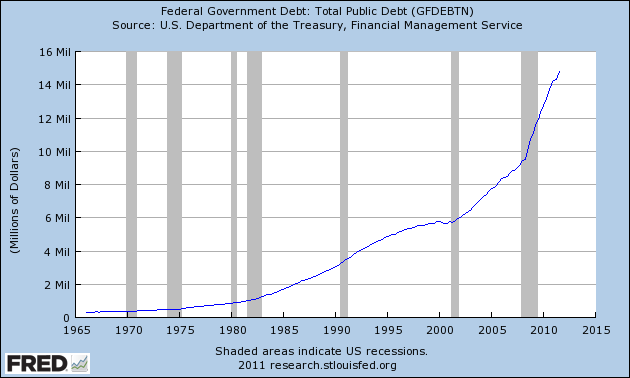
The U.S. has accumulated debt obligations and promises that are mathematically impossible to repay.  Neither future economic growth nor tax increases will be sufficient for the government to meet its obligations without debasing the value of the dollar.  The government is spending $1.60 for every $1.00 collected in revenues, half of all families receive some type of government payment and half of all wage earners pay no taxes.

The government’s “solution” for too much debt remains the same – more debt.  Here’s what Treasury Secretary Geithner said when he asked Congress to raise the debt limit in August 2009 when government debt totaled “only” $12.1 trillion.

“Congress has never failed to raise the debt limit when necessary. Because members of both parties have long recognized the need to keep politics away from this issue, these actions have traditionally received bipartisan support. This is clearly a moment in our history that calls for continuation of that tradition.”

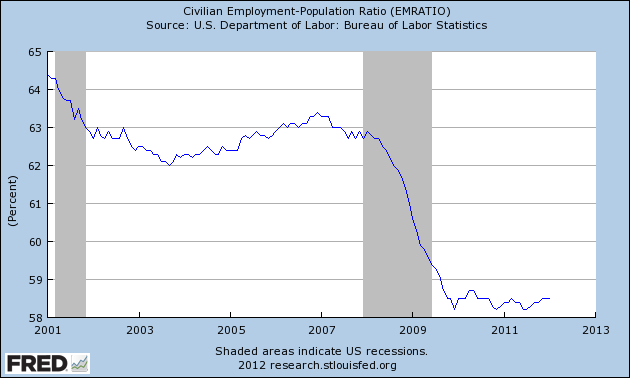
As the debt burden approaches the day of reckoning, the proportion of the population actually working continues to decline.

Investors late to the party attempting to diversity into gold may find that it’s too late – gold may not be available at any price.

Gregor Macdonald notes that global gold production over the last decade has been below the average of the past 110 years.  Normally, higher prices will  result in higher supplies as producers rush to capitalize on higher prices.  Despite the fact that the price of gold has increased every year for the past decade, gold production has barely increased – there is simply not that much gold left which hasn’t already been mined.


Global gold production - courtesy gregor.us

A looming price correction in gold?  Bring it on!

Gold Bullion Coin Sales Plunge 63% In November and 20% YTD – Have Americans Given Up On Gold?

Total sales of American Gold Eagle bullion coins plunged in November according to production figures from the U.S. Mint.

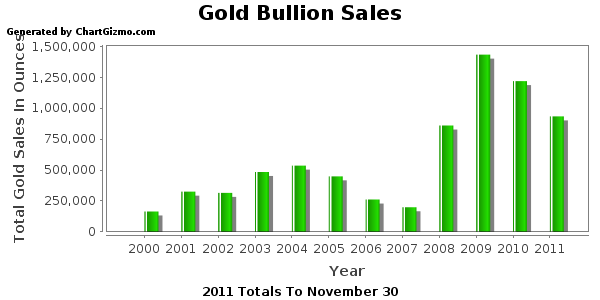
Total sales of gold U.S. Mint bullion coins declined by 63.4% in November from the previous year.  Sales of U.S. Mint gold bullion coins declined by 19.5% on a year to date basis through the end of November.  A total of 41,000 ounces were sold in November 2011 compared to sales of 112,000 ounces in November 2010.  Year to date sales through November totaled 934,500 ounces compared to the previous year to date totals of 1,160,500 ounces.

The reduction in the purchase of U.S. Mint gold bullion coins continues a trend of reduced sales since the record breaking year of 2009 when a total of 1,435,000 ounces were sold.  Total gold bullion sales  for 2011 will probably slip below one million ounces for the first time since 2009.  If sales decline in December by the same percentage amount as in November, total 2011 sales of gold bullion coins will come in at 956,500 ounces.

A summary of gold mint bullion coin sales since 2000 is shown below.

Gold Bullion Sales Since 2000

Gold Bullion U.S. Mint Sales Since 2000
Year Total Ounces Sold
2000 164,500
2001 325,000
2002 315,000
2003 484,500
2004 536,000
2005 449,000
2006 261,000
2007 198,500
2008 860,500
2009 1,435,000
2010 1,220,500
2011 934,500
Total 7,184,000

Why would gold bullion coin sales be plunging when gold has been steadily rising?  Have Americans given up on gold?  Let’s look at various trends in gold sales to get some perspective.

-Annual sales of gold bullion exceeded a half million ounces only once before 2008.  The financial crash of 2008 precipitated concerns about the integrity of both the banking system and the U.S. dollar, causing a huge increase in demand for physical gold.  Gold bullion sales exploded higher in 2008 and sales for 2011 remain far above levels seen prior to 2008 despite the recent drop in sales.

-Based on the current price of gold, the total value of all gold bullion purchased from the U.S. Mint since 2000 is $12.6 billion.  This amount represents only a fraction of the amount of investment dollars that have flowed into gold over the past decade.  In addition to purchasing physical gold, investors now have the option to purchase gold through gold trust ETFs.  The amount of money poured into the gold trust ETFs is many multitudes greater than the investment in physical gold bullion coins.  For example, since their inception in 2005, the combined gold holdings of the SPDR Gold Shares Trust (GLD) and the iShares Gold Trust (IAU) have grown to 47.2 million ounces valued at $82.5 billion.

-Gold ETFs have grown exponentially from their inception a short six years ago but the largest gold ETF, the SPDR Gold Shares Trust (GLD), has not been able to exceed its record gold holdings of 1,320.47 tonnes reached on June 29, 2010.  In addition, billionaire John Paulson recently liquidated a substantial portion of his GLD holdings, although much of the selling may have been forced due to severe losses in his hedge funds.

-Gold trader sentiment is either bullish or bearish, depending on who you talk to.

-Central banks, which have been increasing their purchases of gold since 2000, have sharply accelerated their purchases of gold bullion over the past several years.  Central banks from Asia and Latin America have accounted for most of the increased purchases.

-According to the World Gold Council, global gold investment demand increased by 33% in the 2011 third quarter compared to the prior year.  Investment demand for gold bars and coins increased by 29% and global gold holdings by gold trust ETFs increased by almost 78 tonnes.  Demand for gold increased notably during the third quarter in Europe and China.

While it is indisputable that global gold demand has increased, the appetite for gold by U.S. investors seems to be diminishing.  What do you think?


Why Gold And Silver Prices Will Continue To Rise

The September correction in the price of gold and silver resulted in a flood of bearish articles by the mainstream press, proclaiming that the “gold and silver bubbles” had burst.

Since the mainstream press does not comprehend why precious metals have been in a bull market for the past ten years, the proclamation of the “end of the gold and silver bull markets” was, in reality, a contrarian bullish call.

Every long term bull market has sharp sell offs and gold and silver are no exception to this rule.  The sharp rise of gold prices during the summer attracted hot money from speculators and hedge funds who quickly liquidated positions based on short term technical sell signals, driving down the price of gold by over $300 per ounce.

As previously discussed, the fundamental reasons for owning gold and silver have not changed – in fact, they have grown stronger.  The September sell off in precious metal prices was simply another fantastic opportunity for long term investors to increase positions at bargain prices.

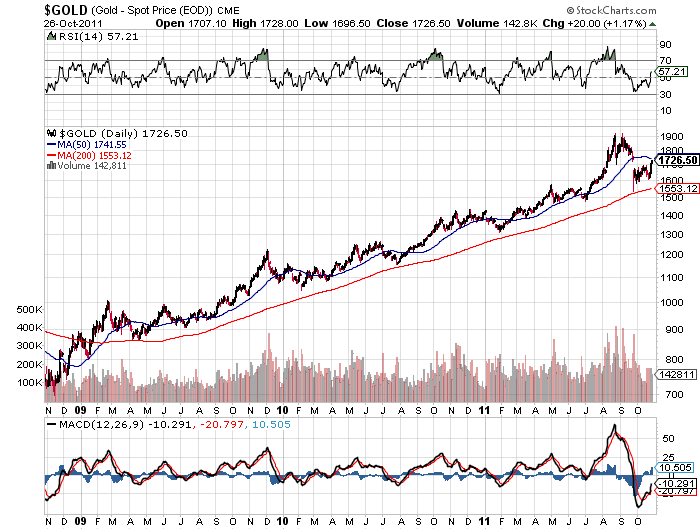
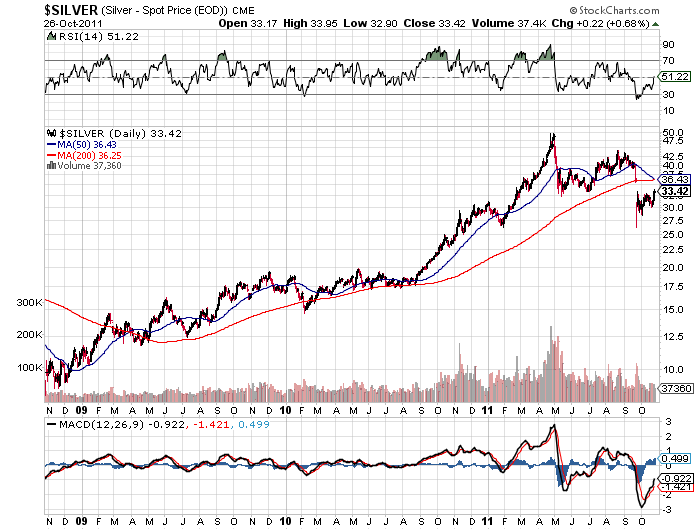
Long term investors in precious metals have outperformed virtually every asset class for the past ten years.  Even after the panic selling of September, gold still held gains of over 20% on the year from a price of $1,405 at the start of 2011.  Silver, despite a very volatile year, also remains above its price of $30.67 at the beginning of the year.

Both gold and silver remain in established long term up trends and remain at oversold, bargain level prices.


One strong fundamental factor providing support for further price gains in gold and silver comes from Mark Hulbert, whose Hulbert Financial Digest measures newsletter sentiment on the gold market.  Recent readings of the Hulbert Gold Newsletter Sentiment Index (HGNSI) (tracked by the Hulbert Financial Digest) revealed that at the end of last week gold timers were extremely bearish on gold.

The HGNSI readings dropped to the most bearish level in two and a half years, with gold market timers recommending a 13% short allocation in gold portfolios.  Hulbert’s research shows that gold usually rises when gold timers are very bearish.  Hulbert notes that gold timers have not been this bearish since March of 2009 – a level from which gold prices subsequently doubled.