 Total sales of American Gold Eagle bullion coins plunged in November according to production figures from the U.S. Mint.
Total sales of gold U.S. Mint bullion coins declined by 63.4% in November from the previous year. Sales of U.S. Mint gold bullion coins declined by 19.5% on a year to date basis through the end of November. A total of 41,000 ounces were sold in November 2011 compared to sales of 112,000 ounces in November 2010. Year to date sales through November totaled 934,500 ounces compared to the previous year to date totals of 1,160,500 ounces.
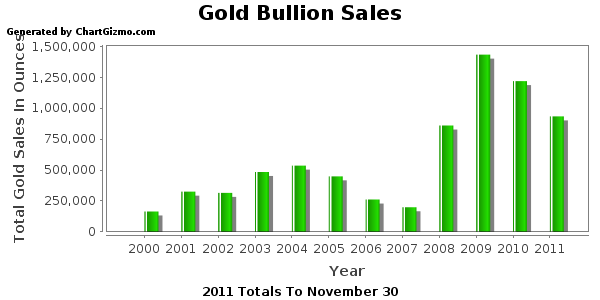
The reduction in the purchase of U.S. Mint gold bullion coins continues a trend of reduced sales since the record breaking year of 2009 when a total of 1,435,000 ounces were sold. Total gold bullion sales for 2011 will probably slip below one million ounces for the first time since 2009. If sales decline in December by the same percentage amount as in November, total 2011 sales of gold bullion coins will come in at 956,500 ounces.
A summary of gold mint bullion coin sales since 2000 is shown below.
| Gold Bullion U.S. Mint Sales Since 2000 | ||
| Year | Total Ounces Sold | |
| 2000 | 164,500 | |
| 2001 | 325,000 | |
| 2002 | 315,000 | |
| 2003 | 484,500 | |
| 2004 | 536,000 | |
| 2005 | 449,000 | |
| 2006 | 261,000 | |
| 2007 | 198,500 | |
| 2008 | 860,500 | |
| 2009 | 1,435,000 | |
| 2010 | 1,220,500 | |
| 2011 | 934,500 | |
| Total | 7,184,000 | |
Why would gold bullion coin sales be plunging when gold has been steadily rising? Have Americans given up on gold? Let’s look at various trends in gold sales to get some perspective.
-Annual sales of gold bullion exceeded a half million ounces only once before 2008. The financial crash of 2008 precipitated concerns about the integrity of both the banking system and the U.S. dollar, causing a huge increase in demand for physical gold. Gold bullion sales exploded higher in 2008 and sales for 2011 remain far above levels seen prior to 2008 despite the recent drop in sales.
-Based on the current price of gold, the total value of all gold bullion purchased from the U.S. Mint since 2000 is $12.6 billion. This amount represents only a fraction of the amount of investment dollars that have flowed into gold over the past decade. In addition to purchasing physical gold, investors now have the option to purchase gold through gold trust ETFs. The amount of money poured into the gold trust ETFs is many multitudes greater than the investment in physical gold bullion coins. For example, since their inception in 2005, the combined gold holdings of the SPDR Gold Shares Trust (GLD) and the iShares Gold Trust (IAU) have grown to 47.2 million ounces valued at $82.5 billion.
-Gold ETFs have grown exponentially from their inception a short six years ago but the largest gold ETF, the SPDR Gold Shares Trust (GLD), has not been able to exceed its record gold holdings of 1,320.47 tonnes reached on June 29, 2010. In addition, billionaire John Paulson recently liquidated a substantial portion of his GLD holdings, although much of the selling may have been forced due to severe losses in his hedge funds.
-Gold trader sentiment is either bullish or bearish, depending on who you talk to.
-Central banks, which have been increasing their purchases of gold since 2000, have sharply accelerated their purchases of gold bullion over the past several years. Central banks from Asia and Latin America have accounted for most of the increased purchases.
-According to the World Gold Council, global gold investment demand increased by 33% in the 2011 third quarter compared to the prior year. Investment demand for gold bars and coins increased by 29% and global gold holdings by gold trust ETFs increased by almost 78 tonnes. Demand for gold increased notably during the third quarter in Europe and China.
While it is indisputable that global gold demand has increased, the appetite for gold by U.S. investors seems to be diminishing. What do you think?
