March 29, 2024

Gold Bullion Coin Sales Jump 9% In December, But Decline 18% For The Year

Demand for physical gold increased in December as buyers took advantage of a recent pullback in gold prices.

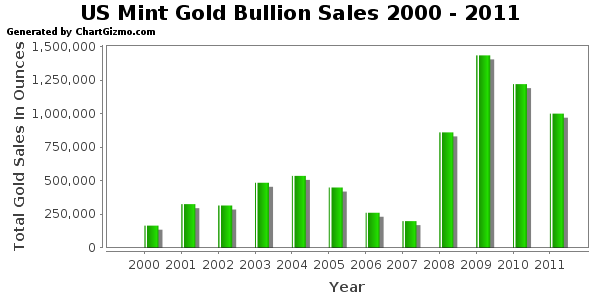
According to production figures from the U.S. Mint, sales of American Gold Eagle bullion coins in December totaled 65,500 ounces, an increase of 9.2% from December 2010.  Total sales of gold bullion coins for 2011 declined by 18% from the prior year.  For all of 2011, a total of 1,000,000 ounces were sold compared to previous year sales of 1,220,500 ounces.

The sales figures cited above do not include gold numismatic coins sold by the U.S. Mint.  Collector versions of gold coins such as the American Buffalo Gold Proof Coin can be purchased directly by the public from the U.S. Mint.

The American Gold Eagle bullion coins cannot be directly purchased by the public from the U.S. Mint.  Instead, a network of authorized purchasers (AP’s) buys the coins in bulk from the Mint at a fixed markup.  The AP’s in turn resell them to secondary retailers for public sale.  The AP distribution system established by the U.S. Mint was determined to be the most efficient method for selling gold bullion coins to the public at competitive prices.

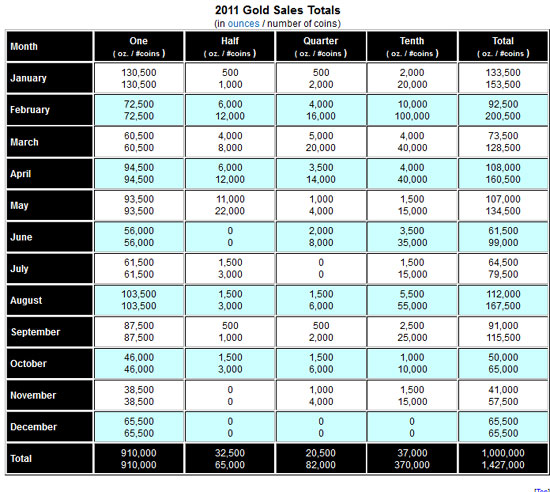
Although sales of gold bullion coins increased during August and September when gold was soaring to all time highs, the largest  monthly sales of gold bullion coins occurred in January when gold was trading in the $1,350 range (please see chart below for monthly sales figures).

U.S. Mint Gold Bullion Sales By Month


2011 marks the third year in a row of reduced purchases of gold bullion coins but this is not indicative of an overall reduction in investment gold demand.  Competing investments such as gold trust ETFs may be responsible for a large part of reduced demand for physical gold.

Besides much lower transaction costs, investors in gold ETFs or other paper gold products do not have to worry about security and storage costs.  Since their launch in 2005, investors have poured billions of dollars into gold trust ETFs.  For example, the SPDR Gold Shares Trust (GLD) and the iShares Gold Trust (IAU) now hold gold bullion valued at over $82 billion.  By contrast, the approximate value of all American Eagle Gold bullion coins purchased last year amounts to only $1.6 billion.

The all time record sales of American Eagle gold bullion coins occurred in 2009 when 1,435,000 ounces were sold.

Gold Bullion U.S. Mint Sales Since 2000
Year Total Ounces Sold
2000 164,500
2001 325,000
2002 315,000
2003 484,500
2004 536,000
2005 449,000
2006 261,000
2007 198,500
2008 860,500
2009 1,435,000
2010 1,220,500
2011 1,000,000
Total 7,249,500


Will gold bullion sales continue to decline?  The recent implosion of MF Global along with unrestrained money printing by central banks should provoke some clear headed thinking by investors.  Customers of MF Global who thought they had warehouse receipts for physical gold and silver were shocked to find that the bankruptcy trustee put all assets into a single pool to cover  claims of all customers who have lost billions of dollars.

Paper assets can be vaporized in an instant, even those that are allegedly backed by physical assets such as gold and silver.  A question well worth pondering is “Could what happened at MF Global also happen to investors in the gold trust ETFs”?
 

Gold Bullion Coin Sales Plunge 63% In November and 20% YTD – Have Americans Given Up On Gold?

Total sales of American Gold Eagle bullion coins plunged in November according to production figures from the U.S. Mint.

Total sales of gold U.S. Mint bullion coins declined by 63.4% in November from the previous year.  Sales of U.S. Mint gold bullion coins declined by 19.5% on a year to date basis through the end of November.  A total of 41,000 ounces were sold in November 2011 compared to sales of 112,000 ounces in November 2010.  Year to date sales through November totaled 934,500 ounces compared to the previous year to date totals of 1,160,500 ounces.

The reduction in the purchase of U.S. Mint gold bullion coins continues a trend of reduced sales since the record breaking year of 2009 when a total of 1,435,000 ounces were sold.  Total gold bullion sales  for 2011 will probably slip below one million ounces for the first time since 2009.  If sales decline in December by the same percentage amount as in November, total 2011 sales of gold bullion coins will come in at 956,500 ounces.

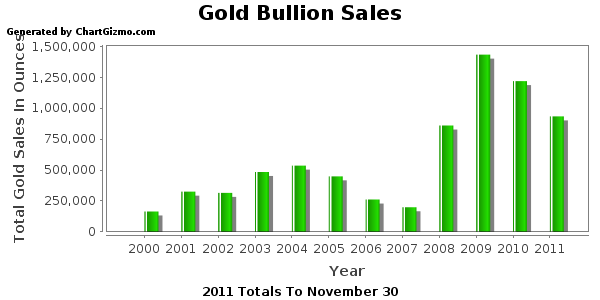
A summary of gold mint bullion coin sales since 2000 is shown below.

Gold Bullion Sales Since 2000

Gold Bullion U.S. Mint Sales Since 2000
Year Total Ounces Sold
2000 164,500
2001 325,000
2002 315,000
2003 484,500
2004 536,000
2005 449,000
2006 261,000
2007 198,500
2008 860,500
2009 1,435,000
2010 1,220,500
2011 934,500
Total 7,184,000

Why would gold bullion coin sales be plunging when gold has been steadily rising?  Have Americans given up on gold?  Let’s look at various trends in gold sales to get some perspective.

-Annual sales of gold bullion exceeded a half million ounces only once before 2008.  The financial crash of 2008 precipitated concerns about the integrity of both the banking system and the U.S. dollar, causing a huge increase in demand for physical gold.  Gold bullion sales exploded higher in 2008 and sales for 2011 remain far above levels seen prior to 2008 despite the recent drop in sales.

-Based on the current price of gold, the total value of all gold bullion purchased from the U.S. Mint since 2000 is $12.6 billion.  This amount represents only a fraction of the amount of investment dollars that have flowed into gold over the past decade.  In addition to purchasing physical gold, investors now have the option to purchase gold through gold trust ETFs.  The amount of money poured into the gold trust ETFs is many multitudes greater than the investment in physical gold bullion coins.  For example, since their inception in 2005, the combined gold holdings of the SPDR Gold Shares Trust (GLD) and the iShares Gold Trust (IAU) have grown to 47.2 million ounces valued at $82.5 billion.

-Gold ETFs have grown exponentially from their inception a short six years ago but the largest gold ETF, the SPDR Gold Shares Trust (GLD), has not been able to exceed its record gold holdings of 1,320.47 tonnes reached on June 29, 2010.  In addition, billionaire John Paulson recently liquidated a substantial portion of his GLD holdings, although much of the selling may have been forced due to severe losses in his hedge funds.

-Gold trader sentiment is either bullish or bearish, depending on who you talk to.

-Central banks, which have been increasing their purchases of gold since 2000, have sharply accelerated their purchases of gold bullion over the past several years.  Central banks from Asia and Latin America have accounted for most of the increased purchases.

-According to the World Gold Council, global gold investment demand increased by 33% in the 2011 third quarter compared to the prior year.  Investment demand for gold bars and coins increased by 29% and global gold holdings by gold trust ETFs increased by almost 78 tonnes.  Demand for gold increased notably during the third quarter in Europe and China.

While it is indisputable that global gold demand has increased, the appetite for gold by U.S. investors seems to be diminishing.  What do you think?


US Mint Gold Bullion Sales Set Rapid Pace

The recent declines in precious metals seem to have shifted some investors preferences. For the current month to date, US Mint sales of gold bullion sales are on pace for the highest levels of the year, while silver bullion sales remain at typical levels.
From their peak prices reached in late April, silver has declined by about 32% while gold has declined by a modest 6%.

In the past week, the US Mint has sold 15,500 troy ounces of gold bullion coins, comprised of 11,000 ounces of American Gold Eagles and 4,500 ounces of American Gold Buffaloes. Monthly totals are now 89,000 and 9,500 ounces respectively. These figures reflect sales through May 16, 2010.

US Mint Bullion Coin Sales for Week Ending 5/16/2011 (troy ounces)

Gold Eagle 11,000
Gold Buffalo 4,500
Silver Eagle 756,500
Silver ATB 15,000

Silver bullion products, which remain subject to rationing, sold a combined 771,500 troy ounces in the past week. This consisted of 756,500 ounces worth of American Silver Eagles and 15,000 ounces worth of the 5 ounce America the Beautiful Silver Bullion Coins. For the latter product, the US Mint has now sold all of the available coins for the first two designs of the year featuring Gettysburg National Military Park and Glacier National Park. An additional 126,700 coins (633,500 troy ounces) featuring the Olympic National Park design will go on sale to authorized purchasers on May 23, 2011.

US Mint Bullion Coin Sales for Year to Date (troy ounces)

Gold Eagle Gold Buffalo Silver Eagle Silver ATB
January 133,500 6,422,000
February 92,500 3,240,000
March 73,500 38,000 2,767,000
April 108,000 20,500 2,819,000 1,127,000
May 89,000 9,500 2,177,500 140,000
Total 496,500 68,000 17,425,500 1,267,000

For the year to date, silver bullion coin sales have reached 18,692,500 troy ounces. Last year, the US Mint had sold 35,487,500 ounces across the two available silver bullion coin programs.

Gold bullion coin sales have reached 564,500 ounces for the year to date, compared to 1,429,500 for the prior year.


US Mint Gold Bullion Sales Collapse in August

The US Mint’s published sales figures for the month of August show a stunning decline in the level of gold bullion sales. The monthly sales for their popular American Gold Eagle bullion coins measured just 41,500 ounces. This represents the lowest monthly total since June 2008, before the financial crisis took hold and led to a surge in bullion sales.
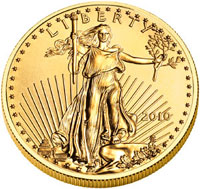
American Gold Eagle sales during August included 39,000 one ounce coins, 1,000 one-half ounce coins, 2,000 one-quarter ounce coins, and 15,000 one-tenth ounce coins to make up the total sales of 41,500 ounces. This represents a decline of more than 70% compared to the previous month and about 50% compared to the year ago period.

The US Mint’s other gold bullion offering, the 24 karat American Gold Buffalo also put in a lackluster month with sales of 15,500 of the one ounce coins. This is down from a monthly high of 70,500 ounces in May and the prior month total of 23,000 ounces. In the year ago period, the coins were not available.

Since the American Gold Eagle coins have been available continuously (amidst a few periodic suspensions), the monthly sales totals illustrate the pattern demand for the US Mint’s gold bullion coin. There have been a few other monthly drops over the course of the past few years and demand has always managed to recover.

Here are the monthly sales totals for American Gold Eagle bullion coins (in ounces) since June 2008.

Jun-08 15,500
Jul-08 50,000
Aug-08 86,000
Sep-08 113,000
Oct-08 121,500
Nov-08 116,500
Dec-08 176,000
Jan-09 92,000
Feb-09 113,500
Mar-09 136,500
Apr-09 147,500
May-09 65,000
Jun-09 116,000
Jul-09 86,000
Aug-09 82,000
Sep-09 115,500
Oct-09 115,500
Nov-09 124,000
Dec-09 231,500
Jan-10 85,000
Feb-10 84,000
Mar-10 102,000
Apr-10 60,500
May-10 190,000
Jun-10 151,500
Jul-10 152,000
Aug-10 41,500

US Mint Silver Bullion Sales on Record Pace, Gold Sales on Pace for Fourth Highest

Through June 30, 2010, the United States Mint has sold 18,168,500 ounces of silver bullion and 833,500 ounces of gold bullion. If the current pace is maintained for the rest of the year, US Mint silver bullion sales will break another record and gold will be within the top four annual sales totals.

The United States Mint currently offers the one ounce American Silver Eagle. This has been the US Mint’s only silver bullion coin option since its debut in 1986. Annual sales totals have ranged from a low of 3,466,000 ounces sold in 1996 to a high of 28,766,500 ounces sold in 2009.

This year’s mid-year total sales of 18,168,500 suggests that a new record high for annual sales will be extremely likely. Monthly sales figures have been relatively steady with four months above the 3 million level. It should be noted that this is not necessarily indicative of steady demand, as sales of the coins are currently subject to an allocation program, which rations the available supply amongst the US Mint’s authorized purchasers.

Later this year, the US Mint will be releasing a new series of America the Beautiful Silver Bullion Coins. These coins will contain 5 ounces of silver and feature designs which are duplicates of the current quarter program. It’s still uncertain just how many of these new silver bullion coins the US Mint will produce and whether this will have a meaningful impact on overall silver bullion sales.

On the gold bullion side, the US Mint current offers the American Gold Eagle and the American Gold Buffalo. The first is a 22 karat gold coin available in one ounce, one-half ounce, one-quarter ounce, and one-tenth ounce sizes. The latter is a 24 karat gold coin available in one ounce size only.

The mid-year gold bullion sales total of 833,500 ounces is made up of the following:

  • 618,500 American Gold Eagle 1 oz
  • 31,000 American Gold Eagle 1/2 oz
  • 44,000 American Gold Eagle 1/4 oz.
  • 280,000 American Gold Eagle 1/10 oz.
  • 160,500 American Gold Buffalo 1 oz.

According to the latest information I have read, the one ounce bullion coins are not subject to allocation, however the fractional weight gold bullion coins are subject to allocation. These coins available to authorized purchasers starting on June 10, 2010.

The highest annual US Mint gold bullion sales was achieved in 1999 when 2,055,500 ounces were sold. This is followed by 1998 at 1,839,500 ounces, 1986 at 1,787,750 ounces, and 2009 with 1,625,500 ounces. The lowest annual gold bullion sales total occurred in 2002 when only 164,500 ounces of gold were sold for the entire year. The US Mint actually sold more gold bullion than this last month when 185,000 ounces were sold.