April 24, 2024

U.S. Mint Sales of Gold and Silver Bullion Coins Jumps 100%

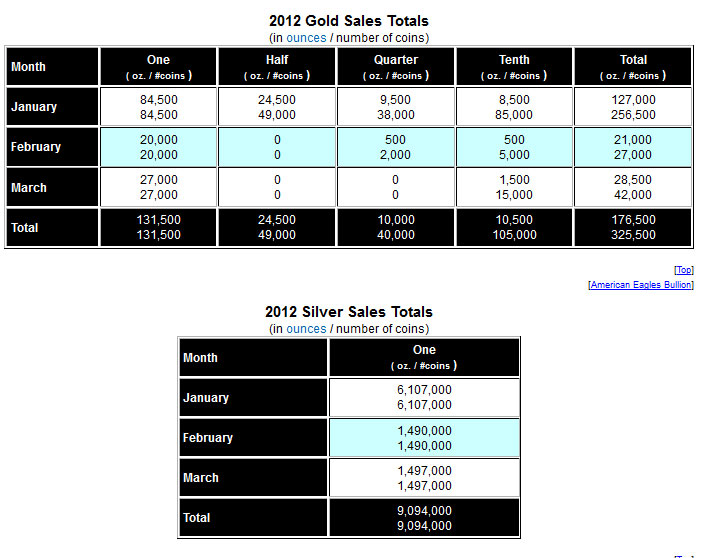
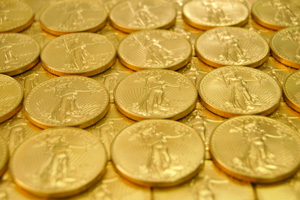
The U.S. Mint reports that March sales of the American Eagle Gold and Silver Bullion coins are on track to more than double from February sales levels.  Sales during February were unusually low with gold bullion sales down 77.3% and silver bullion sales down 54% from the prior year.  Shown below are the U.S. Mint sales figures for gold and silver bullion coins through March 15, 2012.
The U.S. Mint bullion program has been extremely popular with the public and sales of the bullion coins has soared since 2007.  The gold and silver American Eagle bullion coins are sold by the U.S. Mint to authorized purchasers who pay the U.S. Mint for the cost of the metal plus a mark up to cover operating costs.  The dealers, who are required to maintain a market for the coins, sell to the general public at the market price of the coin plus a premium to cover operating costs.  The weight, purity and content of each bullion coin is guaranteed by the United States Mint.

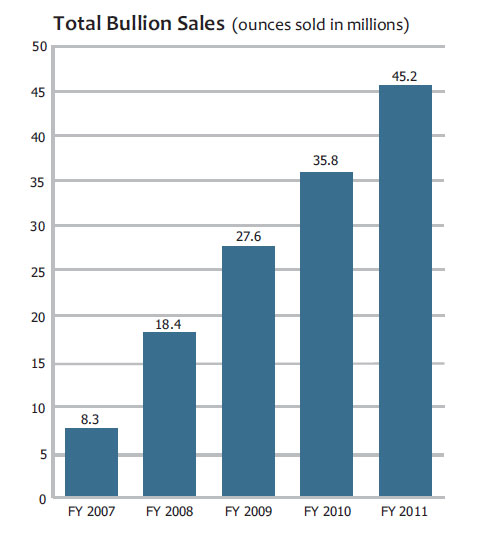
During the U.S. Mint’s fiscal year 2011, demand for bullion coins reached all time highs with sales of 45.2 million ounces of silver and gold bullion coins, up 26.2% from the prior year.  Total U.S. Mint revenue from the sale of the bullion coins also hit an all time record high of $3.5 billion.  Demand for the American Eagle Silver Bullion Coin was especially robust with sales more than doubling from the previous year’s total.   Last year’s sales of the American Eagle Gold Bullion coins, however, declined by 22.7% due to the higher price of gold and a change in the product release schedule for the American Gold Buffalo Bullion coin.

U.S. Mint Bullion Sales

The U.S. Mint also produces numismatic proof versions of the American Gold and Silver Eagles coins which are sold by the Mint directly to the public.  Due to unprecedented demand for gold and silver, the U.S. Mint was unable to offer the proof coins during fiscal year 2009.

The top selling numismatic coin for the past two years was the American Eagle Silver Proof 1 ounce coin with sales of 850,000 coins  in 2010 and 751,000 coins in 2011.

The 2012 American Silver Eagle Proof coin is scheduled to go on sale April 12, 2012 at an expected price of $59.95.
Gold and Silver News and Headlines – Gold Owners Get Nervous

Precious metals advanced across the board today, with palladium the stellar performer with a 2.86% gain.  Gold gained $9.70 to $1685.30, silver tacked on $0.48 to $33.53, platinum rose $18 to $1633.00 and palladium jumped $19.00 to $689.00.

Although precious metals recently hit a selling storm (see The Flash Crash in Gold), precious metals remain up strongly on the year and gold is up $257.20 per ounce or 18% over the past year.  The following chart show the gains for the year on the precious metals group.  All prices per the London PM Fix closing price.

GOLD SILVER PLATINUM PALLADIUM
JAN 3RD $1,590.00 $28.78 $1,406.00 $664.00
MARCH 7TH $1,677.50 $33.17 $1,627.00 $678.00
$ GAIN $87.50 $4.39 $221.00 $14.00
% GAIN 5.50% 15.25% 15.72% 2.11%

Here’s a brief round up of some of the latest thoughtful coverage on gold and silver related news.

Free Von Nothaus from the tyranny of unjust government actions – Judging Silver or Something Else?

As I look at the circumstances, I do not see that von Nothaus or his Liberty Dollar products victimized anyone. In contrast, those who chose to keep Federal Reserve Notes and coinage of the U.S. Mint have been victimized by loss of purchasing power. If anything, and I say this with all due respect, it seems to me that it would be more sensible and appropriate to prosecute those who have victimized American citizens through the depreciation of the “money” issued by the U.S. government.

US Mint Drops Price of Gold Products

With all of the pricing data now available, the US Mint’s gold numismatic products are set for a two tier decrease. This will reduce prices by the equivalent of $100 per ounce of gold content.

Owning gold is a “privilege, not a right”.  Why The US Confiscated Gold in 1933 and Can It Happen Again?

We previously stated that gold ownership was made illegal on 1st May 1933. What we did not tell you was that U.S. citizens, under Order 6102, were allowed to own up to $100 in gold coin [+5 ounces].

Congress could easily revoke the privilege again. In fact, at no time during this century has the U.S. government recognized the right of private gold ownership.

The privilege, not right, to own gold was restored to U.S. citizens on the 15th August 1974 (not 1971, when Nixon floated the USD against gold and stopped foreign central banks from converting USD to gold). It is pertinent to the thinking behind this series, to understand the importance to government of gold and that the right to confiscate may not be restricted to individuals or institutions but could embrace a nation or two.

It’s believed that some 60% of Germany’s gold is stored outside of Germany and much of it in the Federal Reserve Bank of New York. If this is the case one has to ask, in the light of the massive currency swaps engineered by the Fed and the E.C.B. to raise the two tranches of cheap money for European banks, “Was gold swapped too, or was it pledged as collateral?”

The public pressure to repatriate national gold reserves has heightened considerably in the last year. Should Germany want its gold back home, we ask, “Can it get it back or has it already been used in these ways?

Germany to Review Bundesbank Gold Reserves in Frankfurt, Paris, London and Federal Reserve Bank of New York

German lawmakers are to review Bundesbank controls of and management of Germany’s gold reserves.  Parliament’s Budget Committee will assess how the central bank manages its inventory of Germany’s gold bullion bars that are believed to be stored in Frankfurt, Paris, London and the Federal Reserve Bank of New York, according to German newspaper Bild.

There is increasing nervousness amongst the German public, German politicians and indeed the Bundesbank itself regarding the gigantic risk on the balance sheet of Germany’s central bank and this is leading some in Germany to voice concerns about the location and exact amount of Germany’s gold reserves.

The eurozone’s central bank system is massively imbalanced after the ECB’s balance sheet surged to a record 3.02 trillion euros ($3.96 trillion) last week, 31% bigger than the German economy, after a second tranche of three-year loans.

The concern is that were the eurozone to collapse, Bundesbank’s losses could be half a trillion euros – more than one-and-a-half times the size of the Germany’s annual budget.

In that scenario, Germany’s national patrimony of gold bullion reserves would be needed to support the currency – whether that be a new euro or a return to the Deutsche mark.

Bernanke Spooks Gold

Instead, this selloff was sparked not by a development, but a non-development. In his address to Congress, Fed Chairman Ben Bernanke offered no clue as to when the Federal Reserve would unleash its next round of quantitative easing.

The markets took this as a sign that the monetary madness is coming to an end, which would bode poorly for precious metals. Metals are increasingly seen as substitutes for continuously debased fiat money, and tend to do well when new liquidity injections are announced.

Bernanke’s failure to telegraph more printing means nothing. Investors are craving a return to normalcy, which means more prudent monetary policy. As a result, many are grasping at straws. But I believe these hopes are premature, and that gold will be buoyed by easy money for quite some time.

In addition, gold will likely be favored by the greatest financial struggle of the coming decade: China’s plans to replace the United States as the dominant economic power.

Buy Japanese Bonds At 0.05% And Get A Gold Coin

Japan began selling special government bonds Monday aimed at raising funds for reconstruction from the March 2011 earthquake and tsunami, saying it will present buyers with commemorative gold coins imprinted with an image of the “miracle pine” that survived the killer tsunami when the bonds mature in three years.

The coins — worth ¥10,000 each, and silver coins worth ¥1,000 — are engraved with the design of the 30-meter-high pine in Rikuzentakata, Iwate Prefecture, that was the only one of about 70,000 pines on a stretch of coast to survive the massive tsunami.

Peter Schiff on why Buffett is wrong about gold – Buffett’s Bursting Bubble

The gold doomsayers have found their champion in the media’s favorite financial advisor and one of the world’s richest men. Warren Buffett, the man dubbed the “Oracle of Omaha,” has repeatedly and publicly denied that gold is an investment, and called gold buyers “speculators” and people “who fear almost all other assets.” In fact, Buffett claims that gold’s rise has the same characteristics as the housing and dot-com bubbles, and it is only a matter of time before it reverses course. He doesn’t mean that the price will decline because of austerity measures and a free-market interest rate, mind you. He just asserts that because he’s deemed it a bubble, it will inevitably burst.

Gold prices will only go down when governments change course and make significant cuts. Until then, gold is not in a bubble. It’s the only way to protect your wealth; and in the current economic condition, it’s poised to go much higher. I think it’s high time Buffett takes to heart his father’s wise words: “For if human liberty is to survive in America, we must win the battle to restore honest money.”

The Volatile Ride To Higher Gold

Back in 1980, Phase Three only lasted for 21 days, but increased 66% in that time span. Considering the ten year time span of Phase One, and my projection for Phase Two, I feel that Phase Three (which starts in 2015) will last for six months and drive gold up to over $6,000 per ounce. If the world’s financial leaders decide to return to a Gold Standard, or if gold bullion confiscation becomes the government’s reaction to severe inflation, my projections would escalate. Possible other government reactions that can affect my projections negatively are: limiting gold ownership, restrictions on transporting or trading, and any Gold windfall profits tax.


Gold And Silver Bullion Coin Sales Plunge In February

The latest production figures from the U.S. Mint show a dramatic decline in the sale of both gold and silver bullion coins.

According to the U.S. Mint, sales of American Gold Eagle bullion coins in February 2012 totaled 21,000 ounces, a decrease of 83.5% from January sales of  127,000 ounces.  Gold bullion coin sales declined by 77.3% from the prior year when a total of 92,500 ounces were sold in February 2011.

Sales of the American Gold Eagle bullion coins during February is the lowest since June 2008 when the Mint sold 15,500 ounces.  During 2011, the U.S. Mint sold an average of 83,333 ounces of gold bullion coins each month and rang up annual sales of 1,000,000 ounces.  During 2011, sales of the gold bullion coins declined for the third consecutive year.

Sales of the American Silver Eagle bullion coins also declined dramatically during February.  The U.S. Mint reports total February sales of 1,490,000 silver bullion coins, down 76.6% compared to 6,107,000 during the previous month.  Sales of the silver bullion coins during February declined by 54% from February 2011 sales of 3,240,000 ounces.  Sales of the American Silver Eagle bullion coins were the lowest since November 2011 when the U.S. Mint sold 1,384,000 ounces.

Gold and silver sales detailed above do not include U.S. Mint gold and silver numismatic coins which are sold directly to the public.

The American Gold and Silver Eagle bullion coins cannot be directly purchased by the public from the U.S. Mint.  The U.S. Mint sells the gold and silver eagle bullion coins only to a network of authorized purchasers (AP’s) who in turn resell them to the public and secondary retailers.  The U.S. Mint determined that the AP distribution system was the most efficient means of retailing coins to the public at competitive prices.

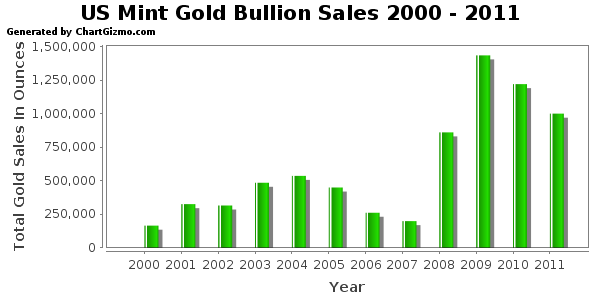
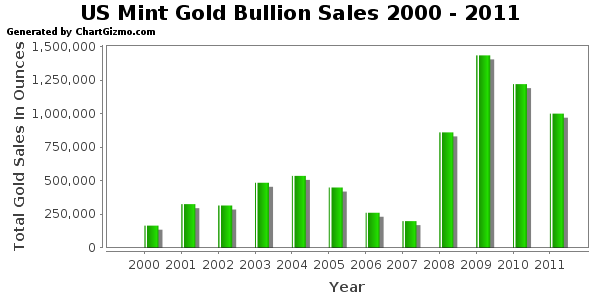
Total yearly U.S. Mint gold bullion coin sales from January 1, 2000 to February 29, 2012 are shown below.

Gold Bullion U.S. Mint Sales By Year
Year Total Ounces Sold
2000 164,500
2001 325,000
2002 315,000
2003 484,500
2004 536,000
2005 449,000
2006 261,000
2007 198,500
2008 860,500
2009 1,435,000
2010 1,220,500
2011 1,000,000
2012 148,000
7,397,500
Note: 2012 total through February 29, 2012

Shown below are the yearly U.S. Mint sales figures since 2000 for the American Silver Eagle bullion coins.   Sales totals for 2012 are through February.

American Silver Eagle Bullion Coin Sales
YEAR OUNCES SOLD
2000 9,133,000
2001 8,827,500
2002 10,475,500
2003 9,153,500
2004 9,617,000
2005 8,405,000
2006 10,021,000
2007 9,887,000
2008 19,583,500
2009 28,766,500
2010 34,662,500
2011 39,868,500
2012 7,597,000
TOTAL 205,997,500

The U.S. public has acquired over 200 million ounces of American Silver Eagle bullion coins since 2000 which are now valued at roughly $7.4 billion.  By comparison, the iShares Silver Trust ETF (SLV) currently holds 313 million ounces of silver bullion valued at $11.7 billion.

Gold Remains The Best Alternative To Paper Money

Two examples of the frustrations that some gold investors have gone through in the past year offers a valuable lesson to long term gold investors.

  1. During 2011, despite being heavily invested in gold, John Paulson’s Gold Fund wound up losing 11% of its value.  This despite the fact that gold bullion gained $142.50 during 2011, closing the year at $1,531.00, up 10.2% (see How Did An Investment Pro Lose Money Investing in Gold?).
  2. Investors in the $4.4 billion Vanguard Precious Metals Fund (VGPMX) which holds almost all of its assets in a diversified portfolio of precious metal mining stocks dropped by a stunning 27.4% last year, declining from $26.71 on January 3rd to $19.39 on December 30, 2011.

In both of the above cases, the declines in value were primarily due to the large under performance of gold stocks to gold bullion during 2011.  Nonetheless, nothing stings more than picking the right asset class only to somehow wind up losing.  An investor bullish on gold and investing completely in gold stocks would have had a disastrous year.  An investor with a large position in gold, diversified across gold mining stocks, gold bullion and gold ETFs would have performed substantially better.

Although gold stocks can often outperform gold bullion, many investors may lack the expertise to pick the best gold stock or gold mutual fund.  The best strategy for most small gold investors is to buy physical gold bullion at regular intervals with a commitment to a long term holding period.  Over the years, I have seen far too many uninformed investors who want a position in gold wind up trading speculative junior gold stocks, often times resulting in large losses.  Gold mining stock prices can be volatile and even when an investor selects quality gold stocks, the temptation to liquidate a position during  price weakness often results in losses.

The gold investor who has purchased gold bullion consistently over the past decade has been amply rewarded and there is no reason to expect this trend to change.

Meanwhile, John Paulson remains committed to gold and recently told Bloomberg News that he personally owns over half of the $1.2 billion Gold Fund he manages.

John Paulson, the hedge fund manager seeking to rebound from record losses in 2011, told investors his Gold Fund will outperform his other strategies over five years, according to a person with knowledge of the matter.

The billionaire, at a meeting yesterday at the Metropolitan Club in New York, said the metal is the best hedge against currency debasement as countries inject money into their economies, said the person, who attended the event and asked not to be named because the information is private. Paulson also cited gold as a hedge against the euro currency, as a breakup may occur, and an eventual increase in inflation.

The manager told clients his own money comprises 55 percent of the Gold Fund’s $1.2 billion in assets, the person said. The fund, which can buy derivatives and other gold-related securities, declined 11 percent last year after the metal slumped 14 percent in the final four months.

Europe’s sovereign-debt crisis may continue to affect bullion in the near term, Paulson, whose firm manages $23 billion, said this month in a year-end letter to investors. The metal serves as the best long-term alternative to paper currencies, he said.

“We remain excited about the outlook for the Paulson Gold Funds over the next few years,” he said in the letter. “We would argue that the potential upside in gold outweighs the potential downside.”

In addition to his Gold Fund, Paulson also holds a large position in the SPDR Gold Trust (GLD) ETF, valued at $2.9 billion.  As of February 24, 2011, the SPDR Gold Trust holds 41.3 million ounces of gold valued at $73.4 billion.

Are Gold Investors Nuts?

How many of the countries best financial advisors are telling their customers to invest in gold?  Despite the fact that gold has gone up for the past eleven years, a Barron’s survey shows that gold remains distinctly out of favor by mainstream investment advisors.

Barron’s interviewed 51 of the countries most successful investment advisors from each of the fifty states plus the District of Columbia.  Although investment returns were not disclosed, Barron’s selected the best investment pros based on the amount of assets managed, revenues generated, gain in the number of clients and the quality of their practices.

The 51 pros selected by Barron’s are the best in the business, work hard, serve wealthy sophisticated clients and manage hundreds of billions of dollars of wealth.  According to the survey, the most common investment strategy of the top financial advisors was to generate income flows and potential capital gains by owing high quality blue chip stocks.  Most of the advisors were optimistic, predicting that dividend paying stocks would outperform government securities on which yields have plunged to all time lows.

Of the 51 advisors interviewed, only two specifically recommended a small portfolio allocation into gold.  The investment advisor from Iowa recommended that clients make “sure 3% to 5% of their portfolios are in gold” and the investment pro from Nebraska suggested a 10% position in gold mining stocks.

The number of investment pros recommending gold was surprising low, especially after considering the potential for another financial meltdown precipitated by sovereign debt crises, rampant money printing by central banks and towering levels of debt that threaten to crush the world economy.

Gold - courtesy kitco.com

Gold has proven to be a vehicle for wealth preservation over thousands of years and is insurance against financial disaster.  Has the increase in gold since 2000 already fully discounted the worst possible economic and financial scenarios?

Barron’s smart money pros apparently think that gold’s run is over.  Are gold investors nuts to argue with the world’s best money managers, especially after an almost 7 fold increase in the price of gold since 2000?  What do you think?

More on this topic: Gold Bull Market Could Last Another 20 Years With $12,000 Price Target

Investor Gold Demand Hits All Time Record – China and India Grab 61% Of Total Gold Mine Production

Investor demand for gold during 2011 hit an all time high, fueled by soaring demand in China and India.  Total gold demand by China and India during 2011 amounted to a staggering 61% of all gold mine production last year.

The 2011 Gold Demand Trends report issued by the World Gold Council show a huge increase in gold demand and a small increase in global gold mine production.  This continues a trend that has been in place since 2001.  Despite an almost 600% increase in the price of gold since 2001, global gold mine production has increased by only 7.7%.

Typically, a large increase in price will bring forth additional supplies as producers rush to take advantage of higher prices.   This has not happened with gold due to the depletion of existing gold reserves and the inability of miners to discover and develop new gold deposits.  The continuing increase in gold demand and the lack of new supply will eventually result in gold prices higher than most people can imagine today.

Highlights of the Gold Demand Trends report are summarized below.

  1. For the first time ever, on a dollar basis, gold demand hit all time record highs at $205.5 billion, representing 4,067.1 tonnes of gold.
  2. Investor demand for gold hit all time record of 1,640.7 tonnes, up 5% from the previous year.
  3. Demand for gold by China soared 20% last year to 769.8 tonnes and demand by India, despite currency weakness, was 933.4 tonnes.  It is expected that China will become the largest gold market in the world during 2012 based on continued record setting demand.
  4. Global gold production increased by only 4% last year to 2,809.5 tonnes.  The combined gold demand of 1,703.2 tonnes by China and India consumed 60.6% of all new gold mine production.  It is projected that the supply of new gold will remained “restrained” for the foreseeable future.
  5. The desire to protect wealth accounted for surging gold demand in Europe as the European Central Bank engages in a massive money printing campaign to prop up the insolvent banking system.
  6. Central banks continued to buy gold during 2011, increasing total purchases to 440 tonnes, up by 77 tonnes from last year.
  7. The amount of gold available to meet demand is being restrained not only by low mine production but also by reduced supplies of gold from recycling.   Despite a 28% increase in gold prices last year, the supply of recycled gold declined by 2% to 1,611.9 tonnes.  According to the Gold Council, this implies that “market supplies are drying up and that consumers may be holding on to their gold in the expectation of higher prices.”
  8. Investors are showing a strong preference for physical gold as seen by the investment flows into bar and coin compared to ETF demand.   Demand for gold bar and coin during 2011 totaled 1,486.7 tonnes compared to ETF demand of only 154.0 tonnes.
  9. Gold demand by ETFs increased in the 2011 fourth quarter over the comparable period last year, but total demand during 2011 of 154.0 tonnes was far below ETF gold demand of 367.7 tonnes during 2010.

The Gold Council bullishly notes that the gold market is unique in that it is driven by a “diverse set of factors” and multiple sources of demand.

Lowering Gold Stock Portfolio Risk Through Diversification

There are numerous investment strategies available to capitalize on the gold bull market.  Gold investors have the option of investing in gold bullion, gold coins, gold ETFs, gold mutual funds and individual gold mining stocks.

Although many gold investors prefer to exclusively hold physical gold, diversifying into selected gold stocks can dramatically increase total returns.  Although gold stocks as a group have recently underperformed bullion, selected gold stocks have outperformed gold bullion.

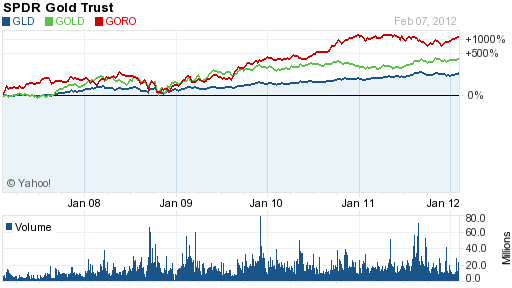
Well managed gold mining companies with large ore reserves and increasing mine production have provided investment returns far in excess of the gain in gold bullion as seen below with the examples of Randgold Resources (GOLD) and Gold Resource Corp (GORO).  Both of these gold mining companies have vastly outperformed gold bullion when compared to the SPDR Gold Trust (GLD) which tracks the price of gold bullion.

GORO, GOLD vs GLD - Courtesy yahoo.com

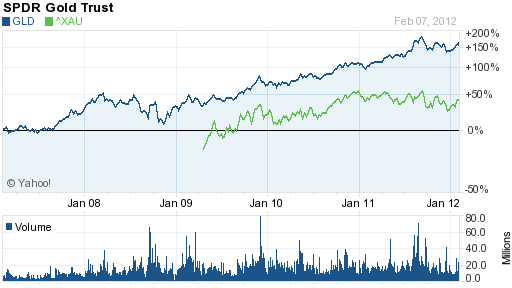
Selecting the gold stock that will outperform bullion is difficult, however, as seen by the lagging performance of the PHLX Gold/Silver Sector (XAU) when compared to the GLD.  The XAU Gold/Silver Sector is a broad based index of sixteen large precious metal mining companies.  The GLD has outperformed the XAU by three times since 2009.

GLD vs XAU - courtesy yahoo.com


As with any stock portfolio, diversification is required into order to avoid the risk of under performance.  An example of the risk of holding a gold portfolio with only a small number of stocks was seen today when the price of Nevsun Resources (NSU) collapsed by almost 31% after the company unexpectedly announced that gold production will plunge by nearly half in 2012 due to a reduction in estimated gold reserves.

Since selecting individual gold stocks can be a daunting task for investors, a better alternative would be to invest in an actively managed gold stock mutual fund with a proven record of superior investment returns.  Past performance has shown that an actively managed gold stock mutual fund has outperformed passively managed gold index funds.

One gold fund that should top the list for investors to consider is the Tocqueville Gold Fund (TGLDX), run by legendary gold investor John Hathaway.  The Tocqueville Gold Fund has a remarkable average annual return over the past ten years of 23.3%, almost double the gain in the Philadelphia Gold/Silver Index.

courtesy yahoo.com

Although gold bullion has outperformed gold stocks since 2008, Mr. Hathaway’s outlook for gold remains extremely bullish and he expects that as gold continues to increase in price, gold stocks should once again outperform the returns of gold bullion.  In his latest Investment Update, here is what Mr. Hathaway had to say.

Gold and gold stocks appear to be bottoming in the wake of a four month correction which began in mid -August when the metal peaked at $1900/oz. Bearish sentiment is at extremes not seen in many years. This and a number of other indicators, such as stocks that have been hit by negative sentiment, the downtrend in gold prices since August, and tax loss selling, support our view that a rally lies ahead. This very bullish market set-up, in our opinion, mirrors the extraordinary investment opportunity of the despondent year end in 2007. Even though gold prices have been declining for several months, they finished the year with substantial gains. This suggests that the value represented by gold mining equities held in our portfolio could be extraordinary.

Disarray in Europe is, in our opinion, a slow motion version of the global market meltdown in 2007. It appears to us that the U.S. Fed is once again acting as the lender of last resort to European central banks in their efforts to save the euro. As in 2007, U.S. sovereign credit will be substituted for failing credits, in this case, peripheral European states. The fig leaf to justify such action on the Fed’s part is sado-fiscalism, or extreme austerity packages administered by technocrats. Tough restraints on profligate public spending, which has become a way of life in all Western democracies, will not go down easily. These measures are deflationary and will be ultimately met by howls of protests from mobs demanding renewed money printing and deficit spending. In our opinion, the fundamentals for gold are stronger than ever because the outlook for paper currencies is dire. The difficult correction of the last four months has shaken out all but the strongest holders, a perfect set-up for advances to new all-time highs in 2012.

Gold Bullion Coin Sales Soar By 94% In January As Confidence In The Dollar Crumbles

According to the latest production figures from the U.S. Mint, January sales of American Gold Eagle bullion coins soared by 93.8% over the previous month.

A total of 127,000 ounces were sold in January compared to 65,500 ounces in December 2011.  The surge in demand for gold bullion coins is now at the highest level since January 2011 when 133,500 ounces were sold.

Investors are taking opportunity of the bargain price of gold which remains below last year’s high.  After hitting a London PM Fix price of $1,895 on September 6, 2011, gold sold off by 19.2% to a closing low of $1,531.00 on December 29, 2011.

Since the beginning of the year, the price of gold has steadily advanced.  The closing London PM Fix price of $1,744.00 on January 31st represents a gain of $213 per ounce for the month, up 13.9% from the 2011 year end price.  The price of silver has also advanced strongly in 2012 with a gain of 26.8% from last year’s low amid record breaking demand for the American Silver Eagle bullion coins.

Sales of the American Gold Eagle bullion coins hit an all time record in 2009 when 1,435,000 ounces were sold.  A summary of annual gold bullion sales since 2000 is shown below.

Total yearly gold bullion coin sales from January 1, 2000 to January 31, 2012 are shown below.

Gold Bullion U.S. Mint Sales By Year
Year Total Ounces Sold
2000 164,500
2001 325,000
2002 315,000
2003 484,500
2004 536,000
2005 449,000
2006 261,000
2007 198,500
2008 860,500
2009 1,435,000
2010 1,220,500
2011 1,000,000
2012 127,000
7,376,500
Note: 2012 total through January 31, 2012

The huge demand during 2009 for gold bullion coins came in the wake of the 2008 financial system meltdown as investors sought a safe haven from paper assets.  Here we are four years later and the financial system is more fragile than ever with insolvent banks  and governments being propped up by central banks that are printing money on a scale previously unimaginable.

Although I have been a precious metals investor for many years (more sometimes than I care to think about), many of the people I deal with on a personal  and professional level seemed to be totally confident holding only paper assets, even after the financial system came very close to a total collapse in 2008.

That confidence now seems  to be slowly but persistently eroding and I am seeing many people enter the precious metals market for the first time.  It is not an “all in” seismic shift but rather a thoughtful and fundamental portfolio reallocation based on the growing realization that paper dollars are being constantly debased.

A one time bout of money printing by the Federal Reserve to “save the system” can perhaps be quickly forgotten, but a persistent and deliberate effort to debase the currency is another matter.  The growing realization that the Federal Reserve is deliberately destroying the integrity of the dollar will be the basis for continual future demand for the only real money left – gold.

The growing movement to reallocate wealth into gold is still in its infancy which implies a future gold value many thousands of dollars higher than today’s price.

There’s No Reason Gold Stocks Should Be So Cheap – Newmont Mining On The Bargain Rack

Over the past five years, gold bullion has dramatically outperformed the average gold stock.  Reasons why bullion has outperformed gold stocks include an investor preference for physical gold and the inability of gold miners to produce earnings gains commensurate with the increase in the price of gold.

The end result of investor aversion to gold stocks has resulted in many quality gold stocks, such as Newmont Mining (NEM), winding up on the bargain rack.  Newmont Mining is one of the world’s largest gold producers that has positioned itself for profitable growth after restructuring its operations.  Newmont Mining management is forecasting a 35% increase in gold production to 7 million ounces annually over the next six years.

Revenue growth at Newmont has grown by 10% annually over the past 10 years.  Earnings per share increased from $.45 per share in 2002 to $4.68 per share in 2010.  For the year ending December 31, 2010, gross margins hit a record 61%, cash holdings increased to $4.1 billion and revenues climbed by 23% to $9.5 billion.  Newmont Mining has a dividend yield of 2.3% with a very low payout ratio of 18% and is committed to increasing the dividend in line with the increase in the price of gold.  Newmont’s total proven and probably gold reserves of 93.5 million ounces are valued at only $285 per share.

Newmont Mining - courtesy yahoo finance


In this week’s Barron’s Roundtable, analyst Fred Hickey talks about Newmont Mining and why he is bullish on gold.

Hickey: Newmont Mining [NEM], which I recommended last year, outperformed. [The stock rose 5.5% through Dec. 30.] The driver is gross margin expansion. Gold prices are up by a factor of six through this bull market, yet costs have roughly doubled. The company has had tremendous cash flow, leading to dividend increases. Newmont has tied its dividend policy to the gold price. If the price rises, you are guaranteed more dividends. The money won’t be wasted on bad acquisitions. In 2008 Newmont earned under $2 a share. It could earn $4.82 for 2011, and $5.96 in 2012. There’s no reason these stocks should be so cheap.

As Felix has said, owning physical gold is important. In addition, you can own gold through exchange-traded funds, such as the GLD [ SPDR Gold Shares]. They are audited. The U.S. government’s gold holdings haven’t been independently audited in decades. The GLD charges fees of 0.40% of assets. The IAU, or iShares Gold Trust, charges only 0.25% of assets. It trades for about a hundredth of the price of gold, so it is selling for $15.76 a share. It has been around since 2005 and has $9 billion in assets and 171 tons of gold. It stores its gold in vaults around the world. Last year I recommended stocks. This year I like the GDX, or Market Vectors Gold Miners ETF. It gives you diversification with 31 names, including a few silver stocks. Barrick Gold [ABX], Newmont and Goldcorp [GG] account for 41% of assets. At some point gold stocks will outperform bullion.

Newmont is currently selling at a steep discount to the underlying value of its gold reserves.  As the price of gold continues to rise, the stock will eventually reflect the fundamentals and could easily double from current levels.

Gold Bullion Coin Sales Jump 9% In December, But Decline 18% For The Year

Demand for physical gold increased in December as buyers took advantage of a recent pullback in gold prices.

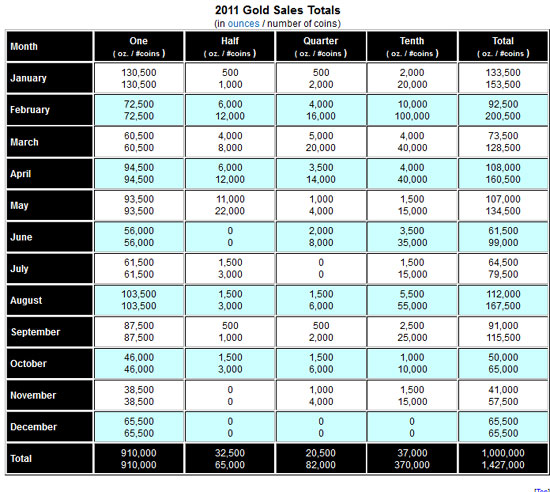
According to production figures from the U.S. Mint, sales of American Gold Eagle bullion coins in December totaled 65,500 ounces, an increase of 9.2% from December 2010.  Total sales of gold bullion coins for 2011 declined by 18% from the prior year.  For all of 2011, a total of 1,000,000 ounces were sold compared to previous year sales of 1,220,500 ounces.

The sales figures cited above do not include gold numismatic coins sold by the U.S. Mint.  Collector versions of gold coins such as the American Buffalo Gold Proof Coin can be purchased directly by the public from the U.S. Mint.

The American Gold Eagle bullion coins cannot be directly purchased by the public from the U.S. Mint.  Instead, a network of authorized purchasers (AP’s) buys the coins in bulk from the Mint at a fixed markup.  The AP’s in turn resell them to secondary retailers for public sale.  The AP distribution system established by the U.S. Mint was determined to be the most efficient method for selling gold bullion coins to the public at competitive prices.

Although sales of gold bullion coins increased during August and September when gold was soaring to all time highs, the largest  monthly sales of gold bullion coins occurred in January when gold was trading in the $1,350 range (please see chart below for monthly sales figures).

U.S. Mint Gold Bullion Sales By Month


2011 marks the third year in a row of reduced purchases of gold bullion coins but this is not indicative of an overall reduction in investment gold demand.  Competing investments such as gold trust ETFs may be responsible for a large part of reduced demand for physical gold.

Besides much lower transaction costs, investors in gold ETFs or other paper gold products do not have to worry about security and storage costs.  Since their launch in 2005, investors have poured billions of dollars into gold trust ETFs.  For example, the SPDR Gold Shares Trust (GLD) and the iShares Gold Trust (IAU) now hold gold bullion valued at over $82 billion.  By contrast, the approximate value of all American Eagle Gold bullion coins purchased last year amounts to only $1.6 billion.

The all time record sales of American Eagle gold bullion coins occurred in 2009 when 1,435,000 ounces were sold.

Gold Bullion U.S. Mint Sales Since 2000
Year Total Ounces Sold
2000 164,500
2001 325,000
2002 315,000
2003 484,500
2004 536,000
2005 449,000
2006 261,000
2007 198,500
2008 860,500
2009 1,435,000
2010 1,220,500
2011 1,000,000
Total 7,249,500


Will gold bullion sales continue to decline?  The recent implosion of MF Global along with unrestrained money printing by central banks should provoke some clear headed thinking by investors.  Customers of MF Global who thought they had warehouse receipts for physical gold and silver were shocked to find that the bankruptcy trustee put all assets into a single pool to cover  claims of all customers who have lost billions of dollars.

Paper assets can be vaporized in an instant, even those that are allegedly backed by physical assets such as gold and silver.  A question well worth pondering is “Could what happened at MF Global also happen to investors in the gold trust ETFs”?