April 25, 2024

Investor Gold Demand Hits All Time Record – China and India Grab 61% Of Total Gold Mine Production

Investor demand for gold during 2011 hit an all time high, fueled by soaring demand in China and India.  Total gold demand by China and India during 2011 amounted to a staggering 61% of all gold mine production last year.

The 2011 Gold Demand Trends report issued by the World Gold Council show a huge increase in gold demand and a small increase in global gold mine production.  This continues a trend that has been in place since 2001.  Despite an almost 600% increase in the price of gold since 2001, global gold mine production has increased by only 7.7%.

Typically, a large increase in price will bring forth additional supplies as producers rush to take advantage of higher prices.   This has not happened with gold due to the depletion of existing gold reserves and the inability of miners to discover and develop new gold deposits.  The continuing increase in gold demand and the lack of new supply will eventually result in gold prices higher than most people can imagine today.

Highlights of the Gold Demand Trends report are summarized below.

  1. For the first time ever, on a dollar basis, gold demand hit all time record highs at $205.5 billion, representing 4,067.1 tonnes of gold.
  2. Investor demand for gold hit all time record of 1,640.7 tonnes, up 5% from the previous year.
  3. Demand for gold by China soared 20% last year to 769.8 tonnes and demand by India, despite currency weakness, was 933.4 tonnes.  It is expected that China will become the largest gold market in the world during 2012 based on continued record setting demand.
  4. Global gold production increased by only 4% last year to 2,809.5 tonnes.  The combined gold demand of 1,703.2 tonnes by China and India consumed 60.6% of all new gold mine production.  It is projected that the supply of new gold will remained “restrained” for the foreseeable future.
  5. The desire to protect wealth accounted for surging gold demand in Europe as the European Central Bank engages in a massive money printing campaign to prop up the insolvent banking system.
  6. Central banks continued to buy gold during 2011, increasing total purchases to 440 tonnes, up by 77 tonnes from last year.
  7. The amount of gold available to meet demand is being restrained not only by low mine production but also by reduced supplies of gold from recycling.   Despite a 28% increase in gold prices last year, the supply of recycled gold declined by 2% to 1,611.9 tonnes.  According to the Gold Council, this implies that “market supplies are drying up and that consumers may be holding on to their gold in the expectation of higher prices.”
  8. Investors are showing a strong preference for physical gold as seen by the investment flows into bar and coin compared to ETF demand.   Demand for gold bar and coin during 2011 totaled 1,486.7 tonnes compared to ETF demand of only 154.0 tonnes.
  9. Gold demand by ETFs increased in the 2011 fourth quarter over the comparable period last year, but total demand during 2011 of 154.0 tonnes was far below ETF gold demand of 367.7 tonnes during 2010.

The Gold Council bullishly notes that the gold market is unique in that it is driven by a “diverse set of factors” and multiple sources of demand.
Lowering Gold Stock Portfolio Risk Through Diversification

There are numerous investment strategies available to capitalize on the gold bull market.  Gold investors have the option of investing in gold bullion, gold coins, gold ETFs, gold mutual funds and individual gold mining stocks.

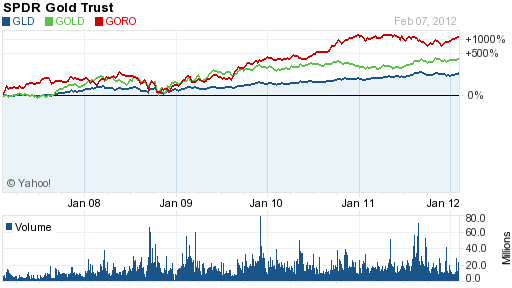
Although many gold investors prefer to exclusively hold physical gold, diversifying into selected gold stocks can dramatically increase total returns.  Although gold stocks as a group have recently underperformed bullion, selected gold stocks have outperformed gold bullion.

Well managed gold mining companies with large ore reserves and increasing mine production have provided investment returns far in excess of the gain in gold bullion as seen below with the examples of Randgold Resources (GOLD) and Gold Resource Corp (GORO).  Both of these gold mining companies have vastly outperformed gold bullion when compared to the SPDR Gold Trust (GLD) which tracks the price of gold bullion.

GORO, GOLD vs GLD - Courtesy yahoo.com

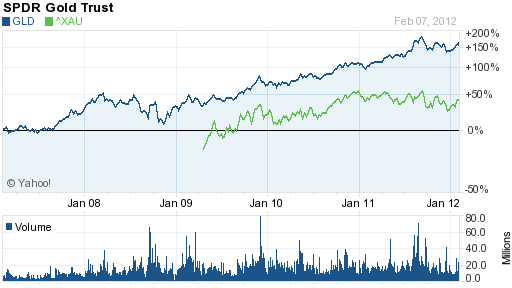
Selecting the gold stock that will outperform bullion is difficult, however, as seen by the lagging performance of the PHLX Gold/Silver Sector (XAU) when compared to the GLD.  The XAU Gold/Silver Sector is a broad based index of sixteen large precious metal mining companies.  The GLD has outperformed the XAU by three times since 2009.

GLD vs XAU - courtesy yahoo.com


As with any stock portfolio, diversification is required into order to avoid the risk of under performance.  An example of the risk of holding a gold portfolio with only a small number of stocks was seen today when the price of Nevsun Resources (NSU) collapsed by almost 31% after the company unexpectedly announced that gold production will plunge by nearly half in 2012 due to a reduction in estimated gold reserves.

Since selecting individual gold stocks can be a daunting task for investors, a better alternative would be to invest in an actively managed gold stock mutual fund with a proven record of superior investment returns.  Past performance has shown that an actively managed gold stock mutual fund has outperformed passively managed gold index funds.

One gold fund that should top the list for investors to consider is the Tocqueville Gold Fund (TGLDX), run by legendary gold investor John Hathaway.  The Tocqueville Gold Fund has a remarkable average annual return over the past ten years of 23.3%, almost double the gain in the Philadelphia Gold/Silver Index.

courtesy yahoo.com

Although gold bullion has outperformed gold stocks since 2008, Mr. Hathaway’s outlook for gold remains extremely bullish and he expects that as gold continues to increase in price, gold stocks should once again outperform the returns of gold bullion.  In his latest Investment Update, here is what Mr. Hathaway had to say.

Gold and gold stocks appear to be bottoming in the wake of a four month correction which began in mid -August when the metal peaked at $1900/oz. Bearish sentiment is at extremes not seen in many years. This and a number of other indicators, such as stocks that have been hit by negative sentiment, the downtrend in gold prices since August, and tax loss selling, support our view that a rally lies ahead. This very bullish market set-up, in our opinion, mirrors the extraordinary investment opportunity of the despondent year end in 2007. Even though gold prices have been declining for several months, they finished the year with substantial gains. This suggests that the value represented by gold mining equities held in our portfolio could be extraordinary.

Disarray in Europe is, in our opinion, a slow motion version of the global market meltdown in 2007. It appears to us that the U.S. Fed is once again acting as the lender of last resort to European central banks in their efforts to save the euro. As in 2007, U.S. sovereign credit will be substituted for failing credits, in this case, peripheral European states. The fig leaf to justify such action on the Fed’s part is sado-fiscalism, or extreme austerity packages administered by technocrats. Tough restraints on profligate public spending, which has become a way of life in all Western democracies, will not go down easily. These measures are deflationary and will be ultimately met by howls of protests from mobs demanding renewed money printing and deficit spending. In our opinion, the fundamentals for gold are stronger than ever because the outlook for paper currencies is dire. The difficult correction of the last four months has shaken out all but the strongest holders, a perfect set-up for advances to new all-time highs in 2012.

Platinum To Gold Ratio Plunges – Is This A Buy Signal Or A New Metric?

Platinum is one of the rarest earth elements with the vast majority of deposits found in only one place on earth.  Annual platinum production is only 30 tonnes per year compared to approximately 2,800 tonnes for gold and 23,000 tonnes for silver.

Roughly 80% of annual platinum production comes from only three mines in South Africa.  Siberia and other geographically scattered locations provide the balance of annual platinum production.

Investment demand for platinum constitutes only 10% of annual demand .  Since 90% of platinum demand comes from jewelry and industrial users, the price of platinum can be very volatile.  During an economic downturn,car sales plunge and jewelry is a very discretionary purchase.  During the 2008 financial meltdown, platinum plunged by nearly two thirds of its value compared to a drop of only one third in the price of gold.


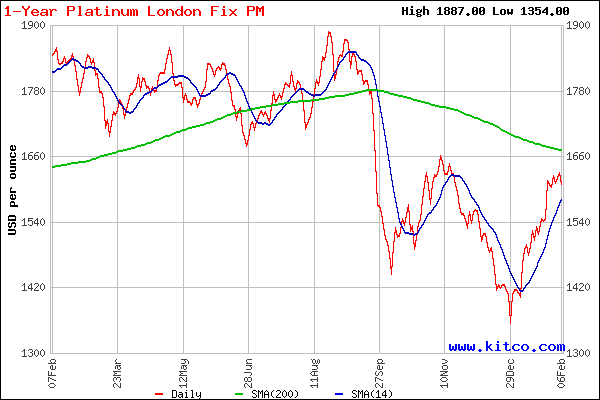
Platinum - courtesy kitco.com

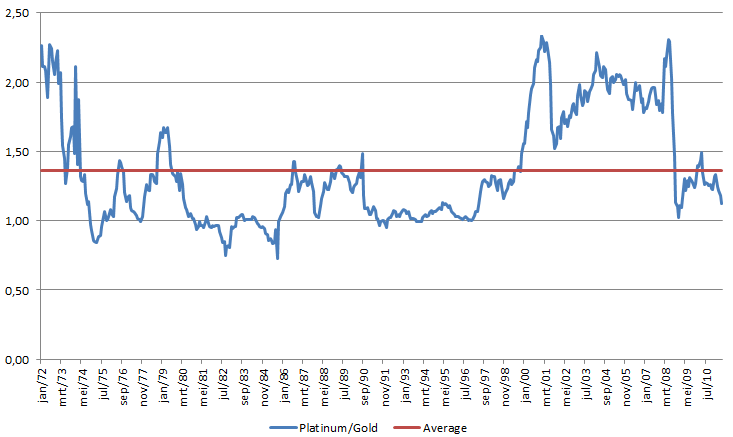
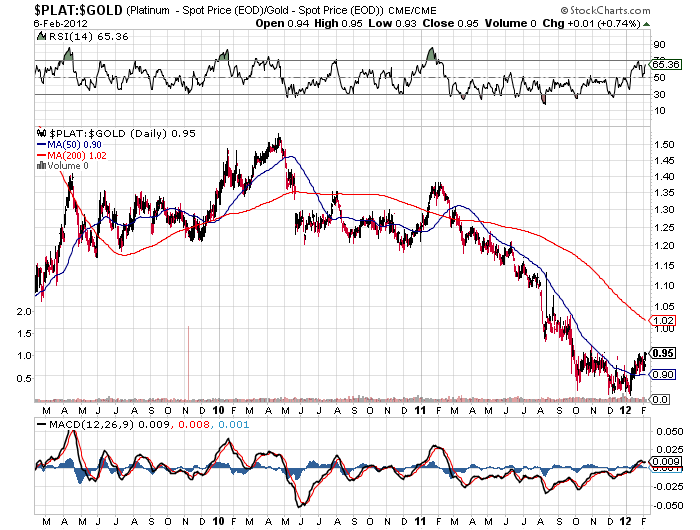
The ongoing economic turmoil in Europe has contributed to a large drop in the price of platinum.   Last year, platinum declined from $1,887 in August to $1,354 at 2011 year end, a drop of $533 per ounce.  Although platinum has recovered to $1,609, it is considerably undervalued  when viewed through the lens of the platinum to gold ratio.  A platinum to gold ratio below 1.0 is historically a signal that platinum is selling at a bargain price.  The platinum to gold ratio is currently at .95, a level not seen since 1986.


Long term ratio - courtesy http://profitimes.com


Platinum to gold ratio - courtesy stockcharts.com

Has the long term historical significance of the platinum to gold ratio lost its relevance?  If the world plunges into a deflationary depression, platinum may wind up becoming a much greater bargain at a later date.  The more likely scenario is that a new pricing metric is not being established and that the multi-decade low in the platinum to gold ratio is a major buy signal for platinum.

The central banks of the world have made it abundantly clear that they will print and inflate their way out of the debt crisis.  Ownership of a precious metal such as platinum is one method of maintaining a store of value against depreciating currencies.

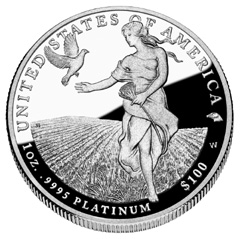
Numismatic versions of the platinum coin can be purchased by investors directly from the U.S. Mint.  The 2011 Proof Platinum Eagle has been available since May 26, 2011 with a maximum mintage of 15,000 pieces.  The current price to purchase the 2011 American Eagle one ounce platinum proof coin from the U.S. Mint is $1,892.00 with no order limit.  No sales tax is charged on the purchase and a credit card can be used to pay for the coins.

According to coinupdate.com, the United State Mint may bring back the American Platinum Eagle bullion coins.  The U.S. Mint has not minted the bullion versions of the platinum coin since 2008.  Production of the American Platinum Eagle is not required by law, as is the case for the American gold and silver eagles.  Production of the platinum coins are at the discretion of the Secretary of the Treasury.  The 2008 and earlier bullion version of the one ounce American Platinum Eagle coins are available from coin dealers and are currently priced at around $1,860 each.

Gold Bullion Coin Sales Soar By 94% In January As Confidence In The Dollar Crumbles

According to the latest production figures from the U.S. Mint, January sales of American Gold Eagle bullion coins soared by 93.8% over the previous month.

A total of 127,000 ounces were sold in January compared to 65,500 ounces in December 2011.  The surge in demand for gold bullion coins is now at the highest level since January 2011 when 133,500 ounces were sold.

Investors are taking opportunity of the bargain price of gold which remains below last year’s high.  After hitting a London PM Fix price of $1,895 on September 6, 2011, gold sold off by 19.2% to a closing low of $1,531.00 on December 29, 2011.

Since the beginning of the year, the price of gold has steadily advanced.  The closing London PM Fix price of $1,744.00 on January 31st represents a gain of $213 per ounce for the month, up 13.9% from the 2011 year end price.  The price of silver has also advanced strongly in 2012 with a gain of 26.8% from last year’s low amid record breaking demand for the American Silver Eagle bullion coins.

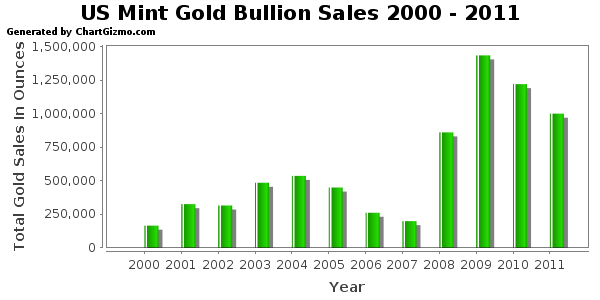
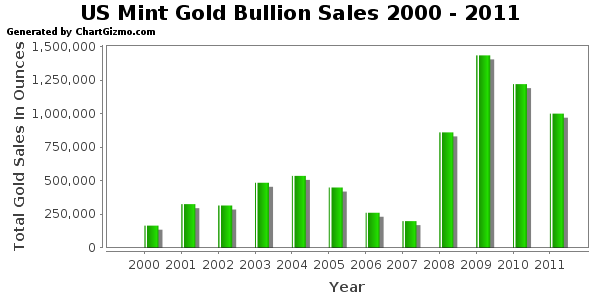
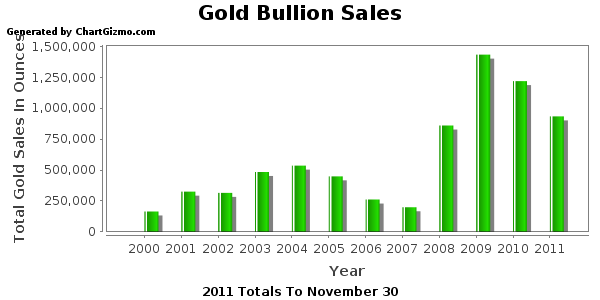
Sales of the American Gold Eagle bullion coins hit an all time record in 2009 when 1,435,000 ounces were sold.  A summary of annual gold bullion sales since 2000 is shown below.

Total yearly gold bullion coin sales from January 1, 2000 to January 31, 2012 are shown below.

Gold Bullion U.S. Mint Sales By Year
Year Total Ounces Sold
2000 164,500
2001 325,000
2002 315,000
2003 484,500
2004 536,000
2005 449,000
2006 261,000
2007 198,500
2008 860,500
2009 1,435,000
2010 1,220,500
2011 1,000,000
2012 127,000
7,376,500
Note: 2012 total through January 31, 2012

The huge demand during 2009 for gold bullion coins came in the wake of the 2008 financial system meltdown as investors sought a safe haven from paper assets.  Here we are four years later and the financial system is more fragile than ever with insolvent banks  and governments being propped up by central banks that are printing money on a scale previously unimaginable.

Although I have been a precious metals investor for many years (more sometimes than I care to think about), many of the people I deal with on a personal  and professional level seemed to be totally confident holding only paper assets, even after the financial system came very close to a total collapse in 2008.

That confidence now seems  to be slowly but persistently eroding and I am seeing many people enter the precious metals market for the first time.  It is not an “all in” seismic shift but rather a thoughtful and fundamental portfolio reallocation based on the growing realization that paper dollars are being constantly debased.

A one time bout of money printing by the Federal Reserve to “save the system” can perhaps be quickly forgotten, but a persistent and deliberate effort to debase the currency is another matter.  The growing realization that the Federal Reserve is deliberately destroying the integrity of the dollar will be the basis for continual future demand for the only real money left – gold.

The growing movement to reallocate wealth into gold is still in its infancy which implies a future gold value many thousands of dollars higher than today’s price.

Silver Prices Will Soar To Record Levels In 2012 – “Record Breaking” Demand For Silver Bullion

Corrections are the norm in any long term bull market and silver is no exception.  The correction that began in May of 2011 and ended in December has set the stage for what will be an explosive move up during 2012 and beyond.

Since hitting the 2011 low of $26.16 on December 29, 2011, silver has climbed steadily, closing on Monday at $33.18, up 17.4% on the year and up 26.8% from last year’s low.  Today’s price should be viewed by long term silver investors as an exceptional opportunity for capital appreciation and wealth preservation.

The underlying fundamentals that will drive silver higher this year include unprecedented demand for both physical silver and silver ETFs, virtually limitless money printing by central banks worldwide to prevent a debt implosion and a growing realization by the public that the Federal Reserve is deliberating and systematically debasing the U.S. currency.

Sales of American Silver Eagle bullion coins by the US Mint may hit an all time record in January.  As of January 30th, the Mint has already sold 6,082,000 bullion coins.  The previous all time record for sales occurred in January 2011 when sales were 6,422,000 ounces.

Last January was atypical in that monthly sales of the Silver Eagles coins tapered off to about 3 million coins per month thereafter and only in September 2011 did sales exceed 4 million coins.  In the three previous years from 2008 to 2010, January sales volume established the baseline of monthly sales for the rest of the year.

For example, in 2009, January sales of the Silver Eagle came in at 1,900,000 coins and average sales for the remaining 11 months averaged 2.44 million coins.  If 2012 follows the pattern of 2008 through 2010, sales of the American Silver Eagle Bullion coins could average 6 million coins per month.  Average silver bullion coins sales of 6 million per month during 2012 would result in a record shattering purchase of 72 million coins, up 80% from last year’s record of 39,868,500 ounces.

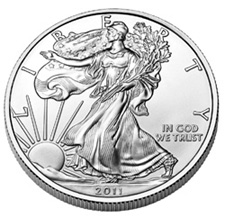
American Silver Eagle Bullion Coins
YEAR OUNCES SOLD
2000 9,133,000
2001 8,827,500
2002 10,475,500
2003 9,153,500
2004 9,617,000
2005 8,405,000
2006 10,021,000
2007 9,887,000
2008 19,583,500
2009 28,766,500
2010 34,662,500
2011 39,868,500

The vast majority of holders in the iShares Silver Trust (SLV)  are solidly committed to owning silver and refused to sell positions during the sharp correction of 2011.  When silver hit a high of $48.70 (London PM Fix Price) on April 28th, the iShares Silver Trust held 11,053 tonnes of silver.  After a rapid and sharp correction to $32.50 on May 12th, the SLV silver holdings declined modestly to 10,516 tonnes as short term speculators and over-leveraged investors sold out at the bottom.

On December 29, 2011, as silver hit its low for the year at $26.16, the iShare Silver Trust held 9,605 tonnes.  A correction from the price high on April 28th to the low on December 29th took silver down by 46.3% but holdings of the iShares Silver Trust declined by a very modest 13.1%.  The vast majority of long term silver investors did not sell out during the correction in expectations of sharply higher prices in the future.

Silver - courtesy kitco.com


According to Reuters, precious metal dealers are reporting record breaking silver sales and “dollar sales of silver and gold products reached parity in January for the first time in its history – even though bullion costs 50 times more.”  In addition, dealers are selling record number of the Silver Eagle “Monster Boxes” which hold 500 one-ounce coins.

The European Central Bank, which in December lent a massive €489 billion of freshly printed euros to a collapsing banking system may have to provide double that amount (for a total of $1.27 trillion dollars) during the next round of emergency lending scheduled for February.  According to the Financial Times:

European banks are preparing to tap the European Central Bank’s emergency funding scheme for up to twice as much as the ECB supplied in its debut €489bn auction last month, providing further evidence of the sector’s liquidity squeeze.

Several of the eurozone’s biggest banks have told the Financial Times that they could well double or triple their request for funds in the ECB’s three-year money auction on February 29.

The gold to silver ratio, which on a long term historical basis, has been in the range of 16 is now at the bargain ratio of 52, suggesting strongly that silver could outperform gold on a relative value basis.  At a gold to silver ratio of 20, silver would currently be selling at $87 per ounce.

The Sprott Physical Silver Trust (PSLV) just completed a follow on offering of Trust Units in which investors snapped up additional trust units representing about 11 million ounces of silver.

Silver’s rapid price gains during January is a harbinger of what could turn out to be a very good year for silver investors.

The Gold Bubble Myth – Investors Remain Underinvested In Gold

The chronic myth that gold is in a bubble continues to persist, perhaps driven by the fact that gold has risen for the past 11 years.

The mainstream press has float stories year after year that gold was dangerously overpriced and unsuitable for most investors.  This gold bubble mindset, promulgated by “analysts” who have never owned gold has succeeded in keeping the vast majority of investors out of the best performing asset class of the past decade.

Despite every effort by the Federal Reserve to debase the value of the U.S. dollar, an uninformed and gullible public seems content to hold paper dollars which continue to decline in purchasing power.   Worse yet, in an effort to forestall insolvency and reduce the value of debt obligations that are mathematically impossible to repay, the Fed has explicitly adopted a dollar debasement policy.

While the smart money has been moving into gold, the vast majority of investors are under invested in precious metals.  The relatively low demand for gold can be seen from the third quarter gold demand and supply statistics from the World Gold Council.

Total gold demand has remained relatively stable for the past four years at approximately 4,000 tonnes.  Various categories of gold demand such as bar and coin and ETF rose while jewellery demand actually dropped and technology demand remained relatively unchanged.  Total global gold demand of 4,000 tonnes is valued at only about $230 billion.  By comparison the market value of Apple is $415 billion, the market value of IBM is $222 billion and the market value of Microsoft is $248 billion.

Meanwhile, monetary authorities world wide are printing money to prop up governments that have reached the limits of taxation and borrowing abilities.  This, along with the low level of demand for gold tells us that we are not even close to the ultimate highs that will be seen in the gold market.

More on this topic:

Gold Bull Market Could Last Another 20 Year With $12,000 Price Target

Why There Is No Upside Limit For Gold and Silver Prices

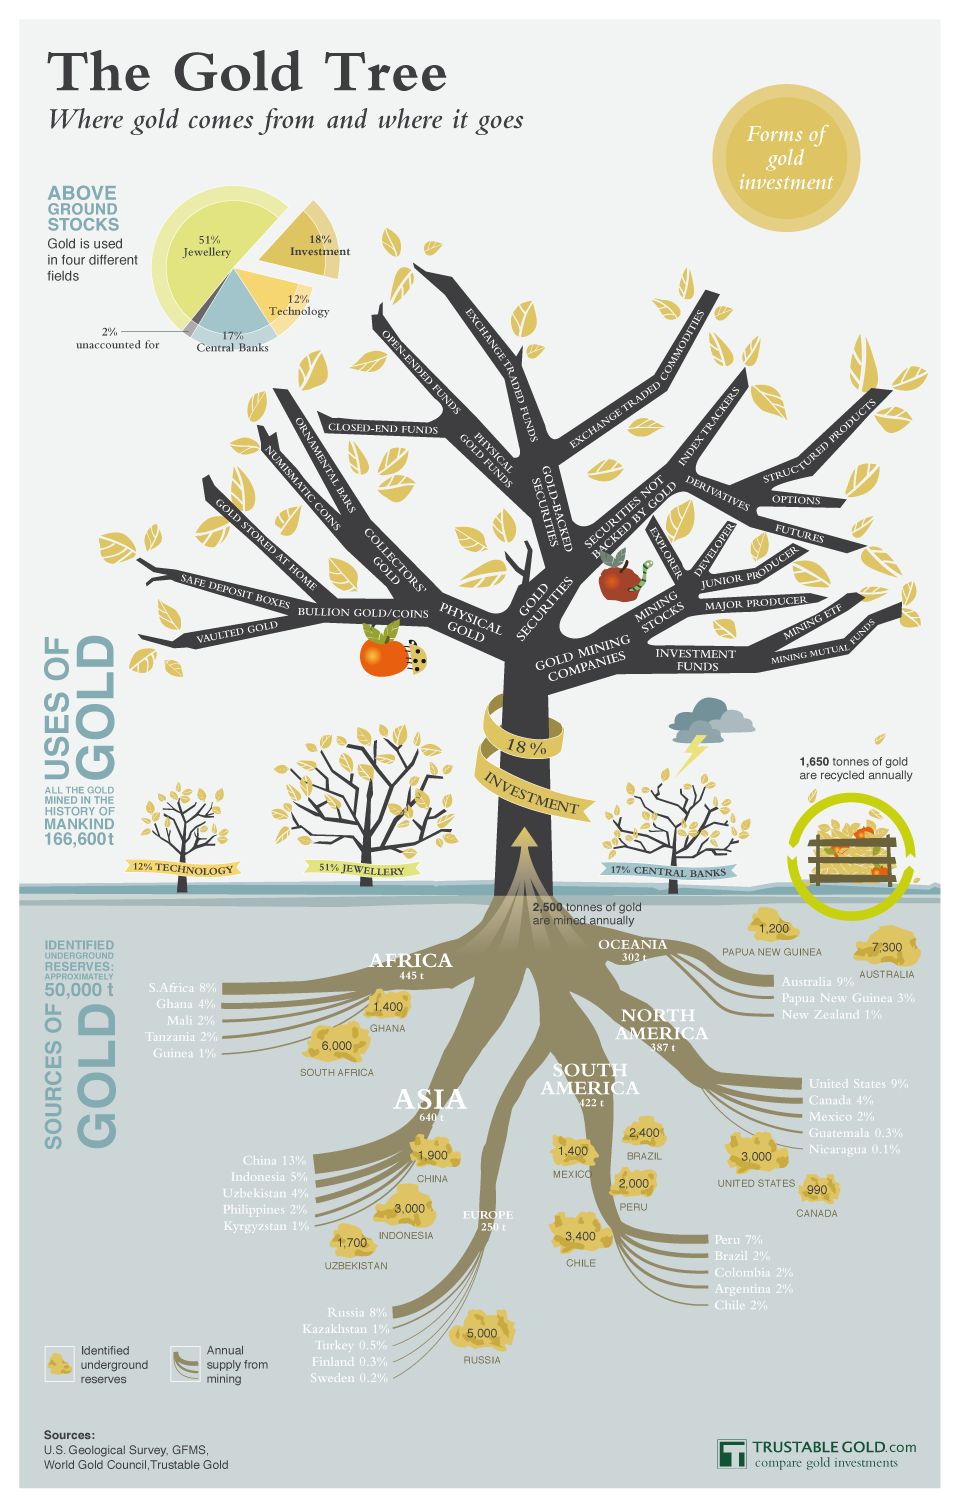
Sources and Demand For Gold

A nifty graphic detailing the sources and demand for gold can be seen below from Trustable Gold, which provides investors with information on gold investment opportunities.


Courtesy - trustablegold.com

Demand For Silver Bullion Coins Hits Record High On Bargain Prices

Sales of American Silver Eagle bullion coins hit an all time record high during 2011 according to production figures from the U.S. Mint.

Sales of the Silver Eagle bullion coins increased by 13.3% in December to 2,009,000 compared to last year’s sales of 1,772,000.  For all of 2011, total Silver Eagle sales came in at an all time record high of 39,868,500 ounces, up 15.0% from the prior year’s total of 34,662,500 ounces.

In addition to the silver bullion coins, the U.S. Mint also produces proof and uncirculated American Eagle silver coins which can be purchased by the public directly from the U.S. Mint.  Commencing in 2010, the U.S. Mint began producing the America the Beautiful Silver Bullion 5oz coin.  During 2011, the U.S. Mint sold 397,700 of the 5oz coins, which represents almost another 2 million ounces of physical silver demand during 2011.

The U.S. Mint does not sell the American Silver Eagle bullion coins directly to the public.  The bullion coins are purchased from the U.S. Mint by a network of authorized purchasers who in turn resell them to secondary retailers for public sale.

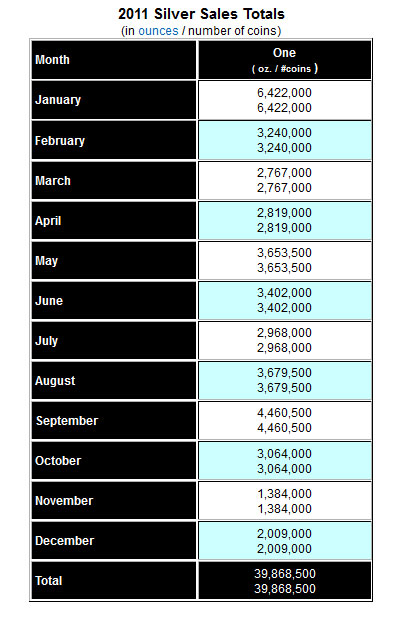
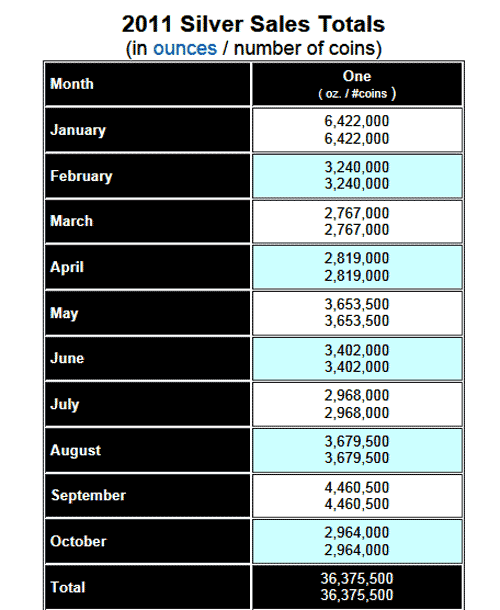
Monthly sales of the Silver Eagle bullion coins during 2011 are shown below.

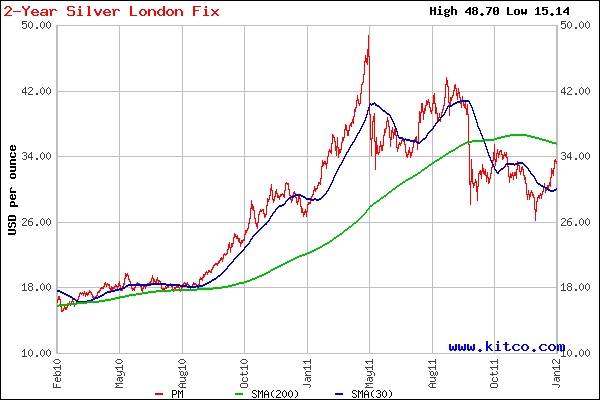
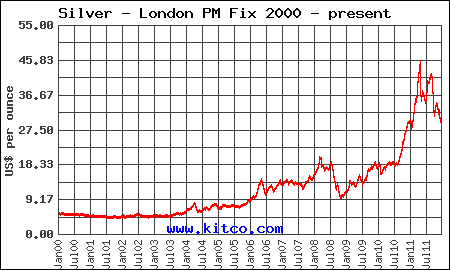
Silver had a volatile year during 2011, reaching a high of $48.70 in April and then dropping to a low of $32.50 in May after the COMEX repeatedly raised margin requirements on silver futures (see How the COMEX Crashed The Silver Market).  After recovering to $43.49 in August, silver declined to end the year at $28.18, off 8.1% for the year.

Despite the volatility in silver prices during 2011, investor demand for physical silver remained exceptionally strong.  After the significant price pullback from the April high, many analysts and armchair commentators who never owned an ounce of silver in their life were predicting a plunge in demand for silver.  The exact opposite occurred as long term investors took advantage of what is another historic buying opportunity comparable to 2008.

The case for buying silver remains rock solid and patient long term investors have been well rewarded.  As opposed to buyers of paper silver products such as the iShares Silver Trust ETF (SLV), holders of physical silver are invested in precious metals as part of a long term wealth preservation and appreciation strategy.  While speculators in paper silver products trade in and out, usually winding up with losses from my observations, long term holders of physical silver have seen the value of their holdings rise significantly.

Silver - courtesy kitco.com

As central banks of the world continue to print money at an accelerated rate, 2012 should be a year of strong gains for both gold and silver.  A steady plan of silver and gold bullion accumulation remains a no-brainer decision.  Since 2008, sales of silver eagle bullion coins have soared.  Last year, extremely heavy demand for silver resulted in periodic product allocations by the U.S. Mint.

In an excellent article by Steve Angelo, it was shown that massive physical demand for both the American Silver Eagles and Canadian Maple Leaf coins resulted in official coin sales surpassing the total silver production of both the United States and Canada.

Expect demand for silver bullion products during 2012 to surpass the record year of 2011.  Shown below are the yearly sales figures since 2000 for the American Silver Eagle bullion coins.

American Silver Eagle Bullion Coins
YEAR OUNCES SOLD
2000 9,133,000
2001 8,827,500
2002 10,475,500
2003 9,153,500
2004 9,617,000
2005 8,405,000
2006 10,021,000
2007 9,887,000
2008 19,583,500
2009 28,766,500
2010 34,662,500
2011 39,868,500


Gold Bullion Coin Sales Jump 9% In December, But Decline 18% For The Year

Demand for physical gold increased in December as buyers took advantage of a recent pullback in gold prices.

According to production figures from the U.S. Mint, sales of American Gold Eagle bullion coins in December totaled 65,500 ounces, an increase of 9.2% from December 2010.  Total sales of gold bullion coins for 2011 declined by 18% from the prior year.  For all of 2011, a total of 1,000,000 ounces were sold compared to previous year sales of 1,220,500 ounces.

The sales figures cited above do not include gold numismatic coins sold by the U.S. Mint.  Collector versions of gold coins such as the American Buffalo Gold Proof Coin can be purchased directly by the public from the U.S. Mint.

The American Gold Eagle bullion coins cannot be directly purchased by the public from the U.S. Mint.  Instead, a network of authorized purchasers (AP’s) buys the coins in bulk from the Mint at a fixed markup.  The AP’s in turn resell them to secondary retailers for public sale.  The AP distribution system established by the U.S. Mint was determined to be the most efficient method for selling gold bullion coins to the public at competitive prices.

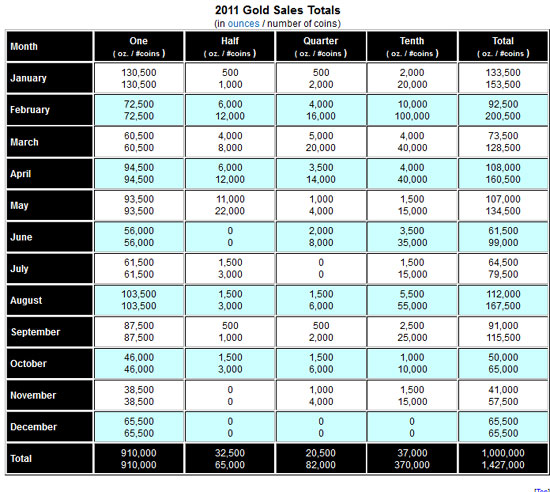
Although sales of gold bullion coins increased during August and September when gold was soaring to all time highs, the largest  monthly sales of gold bullion coins occurred in January when gold was trading in the $1,350 range (please see chart below for monthly sales figures).

U.S. Mint Gold Bullion Sales By Month


2011 marks the third year in a row of reduced purchases of gold bullion coins but this is not indicative of an overall reduction in investment gold demand.  Competing investments such as gold trust ETFs may be responsible for a large part of reduced demand for physical gold.

Besides much lower transaction costs, investors in gold ETFs or other paper gold products do not have to worry about security and storage costs.  Since their launch in 2005, investors have poured billions of dollars into gold trust ETFs.  For example, the SPDR Gold Shares Trust (GLD) and the iShares Gold Trust (IAU) now hold gold bullion valued at over $82 billion.  By contrast, the approximate value of all American Eagle Gold bullion coins purchased last year amounts to only $1.6 billion.

The all time record sales of American Eagle gold bullion coins occurred in 2009 when 1,435,000 ounces were sold.

Gold Bullion U.S. Mint Sales Since 2000
Year Total Ounces Sold
2000 164,500
2001 325,000
2002 315,000
2003 484,500
2004 536,000
2005 449,000
2006 261,000
2007 198,500
2008 860,500
2009 1,435,000
2010 1,220,500
2011 1,000,000
Total 7,249,500


Will gold bullion sales continue to decline?  The recent implosion of MF Global along with unrestrained money printing by central banks should provoke some clear headed thinking by investors.  Customers of MF Global who thought they had warehouse receipts for physical gold and silver were shocked to find that the bankruptcy trustee put all assets into a single pool to cover  claims of all customers who have lost billions of dollars.

Paper assets can be vaporized in an instant, even those that are allegedly backed by physical assets such as gold and silver.  A question well worth pondering is “Could what happened at MF Global also happen to investors in the gold trust ETFs”?


Gold Bullion Coin Sales Plunge 63% In November and 20% YTD – Have Americans Given Up On Gold?

Total sales of American Gold Eagle bullion coins plunged in November according to production figures from the U.S. Mint.

Total sales of gold U.S. Mint bullion coins declined by 63.4% in November from the previous year.  Sales of U.S. Mint gold bullion coins declined by 19.5% on a year to date basis through the end of November.  A total of 41,000 ounces were sold in November 2011 compared to sales of 112,000 ounces in November 2010.  Year to date sales through November totaled 934,500 ounces compared to the previous year to date totals of 1,160,500 ounces.

The reduction in the purchase of U.S. Mint gold bullion coins continues a trend of reduced sales since the record breaking year of 2009 when a total of 1,435,000 ounces were sold.  Total gold bullion sales  for 2011 will probably slip below one million ounces for the first time since 2009.  If sales decline in December by the same percentage amount as in November, total 2011 sales of gold bullion coins will come in at 956,500 ounces.

A summary of gold mint bullion coin sales since 2000 is shown below.

Gold Bullion Sales Since 2000

Gold Bullion U.S. Mint Sales Since 2000
Year Total Ounces Sold
2000 164,500
2001 325,000
2002 315,000
2003 484,500
2004 536,000
2005 449,000
2006 261,000
2007 198,500
2008 860,500
2009 1,435,000
2010 1,220,500
2011 934,500
Total 7,184,000

Why would gold bullion coin sales be plunging when gold has been steadily rising?  Have Americans given up on gold?  Let’s look at various trends in gold sales to get some perspective.

-Annual sales of gold bullion exceeded a half million ounces only once before 2008.  The financial crash of 2008 precipitated concerns about the integrity of both the banking system and the U.S. dollar, causing a huge increase in demand for physical gold.  Gold bullion sales exploded higher in 2008 and sales for 2011 remain far above levels seen prior to 2008 despite the recent drop in sales.

-Based on the current price of gold, the total value of all gold bullion purchased from the U.S. Mint since 2000 is $12.6 billion.  This amount represents only a fraction of the amount of investment dollars that have flowed into gold over the past decade.  In addition to purchasing physical gold, investors now have the option to purchase gold through gold trust ETFs.  The amount of money poured into the gold trust ETFs is many multitudes greater than the investment in physical gold bullion coins.  For example, since their inception in 2005, the combined gold holdings of the SPDR Gold Shares Trust (GLD) and the iShares Gold Trust (IAU) have grown to 47.2 million ounces valued at $82.5 billion.

-Gold ETFs have grown exponentially from their inception a short six years ago but the largest gold ETF, the SPDR Gold Shares Trust (GLD), has not been able to exceed its record gold holdings of 1,320.47 tonnes reached on June 29, 2010.  In addition, billionaire John Paulson recently liquidated a substantial portion of his GLD holdings, although much of the selling may have been forced due to severe losses in his hedge funds.

-Gold trader sentiment is either bullish or bearish, depending on who you talk to.

-Central banks, which have been increasing their purchases of gold since 2000, have sharply accelerated their purchases of gold bullion over the past several years.  Central banks from Asia and Latin America have accounted for most of the increased purchases.

-According to the World Gold Council, global gold investment demand increased by 33% in the 2011 third quarter compared to the prior year.  Investment demand for gold bars and coins increased by 29% and global gold holdings by gold trust ETFs increased by almost 78 tonnes.  Demand for gold increased notably during the third quarter in Europe and China.

While it is indisputable that global gold demand has increased, the appetite for gold by U.S. investors seems to be diminishing.  What do you think?


American Silver Eagle Bullion Sales Soar As Investors Buy At Bargain Prices

The US Mint’s latest monthly reports on the sale of American Silver Eagle bullion sales show that investor buying has hit all time record levels.

Total sales of the American Silver Eagle bullion coins in 2010 came in at a record high of 34,662,500.

With over two months remaining in 2011, sales of the American Silver Eagle have already surpassed the record level of 2010 with sales of 36,375,500 ounces.  If sales of the Silver Eagle for November and December match the levels of 2010, total sales for 2011 should total over 42 million ounces or more than 20% above the record breaking sales level of 2010.

A review of sales by month for 2011 indicate solid fundamental buying by silver investors.  Typically, buying of an asset will increase as prices go higher and decrease as prices decline.  This was not the case with the American Silver Eagles – despite a sharp sell off in May and September, monthly sales increased as investors took advantage of bargain prices.

Silver had a volatile year, selling at $30.67 per ounce at the beginning of the year and moving up to a high of $48.70 (as measured by the London PM Fix Price) on April 28th.  Silver closed yesterday at $33.47, up $2.80 or 9.1% on the year.

Based on strong fundamental demand for physical silver, expect silver prices to end the year considerably higher.