April 26, 2024

“Gold and Silver Heading Lower” – Classic Sign Of A Market Bottom

Yahoo Finance ran a story today entitled “Gold, Silver & Copper Are All Heading Lower.”  Nothing worth discussing about the specifics of the article – the real story here is that this a classic contrary headline seen at market bottoms, not tops.

What is the really smart money doing in the gold market as the mainstream press encourages John Q. Public to sell off his gold holdings?  Here’s a nice recap from The Economic Collapse:

When men like John Paulson and George Soros start pouring huge amounts of money into gold, it is time to start becoming alarmed about the state of the global financial system.

The amount of money that these men are investing in gold is staggering….

And the central banks of the world are certainly buying gold at an unprecedented rate as well.  According to the World Gold Council, the central banks of the world added 157.5 metric tons of gold last quarter.  That was the biggest move into gold by the central banks of the globe that we have seen in modern financial history.

But that might just be the beginning.

According to a recent Marketwatch article, there are persistent rumors that China has plans to buy thousands of metric tons of gold….

The gold bull market is far from over when two of the world’s most successful investors are increasing their gold holdings.  The price correction in gold since last summer has provided another excellent buying opportunity for long term investors.

More on this topic:

Why There Is No Upside Limit For Gold and Silver

Why Higher Inflation and $5,ooo Gold Are Inevitable

The Federal Reserve Can’t Produce Oil, Food or Jobs But They Will Continue To Produce Dollars

Ultimate Price of Gold Will Shock The World As Loss Of Global Confidence Leads To Economic Collapse

Gold Bull Market Could Last Another 20 Years With $12,000 Price Target
New Gold and Silver Baseball Commemorative Coins Highlight Lack Of Innovation By U.S. Mint

How Congress Stifles Innovative Coin Designs By U.S. Mint

Ever wonder why the U.S. Mint shows a lack of innovation in coin design compared to other world mints?  Here’s part of the reason as detailed by Mint News Blog:

Many coin related bills are introduced each year, but only a small number become law. In order for a bill to become law, it must be passed by both the House and Senate and then signed into law by the President. Under Congressional rules, two-thirds of each body must co-sponsor a bill before it is even put up to a vote, which is the hurdle that many bills cannot meet. Another rule limits the number of commemorative coin programs to only two per year.

The most recent bill to become law was the National Baseball Hall of Fame Commemorative Coin Act. The bill H.R. 2527 was introduced on July 14, 2011, passed in the House of Representatives on October 26, 2011, passed by the Senate on July 12, 2012, and signed by the President on August 3, 2012.

The program calls for the minting and issuance of up to 50,000 $5 gold coins, 400,000 silver dollars, and 750,000 clad half dollars in recognition and celebration of the National Baseball Hall of Fame. These coins will be issued only during the one-year period beginning on January 1, 2014.

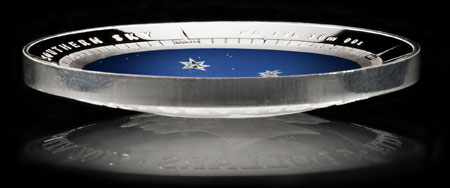
Mint New Blog goes on to discuss how the coin design will be unique with the reverse of the coin made convex and the obverse concave to enhance the resemblance to a baseball.  The coin may resemble a recently produced dome shaped coin issued by the Royal Australian Mint as shown below.

The commemorative baseball coin would represent the first innovation in coin design by the U.S. Mint since 2000 when the Library of Congress $10 coin was produced, which was the first and only US Mint bimetallic coin.  While the new baseball coin will certainly increase public interest in precious metal coins, Congress should grant the U.S. Mint more latitude to produce a wide variety of innovative coins without an onerous legislative process.

Two Masterpiece Gold and Silver Medals

Precious metal investors who have a deep appreciation for the artistry of gold and silver coins are likely to be blown away by the latest medals issued by the Royal British Mint.

As reported by World Mint News Blog, the Royal Mint has issued two magnificent gold and silver medals that showcase the skill and craftsmanship of mint engravers.  Both coins have extremely limited mintage with the gold medal issue limit set at only 25.  The purchase price of the gold medal is £23,500.00 or $36,843.  I would expect both of these low mintage medals to be priced substantially higher in the secondary market if they ever become available for sale.

The obverse of the medal depicts Arthur as a Warrior King defeating the Saxons as Merlin stands in the background. The battlefield is shown with mist and smoke rising into the air and the dragon flags planted by the cavalry symbolizing victory. The reverse depicts Arthur as a wounded and defeated King offering his sword Excalibur to his Knight Bedivere. In the background appear Arthur’s wife Guinevere embracing Lancelot and Arthur’s half sister Morgana holding her staff with a raven atop.

Both the gold and silver medals feature the same intricate design and are struck in high relief. Both are oversized to provide a large canvas for the work. The .999 silver coin has a weight of 250 grams (8.04 troy ounces) and diameter of 80 mm. The .999 gold coin has a weight of 313 grams (10.06 troy ounces) and diameter of 65 mm.

As might be expected, these are extremely limited in mintage and premium priced. The silver medal has an issue limit of 500 and is £695.00, and the gold medal has a limit of just 25 and is priced at £23,500.00. The product pages can be found here and here.

The U.S. Mint should pay attention to the artistry of coins produced by other world mints.  Imaginative new gold and silver coin designs by the U.S. Mint would not only be appreciated by numismatists but would probably broaden investor interest in standard gold and silver bullion coins.

Gold Bullion Coin Sales Plunge 50% In July, Silver Sales Off 20%

The latest sales figures from the U.S. Mint show that sales of both gold and silver bullion coins declined dramatically during July.  While sales of silver bullion coins have remained at historically high levels, sales of the gold bullion coins have been in a steep decline since 2009.
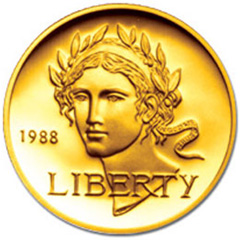
American Eagle Gold Bullion Coin Sales

Sales of the American Eagle Gold Bullion coins during July totaled 30,500 ounces, a 49.2% decline from June sales of 60,000 ounces.  Two previous months of the year had lower gold coin sales than July.  During February 21,000 ounces of gold bullion coins were sold and in April only 20,000 ounces were sold.   The year to date average monthly sales figures for gold bullion coins total 53,428 compared to a monthly average of 83,333 during 2011.

The all time yearly sales record for the American Eagle gold bullion coins was set during 2009 when it looked as if the entire U.S. banking system was about to collapse.  Sales in each subsequent year have been lower than 2009 despite the increase in the price of gold since then.  In 2009 gold closed the year at $1,087.50 per ounce, subsequently hit a high of $1,895 on September 5, 2011 and closed today at $1,615.90 in New York trading.  If sales during 2012 are annualized, total gold bullion coin sales will reach approximately 641,000 ounces, the lowest amount since 2007 when yearly sales came in at 198,500 ounces.

Listed below are yearly sales figures for the American Eagle gold bullion coins since 2000.  Sales for 2012 are through July 31st.

Gold Bullion U.S. Mint Sales By Year
Year Total Sales Oz.
2000 164,500
2001 325,000
2002 315,000
2003 484,500
2004 536,000
2005 449,000
2006 261,000
2007 198,500
2008 860,500
2009 1,435,000
2010 1,220,500
2011 1,000,000
2012 374,000
Total 7,623,500

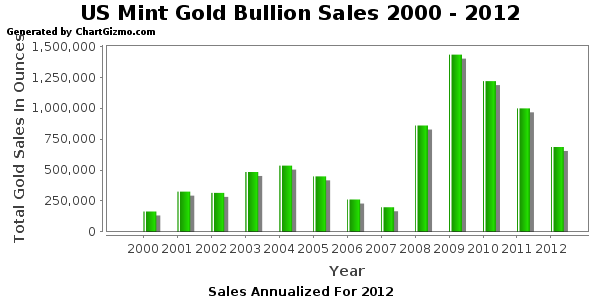
The graph below shows gold bullion coins sales since 2012, with sales annualized for 2012.

American Eagle Silver Bullion Coin Sales

According to the U.S. Mint, sales of the American Eagle silver bullion coins totaled 2,278,000 ounces during July, a decline of 20.3% from June’s total of 2,858,000.   The highest monthly sales of the silver bullion coins during 2012 was 6,107,000 ounces recorded in January followed by the lowest monthly sales of 1,490,000 ounces in February.  Average monthly sales of the silver bullion coins through July was 2,810,000.

The silver bullion coins have showed resilient demand despite the drop in silver prices since mid 2011.  Based on year to date sales figures, total sales of the silver bullion coins could approach 34 million ounces, not far below the record sales figure recorded in 2011 when almost 40 million ounces were sold.

Total annual sales by the U.S. Mint of the silver bullion coins since 2000 are shown below.  Sales for 2012 are year to date totals through July.

American Silver Eagle Bullion Coins
YEAR OUNCES SOLD
2000 9,133,000
2001 8,827,500
2002 10,475,500
2003 9,153,500
2004 9,617,000
2005 8,405,000
2006 10,021,000
2007 9,887,000
2008 19,583,500
2009 28,766,500
2010 34,662,500
2011 39,868,500
Jul-12 19,670,000
TOTAL 218,070,500

The American Eagle gold and silver bullion coins are sold by the U.S. Mint only to Authorized Purchasers who in turn resell the coins to the general public and other dealers.  Numismatic versions of the American Eagle series gold and silver coins can be purchased by the public directly from the U.S. Mint.

Would Auditing The Fed Send Gold Higher?

By Vin Maru

The House Passes H.R. 459 Bill from Ron Paul to Audit the Fed

July 25, 2012 should go down in history as the date the Federal Reserve may become fully accountable to the US government. A motion to pass the bill as amended was unanimously approved by the house to require a full audit of the boards of governors of the Federal Reserve System and banks. This will be done by the Comptroller General of the US before the end of 2012 and they are required to issue their report within 12 months of enactment.  The votes in the House in the bill’s passing this was 326 yea votes to 99 nay votes with 7 non votes.  Interestingly enough it was the Republicans that strongly supported this bill with 239 yea and 1 nay vote, while the Democrats voted 88 yea and 98 nay.
http://youtu.be/C47DVVUmHDw

There are many hurdles ahead of this bill before it takes effect; it still has to be ratified by the Senate and the President.  However, finally getting approved in the House is a step in the right direction.  Even if it does pass how much effect will the audit have in reality?  Probably not much since the banking institution known as the Federal Reserve operates outside of any law.  Even if they are found guilty of any wrong doing in managing the value of the US dollar or being involved in rigging the Libor rate, who will be there to prosecute them?  Remember they operate outside the law, so even if they are found guilty, it will be the US citizens and holders of paper/digital US dollars that will somehow pay for it.

In a world where bank’s losses are socialized, the Federal Reserve (the banker for banks) misconducts have always been socialized on the people.  Of course, this socialization of losses by the Fed has been taking place ever since its illegal inception.  In 1913, the Federal Reserve stole the power to issue and control money by introducing the Federal Reserve note, something we call the US dollar.  Since then, it is estimated that the dollar has lost 95% of its purchasing power by way of inflation (the increase of the money supply), so it really has only 5% left to go.   As the value of the US dollar moves towards its intrinsic value of zero, gold and silver as true money has only one way to go and that is up.

Usually first reactions are correct and looking at this news the value of the US dollar reacted negatively, while gold went higher in most major currencies around the world.

Could This be the Catalyst that Gold Needs for a Major Break Out to the Upside?

In a manipulated market, it’s tough to say, but the fact that there is support for auditing the Fed and making it accountable is definitely a step in the right direction.  With the recent news about major banks manipulating the Libor rate, any investigation into the Fed’s involvement is most welcome and has to be gold-positive.  Recently, we have been writing about how gold is moving towards the financial system with several different proposals for making it a tier 1 asset class and its use as collateral by financial institutions. If these proposals take effect, they are planned for January 2013, which coincides nicely with this audit being completed by the end of 2012.

Normally, the summer doldrums represent the lows in price for precious metals with a significant rally occurring in the fall and winter.  With this recent down turn, we have most likely seen the lows, and there are many catalysts for G&S to move higher into next years.

For example:

1. Food inflation is rising with this drought.

2. Gold could carry a zero risk weighting on bank books by Jan 2013 (BIS and FDIC are proposing this).

3. Paper currencies are Fiat, essentially worthless, but they will be used to create inflation, there is no other choice at the moment—QE to Infinity.

4. Market manipulation by bullion banks will be overrun by physical buyer (mostly now coming from central banks).

5. The investment community is only 1% invested in gold; historically this has been 5-10%.

6. Political tensions with Iran could heat up again later this year or early next, causing higher oil prices and as such gold.

7. More banking manipulation and scandals are emerging this summer, the Libor scandal is just the tip of the iceberg.

8. They system for true price discovery is broken, regulators have failed and the LBMA & Comex have lost all control and credibility.

9.  The price suppression by the west will be overrun by the East and physical buyers. The West cannot win this paper game.

10. MOST importantly: GOLD and SILVER is a hard asset and it has a history of over 5000 years being REAL MONEY. This paper/digital money has been only in place over the last 100 years and is doomed to fail.

Now is the time to be investing in gold and silver, during this consolidation.  A long period of consolidation is usually followed by a major move either to the upside and downside.  Given gold and silver’s favourable fundamentals, the break out will most likely be to the upside as gold moves towards the financial system.  Today’s positive price action could be the start of a new trend higher going into the fall and early next year.  If this trend plays out, there will be several opportunities to trade in and out of several precious metals ETFs.  The gold miners are great value compared to gold and we have been evaluating several that have great upside potential and production growth.

The key is to be ahead of the curve before it happens, take a position and place a tight stop loss in case this is a fake break out and gold continues to correct lower against its fundamentals.  If the correction in gold is over and we are at a start of a new trend higher over the next year, this summer will prove to one of the best buying opportunities we have seen in a very long time.  Significant profits could be made buying gold and many of the producers during the summer doldrums and then selling into the fall and winter, the only question is are you positioned to take advantage of a trend change in gold when it happens.

If you enjoyed reading this article and are interested in protecting your wealth with precious metals, you can receive our free blog by visiting TDV Golden Trader.

Cheers

Have Gold Stocks Hit Bottom Yet? Richmont Mines Latest Disappointment

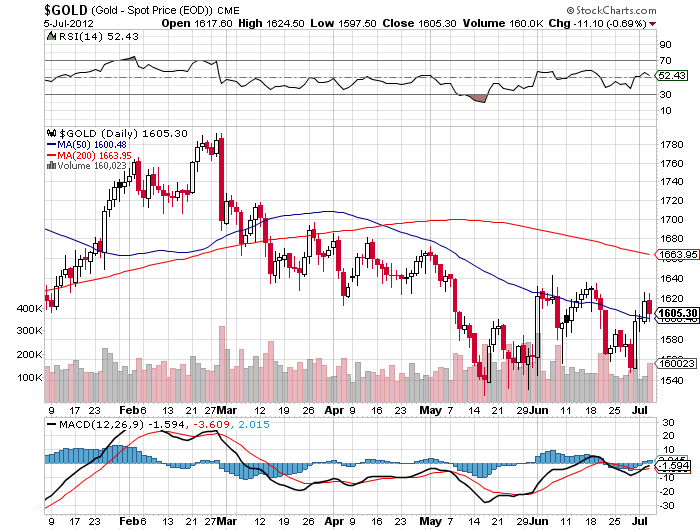
The price of gold is almost exactly unchanged on the year.  The first trading day of the year saw gold close at $1598 per ounce.  After reaching a high of $1781 on February 28th, gold has drifted lower and at today’s closing price of $1604 gold is up a fraction of a percent on the year.


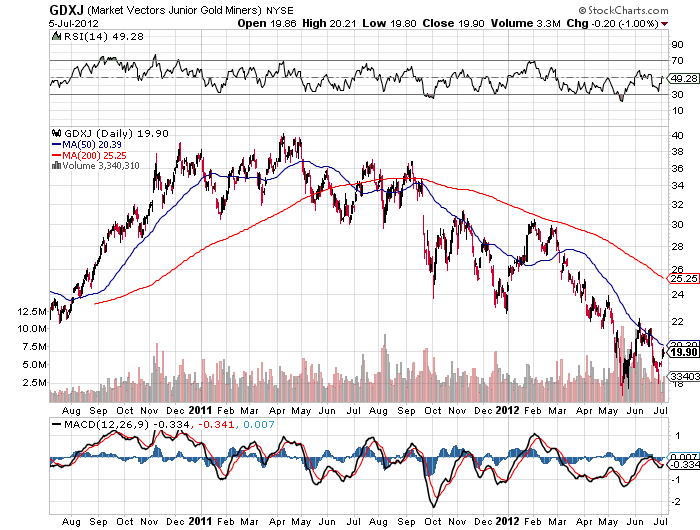
The story has been quite different for stockholders in gold mining companies.   Gold stocks have gone through a brutal sell off during 2012 despite the neutral price action of gold bullion.  Stock prices of the junior gold miners have been particularly brutalized as shown by the Market Vectors Junior Gold Mine ETF (GDXJ) which is down over 50% from its high late last year.


GDXJ - Courtesy stockcharts.com

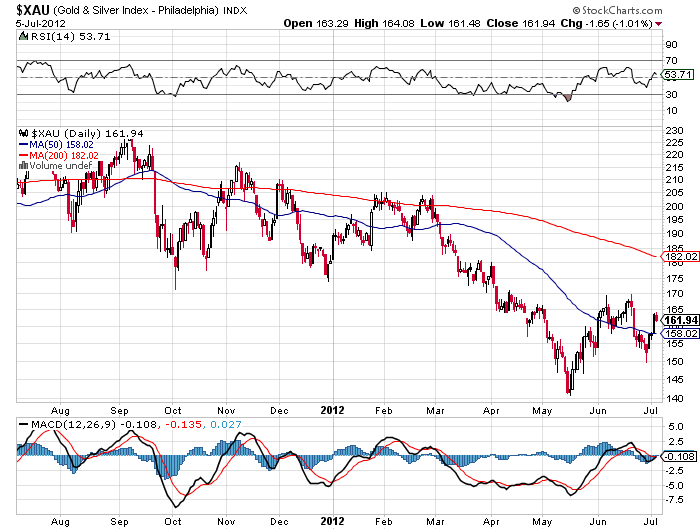
The shares of the largest gold miners have also seen major losses during 2012.  The PHLX Gold and Silver Index (^XAU), comprised of 16 major gold and silver producers, has decline by 21% from its peak reached in early February.


XAU - courtesy stockcharts.com

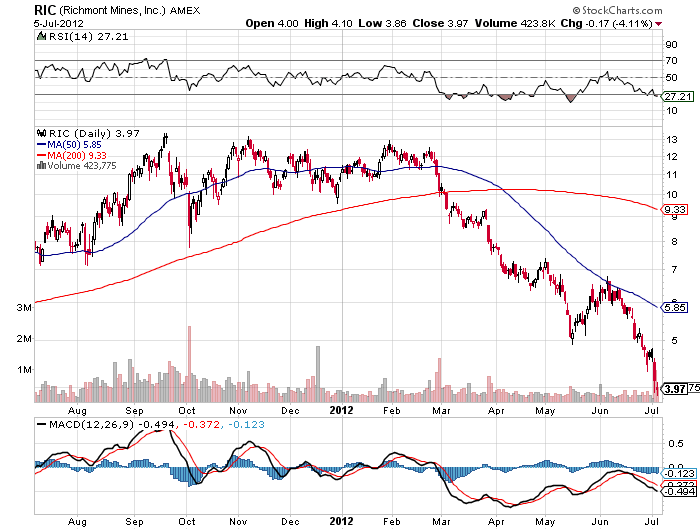
The latest casualty in the junior gold mining sector was Richmond Mines (RIC) which recently lowered its estimate of reserves and production and took a major write down on assets.  Richmond, a highly regarded gold mining company with excellent reserves and earnings prospects, was only one of the latest blowups in the junior gold mining sector.  Richmond Mines has collapsed 70% from its $13 per share price in late January, closing today at $3.97.


Courtesy stockcharts.com

Is the decline in gold mining shares a harbinger for the future trend in gold bullion or is the latest sell off a major buying opportunity?

Here are some thoughts from two of the brightest minds in the industry who both have superb long term track records.

Legendary gold investor John Hathaway of the Tocqueville Gold Fund (TGLDX) remains bullish as discussed in his latest Gold Strategy Investment Letter.

Why would anyone own them other than for the possibility of a higher gold price?  While we do not wish to minimize such issues as capital spending cost pressures, resource nationalism, or competition from GLD and similar instruments, we believe those concerns will fall by the wayside with the resumption of the bull market in the metal.  If gold were to trade at $2,000/oz. later this year, and should the ratio of gold mining shares (XAU basis) return to the mid -point of its range since the launch of GLD in 2004, or roughly 15% versus the current level roughly 10%, mining stocks could  double on a 25% increase in the gold price.

The policy challenges facing the Volcker Fed and the Reagan administration that ultimately capped the previous bull market in gold seem mild by comparison to those of today.  We believe that gold remains under owned and misunderstood notwithstanding a thirteen year bull market.  It is considered a fringe strategy to most, a little bit exotic and slightly risqué to the mainstream investor.  While policy makers attempt to buy time by inventing solutions that are incomprehensible to most, the dream of mainstream investors for robust growth amidst stable economic conditions remains alive.  Faith in half-baked policy improvisations that are nothing more than repackaging bad debt in the envelope of sovereign credit, along with hope that ever increasing quantities of sovereign debt will generate growth is, in our opinion, delusional.

Peter Grandich gives an excellent in-depth analysis on both gold stocks and gold bullion in a recent post on the Grandich Letter website.  The full post is a must read – here are some of his latest thoughts.

Despite general metals prices much, much higher than a decade or two ago, the mining and exploration industry is far more challenged now than ever before. This is especially true as you move further down the food chain in the junior resource sector.

I’m certain there are other reasons, but I believe the above is a good part of why we’re where we are today. The question now is does this mean the mining and exploration stocks are no longer worthy?

The “mother” of all bull markets continues thanks to four key reasons:

  • Once dominant sellers that capped any advances, Central Banks are now net buyers.
  • Gold producers, who once “cut their noses to spite their faces” by selling forward large quantities of future production and helped capped the price by doing so, now operate under the belief hedging is a “four-letter” word among investors.
  • Gold Exchange Traded Funds (ETFs) greatly changed the balance between supply and demand. Investors who never or rarely sought exposure to gold beforehand (because of difficulties associated with physical bullion buying) and/or who ended using mining shares for exposure only to see them not come close to correlating movements in the gold price themselves, embraced ETFs in a big and powerful way in order to have exposure to gold. Whether or not those ETFs are really direct ways to physical ownership doesn’t concern them, but their large-scale appetite for them combined with the changes among Central Banks and gold producers greatly altered the supply versus demand in favor of demand.
  • Gold is money. There’s no Central Bank printing it like it’s going out of style. There’s no government(s) borrowed up to their eyeballs in it. Where you find real growing wealth in the world you find those people acquiring it are using gold as a storer of their wealth.

Gold Bullion Coin Sales Up 13% In June, Silver Bullion Coin Sales Remain Steady

According to the latest report from the U.S. Mint, sales of gold bullion coins increased by over 13% during June, while total sales of the silver bullion coins were essentially unchanged from May.
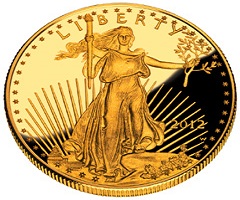
Monthly sales of the American Eagle gold bullion coin have fluctuated considerably during 2012 with sales reaching a monthly high of 127,000 ounces in January and a monthly low of 20,000 ounces in April.  Sales rebounded strongly in May to 53,000 ounces and continued higher in June with the sale of 60,000 ounces.

Sales of the American Eagle gold bullion coin can vary dramatically from month to month based on many factors.  The all time yearly sales record for the gold bullion coins of 1,435,000 ounces was reached in 2009  when many people feared that the financial system would collapse.  Sales volume of the gold bullion coins have not, however, had a direct correlation to the price of gold.  Gold closed 2009 at $1,087.50 per ounce and subsequently went on to hit a 2011 high of $1,895 on September 5th.  Despite the fact that gold increased by over 74% since year end 2009, total gold bullion coin sales declined in both 2010 and 2011.

If the European financial storm continues to unwind into a collapse similar to what we experienced in 2008, sales of the gold bullion coins could easily expand dramatically over the record levels seen in 2009.  With each passing day, there seem to be fewer reasons to maintain confidence in the paper money system as central bankers and governments attempt to prop up a debt burdened world economy with additional debt and money printing.

Listed below are the yearly sales of the American Eagle gold bullion coins since 2000.  The total for 2012 is through June 30th.

Gold Bullion U.S. Mint Sales By Year
Year Total Sales Oz.
2000 164,500
2001 325,000
2002 315,000
2003 484,500
2004 536,000
2005 449,000
2006 261,000
2007 198,500
2008 860,500
2009 1,435,000
2010 1,220,500
2011 1,000,000
2012 343,500
Total 7,593,000

If the sales trend of American gold bullion coins continues on the pace it has been on thus far, 2012 may turn out to be the fourth year in a row of lower sales.  The graph below shows gold bullion coin sales since 2000 with figures for 2012 annualized based on sales through June 30th.

U.S. Mint sales of the American Eagle silver bullion coin continued strong in June at 2,858,000 ounces, down slightly from the May total of 2,875,000 ounces.  After a strong start in January with sales of over 6 million ounces, sales dipped below 2 million ounces in February and April.  Year to date sales through June 2012 of the silver bullion coins total 17,392,000 ounces, down by 22% from the comparable sales period in 2011 when 22,303,500 ounces were sold.

If sales of the silver bullion coins continue at the same pace for the remainder of 2012, total sales could exceed 34 million ounces, not far below the record set during 2011 of 39.9 million ounces.   Considering that silver has corrected in price from $48.70 reached during April of 2011, the volume of silver bullion coin sales is very robust, with buyers taking advantage of lower prices.

In addition to gold and silver bullion coins, the U.S. Mint sells numismatic series of both gold and silver American Eagle coins which the public can purchase directly from the U.S. Mint.  Bullion versions of the gold and silver American Eagles are only sold to Authorized Purchasers who in turn resell the product to the general public and other dealers.

Total annual U.S. Mint sales of the American Silver Eagle bullion coins since 2000 are shown below.  Sales totals for 2012 are through June 30th.

American Silver Eagle Bullion Coins
YEAR OUNCES SOLD
2000 9,133,000
2001 8,827,500
2002 10,475,500
2003 9,153,500
2004 9,617,000
2005 8,405,000
2006 10,021,000
2007 9,887,000
2008 19,583,500
2009 28,766,500
2010 34,662,500
2011 39,868,500
2012 17,392,000
TOTAL 215,792,500

Gold, Dow and Oil All Plunge On Economic Weakness – Is Gold Still A Safe Haven?

The combination of increasingly ominous economic reports along with the Fed’s failure to announce bold new monetary initiatives resulted in a brutal reassessment of risk by investors.  Stock, commodity and precious metal markets all plunged with the Dow down 250 points, gold down by $41.60 per ounce  to $1,566 and silver off by 4.4% to $26.98.  Crude oil in New York trading was off 4%, dropping below $80 a barrel for the first time in eight months.
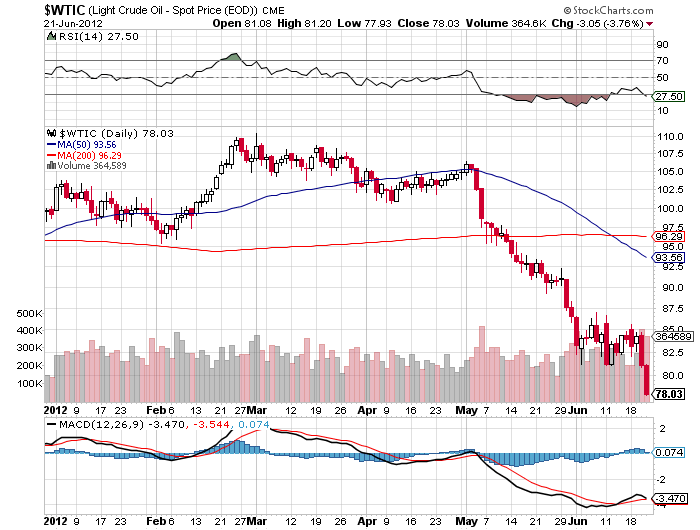
Since the end of May, the Dow had rallied over 700 points on rumors of massive coordinated central bank easing.  Investor optimism changed in a flash after yesterday’s FOMC announcement that Operation Twist would continue in an effort to further reduce long term interest rates.  Markets were clearly expecting more concerted action.  The Fed has already suppressed interest rates to all time lows with little to show for it.  In addition, the crisis in the Europe is on the verge of spinning out of control as insolvent sovereign states comically attempt to bail out insolvent banks.

The steep sell offs in oil and other commodities since early May have been a screaming warning sign of a steep slowdown in the global economy.   Further adding to investor concerns is the inability of policy makers to address fundamental economic problems that have beset the global economy since 2008.  Government borrowing, spending and a storm of money printing  has only made the fundamental problem of excessive debt burdens worse.  Now, as the world rapidly slides back into recession, we have to wonder – where do we go from here?


Oil - courtesy stockcharts.com

Gold - courtesy stockcharts.com

Despite Bernanke’s frequent remarks that “We stand ready to act” and his assertion that the Fed has many “tools in the toolbox”, the worst nightmare seems to be unfolding – a Fed that is out of options (or out of touch) as the world economy marches to the brink of a financial meltdown.

Will the world slide into a deflationary abyss as central banks stand aside and allow free markets to clear the debt excesses of the past two decades?  Not likely based on the entire history of the Federal Reserve.  What is highly likely, however, is that as the United States reaches the limits of credit expansion and taxation, neither the public nor our elected politicians will accept austerity as the road to restructuring the economy and national balance sheet.   Reality be damned as we reach the tipping point – the public will demand their entitlements and the politicians who resist will be voted from office.  The pressure on the central bank to “solve” our economic problems through an endless series of QE follies will result in a national financial nightmare.

Where does gold go from here as the world financial system totters on the brink?  No one can predict the short term moves in gold, but in a very uncertain world, there is one undeniable  dictum – “Gold is money.  Everything else is credit.”  (JP Morgan -1912).

Gold And The Dow Both At 12,000? – Here’s How It Could Happen

During his almost 20 year reign as Chairman of the Federal Reserve, Alan Greenspan’s easy money policies seemed to work like magic.  Ever lower interest rates and easy bank lending resulted in vast asset price inflation of both stocks and housing.  Flipping stocks and houses became the national past time as the asset bubbles continued to grow.  The average American envisioned a cushy retirement buoyed by ever rising housing values.

In 2004 George Bush nominated Alan Greenspan for an unprecedented fifth term as Chairman of the Federal Reserve, convinced that the “maestro” would continue to ensure a permanent national prosperity.  By the time Greenspan retired in January 2006, he had attained rock star cult status.  Who would have thought that a mere two years later, the 20 year Greenspan cycle of false “prosperity”, engineered through excessive borrowing, consumption and leverage would explode, hurtling the world into financial chaos?

Even worse, who would have thought that the same failed policies would be continued by Greenspan’s successor?  Bernanke’s attempts to re-inflate the burst bubbles of a past era are being defeated as a debt choked system crashes asset values as it deleverages.  Bernanke has proven himself to be equally maladroit at recognizing both housing bubbles and liquidity traps.

Meanwhile, the debt laden sovereign nations of the Eurozone are waking up to discover that their credibility in the bond markets has been vaporized.  How will it all end?  Some see hyperinflation in our future, others an all encompassing deflationary crash.  Either way, Vin Maru at TDV Golden Trader sees the Dow/gold ratio moving towards 1:1.

The Dow/gold Ratio Will Move Towards 1:1, Are You Positioned To Profit From It?

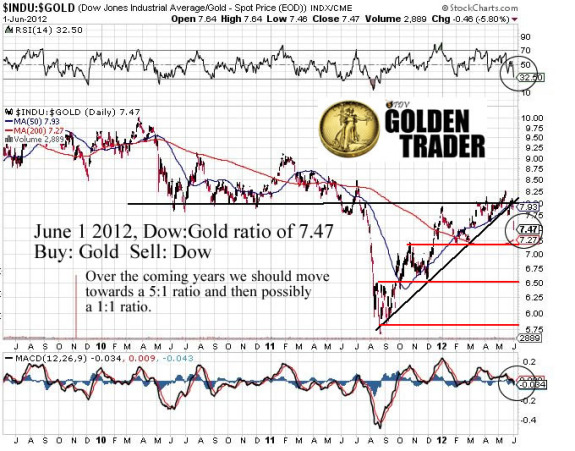
After spending the last month consolidating (around 8:1) the Dow/gold ratio broke down on Friday to close at 7.47.  This is a major shift, as the upward trend line in favour of the Dow since September has been broken with a significant drop.  This is a significant event that should trigger the selling of the boarder equity sector as money moves out of the Dow and S&P and into gold and related equities. Gold has once again become a safe haven as uncertainties around the Euro and fiat paper currencies persist. In addition, the growing consensus of a global economic slowdown and possibly a recession in the U.S. in the coming quarters, is bullish for gold.

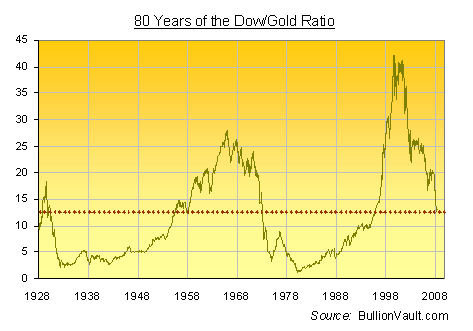
Gold is on the rise, especially compared to the Dow, as we move from a 7.5 ratio (Dow at 12,000 and gold at $1600) towards a 5:1 ratio and lower in the coming year.  Within a few years, we wouldn’t be surprised to see a Dow to Gold ratio of 1:1. History tells us that this ratio should be revisited again in the coming years.  If the longer term chart of the Dow/gold ratio is any indication of how quickly it will happen, it will be sooner rather than later. If you are invested in the broader stock market or mutual funds, this is the time to act and protect your wealth.  Once the final waterfall on the Dow develops and gold begins rising, it can move very quickly. By all indications on the charts and given the current market conditions, we believe it has already started.

HOW DO WE REACH THE DOW/GOLD RATIO OF 1:1?

The Inflationary Path

With the Dow now slightly above 12,000 and gold around $1620, the ratio is contracting fast as we move towards and below 5:1 in the coming years. How this will manifest itself is anyone’s guess at the moment.  If the Dow remains at 12,000, in an inflationary environment, gold will gravitate towards to the 1:1 ratio as it moves to a fair market value based on the outstanding debts and currency units floating around in the system. In the coming years, if the central bankers continue the path of papering over the financial mess that they have created, gold can easily reach $10K+. During a currency event, gold could climb to that price objective and it will take silver along with it.  If we return to the historical gold/silver ratio of 15:1, we could easily see silver at over $650 per ounce. Silver has been trading at around 55:1, and a currency event could move it towards the 15:1 ratio. At today’s price, silver has a lot of upside compared to gold.

Under this scenario, this assumes that currency inflation remains constant and that the financial markets continue to leave the Dow at 12,000.

The Deflationary Path

A deflationary spiral that unwinds debt around the world and leads to revaluations of paper currencies could also be in the cards.   The unravelling of the Euro could cause just such an environment. In this case, central bankers will not be able to stop the deflationary spiral that ensues as individuals start opting out of the paper/debt based system.  The bankers are pulling out all the stops and printing endless amounts of money to prevent this, but psychological forces can easily overwhelm this; economic law has a way of correcting imbalances created by man.   Under this scenario, the Dow will crash in a deflationary spiral towards gold’s price and possibly meet somewhere in the middle or at the lower end of gold’s trading range.

WATCH FOR 1:1

Either way, history has shown us that we are moving towards a long term cycle of low stock prices and higher gold prices; this should play out in the next few years, as it has already has started.  Trying to predict the price of gold is futile, what is most important is the Dow/gold ratio if 1:1.  Once we reach that objective or close to it, it will be time to get out of gold and move to other undervalued asset classes such as the Dow, until then stay long gold and short the Dow.

Once a trend based on fundamentals is in motion, it is very difficult to stop, as much as the masters of the paper universe would like to maintain control.  If a loss in confidence by the population of the world in purchasing power of fiat currency and  the value of the assets based on that paper price starts, (something we think has already started) then the there is no stopping this trend.  All the bankers can do is try and maintain the illusion of control, but eventually their efforts will fail.  The gold market senses this. As a result gold and gold related equities will outperform every other paper market and asset class moving forward for the next few years.  The price action on June 1, 2012 is just the beginning for the golden days ahead; just make sure your financial survival kit contains a percentage of gold, it may be the only thing that maintains its value as the paper currencies and paper assets around the world devalue compared to gold.

STRATEGY FOR HEDGING YOU PAPER ASSETS

Many of our readers already have a long position in physical gold and positions in several key mining companies and juniors.  We have kept a core position in the gold sector and will continue to add on additional weakness.  We are also evaluating potential gold producers and precious metals juniors/explorers which will have significant upside in the coming years as the nominal value of gold rises compared to other asset classes.

If you are looking for ideas and strategies for protecting your wealth and trading opportunities in the precious metals sector, please visit our site and sign up for our regular updates and blog posts.  We regularly provide technical analysis on the price of gold and the HUI index which can help you identify good entry and exit points for trading.

Gold and Silver Bullion Coin Sales Rebound Strongly In May

According to the latest report from the U.S. Mint, sales of both gold and silver bullion coins rebounded strongly during May.

Sales of the American Gold Eagle bullion coins during April had declined to only 20,000 ounces, the lowest monthly sales since June 2008 when 15,500 ounces were sold.  During May, the U.S. Mint sold 50,000 ounces of gold bullion coins, up 150% from April sales of 20,000 ounces.

The monthly sales figures for bullion coins can vary dramatically for a number of reasons, but support for the increase in demand during May may be due to the recent pullback in gold prices.  During May, the closing London PM Fix Price for gold declined by 6.3% from $1,664 to $1,558 per ounce.  Through the end of May, gold has declined by $40 from $1,598 at the beginning of 2012.  Gold reached a 2012 high of $1,781 on February 28th.

Sales of the American Eagle gold bullion coins hit a record high during the financial turmoil of 2009 as investors eagerly purchased 1,435,000 ounces of gold.  Ironically, sales of gold declined during the next two years despite the fact that the financial system has become more unstable as sovereign governments worldwide continue to borrow and print fiat money on an unprecedented scale in an effort to prop up a world economy burdened by unsustainable debt levels and nonexistent economic growth.  The ongoing simultaneous collapse of the banking systems and economies of the Eurozone is the most obvious trigger for the next phase of the financial crisis.  As confidence in paper money evaporates, expect gold to soar as investors stampede into the only currency that governments cannot debase.

Gold Bullion U.S. Mint Sales By Year
Year Total Sales Oz.
2000 164,500
2001 325,000
2002 315,000
2003 484,500
2004 536,000
2005 449,000
2006 261,000
2007 198,500
2008 860,500
2009 1,435,000
2010 1,220,500
2011 1,000,000
2012 280,500
Total 7,530,000
Note: 2012 totals through May 31, 2012

Sales by the U.S. Mint of the American Silver Eagle bullion coins for May almost doubled from the previous month.  Total sales of  silver bullion coins for May totaled 2,750,000 ounces, up 81% from sales of 1,520,000 ounces in April.  Year to date sales of the American Silver Eagle bullion coins through May 31st came in at 14,409,000, down by 23.8% from the first five months of 2011.  Sales of the silver bullion coins reached all an all time high during 2011.   Since reaching a multi decades high of $48.70 during April of 2011, silver has since corrected, closing out the month of May 2012 at $28.10.

Total annual U.S. Mint sales of the American Silver Eagle bullion coins since 2000 are shown below.  Sales totals for 2012 are through May 31.

In addition to gold and silver bullion coins, the U.S. Mint also sells numismatic versions (uncirculated and proof) of gold and silver American Eagle coins which can be purchased by the public directly from the U.S. Mint.  Gold and silver bullion coins are sold by the U.S. Mint only to authorized purchasers who in turn resell them to the general public and secondary retailers.

American Silver Eagle Bullion Coins
YEAR OUNCES SOLD
2000 9,133,000
2001 8,827,500
2002 10,475,500
2003 9,153,500
2004 9,617,000
2005 8,405,000
2006 10,021,000
2007 9,887,000
2008 19,583,500
2009 28,766,500
2010 34,662,500
2011 39,868,500
2012 14,409,000
TOTAL 212,809,500