April 19, 2024

Gold And The Dow Both At 12,000? – Here’s How It Could Happen

During his almost 20 year reign as Chairman of the Federal Reserve, Alan Greenspan’s easy money policies seemed to work like magic.  Ever lower interest rates and easy bank lending resulted in vast asset price inflation of both stocks and housing.  Flipping stocks and houses became the national past time as the asset bubbles continued to grow.  The average American envisioned a cushy retirement buoyed by ever rising housing values.

In 2004 George Bush nominated Alan Greenspan for an unprecedented fifth term as Chairman of the Federal Reserve, convinced that the “maestro” would continue to ensure a permanent national prosperity.  By the time Greenspan retired in January 2006, he had attained rock star cult status.  Who would have thought that a mere two years later, the 20 year Greenspan cycle of false “prosperity”, engineered through excessive borrowing, consumption and leverage would explode, hurtling the world into financial chaos?

Even worse, who would have thought that the same failed policies would be continued by Greenspan’s successor?  Bernanke’s attempts to re-inflate the burst bubbles of a past era are being defeated as a debt choked system crashes asset values as it deleverages.  Bernanke has proven himself to be equally maladroit at recognizing both housing bubbles and liquidity traps.

Meanwhile, the debt laden sovereign nations of the Eurozone are waking up to discover that their credibility in the bond markets has been vaporized.  How will it all end?  Some see hyperinflation in our future, others an all encompassing deflationary crash.  Either way, Vin Maru at TDV Golden Trader sees the Dow/gold ratio moving towards 1:1.

The Dow/gold Ratio Will Move Towards 1:1, Are You Positioned To Profit From It?

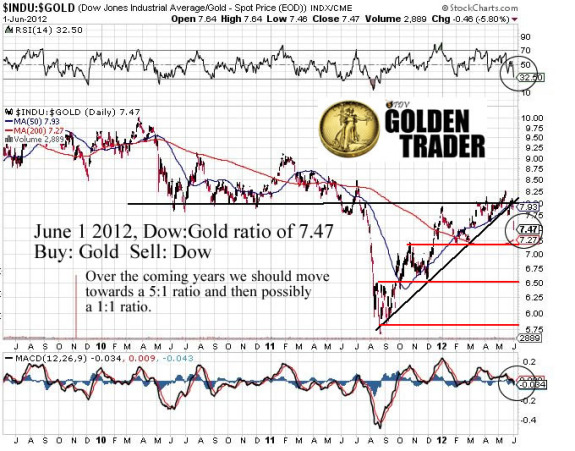
After spending the last month consolidating (around 8:1) the Dow/gold ratio broke down on Friday to close at 7.47.  This is a major shift, as the upward trend line in favour of the Dow since September has been broken with a significant drop.  This is a significant event that should trigger the selling of the boarder equity sector as money moves out of the Dow and S&P and into gold and related equities. Gold has once again become a safe haven as uncertainties around the Euro and fiat paper currencies persist. In addition, the growing consensus of a global economic slowdown and possibly a recession in the U.S. in the coming quarters, is bullish for gold.

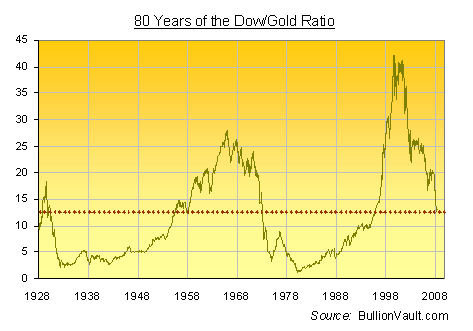
Gold is on the rise, especially compared to the Dow, as we move from a 7.5 ratio (Dow at 12,000 and gold at $1600) towards a 5:1 ratio and lower in the coming year.  Within a few years, we wouldn’t be surprised to see a Dow to Gold ratio of 1:1. History tells us that this ratio should be revisited again in the coming years.  If the longer term chart of the Dow/gold ratio is any indication of how quickly it will happen, it will be sooner rather than later. If you are invested in the broader stock market or mutual funds, this is the time to act and protect your wealth.  Once the final waterfall on the Dow develops and gold begins rising, it can move very quickly. By all indications on the charts and given the current market conditions, we believe it has already started.

HOW DO WE REACH THE DOW/GOLD RATIO OF 1:1?

The Inflationary Path

With the Dow now slightly above 12,000 and gold around $1620, the ratio is contracting fast as we move towards and below 5:1 in the coming years. How this will manifest itself is anyone’s guess at the moment.  If the Dow remains at 12,000, in an inflationary environment, gold will gravitate towards to the 1:1 ratio as it moves to a fair market value based on the outstanding debts and currency units floating around in the system. In the coming years, if the central bankers continue the path of papering over the financial mess that they have created, gold can easily reach $10K+. During a currency event, gold could climb to that price objective and it will take silver along with it.  If we return to the historical gold/silver ratio of 15:1, we could easily see silver at over $650 per ounce. Silver has been trading at around 55:1, and a currency event could move it towards the 15:1 ratio. At today’s price, silver has a lot of upside compared to gold.

Under this scenario, this assumes that currency inflation remains constant and that the financial markets continue to leave the Dow at 12,000.

The Deflationary Path

A deflationary spiral that unwinds debt around the world and leads to revaluations of paper currencies could also be in the cards.   The unravelling of the Euro could cause just such an environment. In this case, central bankers will not be able to stop the deflationary spiral that ensues as individuals start opting out of the paper/debt based system.  The bankers are pulling out all the stops and printing endless amounts of money to prevent this, but psychological forces can easily overwhelm this; economic law has a way of correcting imbalances created by man.   Under this scenario, the Dow will crash in a deflationary spiral towards gold’s price and possibly meet somewhere in the middle or at the lower end of gold’s trading range.

WATCH FOR 1:1

Either way, history has shown us that we are moving towards a long term cycle of low stock prices and higher gold prices; this should play out in the next few years, as it has already has started.  Trying to predict the price of gold is futile, what is most important is the Dow/gold ratio if 1:1.  Once we reach that objective or close to it, it will be time to get out of gold and move to other undervalued asset classes such as the Dow, until then stay long gold and short the Dow.

Once a trend based on fundamentals is in motion, it is very difficult to stop, as much as the masters of the paper universe would like to maintain control.  If a loss in confidence by the population of the world in purchasing power of fiat currency and  the value of the assets based on that paper price starts, (something we think has already started) then the there is no stopping this trend.  All the bankers can do is try and maintain the illusion of control, but eventually their efforts will fail.  The gold market senses this. As a result gold and gold related equities will outperform every other paper market and asset class moving forward for the next few years.  The price action on June 1, 2012 is just the beginning for the golden days ahead; just make sure your financial survival kit contains a percentage of gold, it may be the only thing that maintains its value as the paper currencies and paper assets around the world devalue compared to gold.

STRATEGY FOR HEDGING YOU PAPER ASSETS

Many of our readers already have a long position in physical gold and positions in several key mining companies and juniors.  We have kept a core position in the gold sector and will continue to add on additional weakness.  We are also evaluating potential gold producers and precious metals juniors/explorers which will have significant upside in the coming years as the nominal value of gold rises compared to other asset classes.

If you are looking for ideas and strategies for protecting your wealth and trading opportunities in the precious metals sector, please visit our site and sign up for our regular updates and blog posts.  We regularly provide technical analysis on the price of gold and the HUI index which can help you identify good entry and exit points for trading.
$40 Silver Predicted By Year End

Will silver hit $40 by year end?

The latest in depth report on silver from the Silver Institute builds a sound fundamental rationale for a price of $40/ounce or higher by 2011 year end.  The Silver Institute report analyzes the current silver market, sources of investment demand, paper instruments linked to silver, silver mining stocks and privately held silver stocks.

Highlights of the Silver Institute report are summarized below and the full report can be found here.

1.   China and India dominate retail demand for silver but demand from India can be volatile with periods of heavy disinvestment such as occurred in 2009.  The key to silver demand in India remains linked to consumer price expectations and inflation in India has been soaring, reaching almost double digits.

Based on India’s current 9% inflation rate, 2012 is likely to see continued huge demand for both gold and silver.   Paper assets currently have little appeal to Indians seeking to preserve their wealth since interest rates are currently negative.  According to an article published at GATA, the yield on ten year notes is almost 1% below the rate of inflation resulting in an erosion of wealth for holders of paper assets.  Savers are reacting accordingly and purchasing precious metals to preserve their wealth.  During October, imports of gold and silver rose 40% to $7.2 billion.

2.   The Silver Institute forecasts that gold and silver will benefit as a safe haven based on the expanding European sovereign debt crisis which appears to be spiraling out of control.  Silver should also benefit from asset reallocation as recession in Europe causes losses in traditional paper assets.

Amazingly, as both paper currencies and governments continue to collapse, investors still have a blind misguided faith in paper assets back only by the “full faith and credit” of insolvent nations.  Proof of this is seen by the Silver Institute’s forecast of only a 10% increase in retail demand for bullion coin and small bar in Europe.  Demand for precious metals in the U.S. is forecast even lower at 7%.  Such modest demand for the only currency that cannot be debased by government actions completely refutes those who claim that precious metals are in a bubble.

3.  The Silver Institute forecasts that investment demand in 2011 will reach new record highs of $10 billion.  Chinese demand for physical silver should grow by 25% and Indian demand for silver should increase by a massive 55% to 45 million ounces.  The Institute Report also notes that the silver market in China is still very small since the market for silver was only recently liberalized in 2009.

U.S. investors have also taken the opportunity to capitalize on bargain silver prices.   U.S. Mint sales of American Silver Eagle bullion coins should easily hit an all time record high of over 42 million ounces in 2011.

4.   The Silver Institute notes that the rise in silver prices has correlated with the increased price of gold and also benefited from the introduction of ETF products, such as the iShares Silver Trust (SLV).  The iShares Silver Trust has grown to $10.6 billion with holdings of 314.6 million ounces of silver since its launch in 2006.

The correlation of silver to gold prices, as represented by the gold/silver ratio, also suggests that the price of silver is undervalued.   From a long term historical perspective, a gold/silver ratio of 16 has prevailed.   After dropping from 70 to 30 during the first half of the year, the gold/silver ratio has climbed to 52.  If the gold/silver ratio returns to 16, silver prices could easily reach $110 per ounce based on the current price of gold.

The increasingly tenuous “value” of paper currencies combined with increased worldwide demand for silver as a safe haven asset makes a compellingly bullish case for additional investment in silver.


Measuring Declines from the High for Gold and Silver Prices

The prices of gold and silver had each risen to fresh all time highs, just before the severe declines experienced over the past few days.
On April 25, 2011, the price of silver touched an intraday high of $49.82 per ounce. This narrowly eclipsed the previous all time high of $49.45 reached in 1980. Silver’s recent price of $34.64 represents a decline of $15.18 or 30.47%.

After breaking above the $1,450 per ounce level in early April, the price of gold had achieved a string of new all time highs. This culminated with the most recent high of $1,577.40 per ounce reached on May 2, 2011. The recent gold price of $1,473.60 per ounce represents a decline of $103.80 or 6.58%.

The severity of the decline for silver has drastically altered the Gold Silver Ratio. This ratio measures the number of ounces of silver necessary to purchase one ounce of gold. At their respective highs, the ratio would have been 31.65. Recent prices put the ratio at 42.54.

Gold

Recent High: $1,577.40 (May 2, 2011)
Recent Price: $1,473.60 (May 5, 2011)
Decline: -$103.80 (-6.58%)

Silver

Recent High: $49.82 (April 25, 2011)
Recent Price: $34.64 (May 5, 2011)
Decline: -$15.18 (-30.47%)

Gold and silver’s stellar performance over the past several years has been interrupted by other declines, some of them even more drastic. From intermediary peaks reached in March 2008, gold and silver fell sharply as the financial world melted down later that year. Gold fell from $1,011.25 to $712.50 per ounce, losing 29.54%. Silver fell from $20.92 per ounce to $8.88, for a loss of 57.55%.

Despite the recent carnage, both gold and silver hold onto gains for the year to date. From the price levels on December 31, 2010, gold is up $63.35 per ounce or 4.49% and silver is up $4.01 per ounce of 13.09%.

Historical Gold Silver Ratio Predicts $100 Silver Price

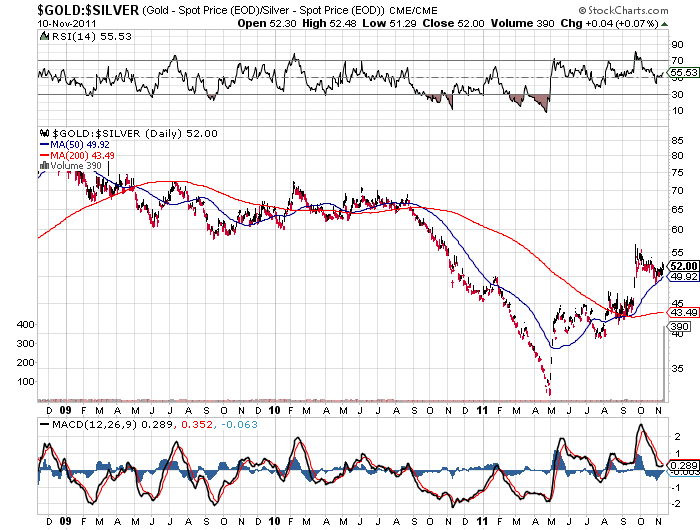
The gold silver ratio chart below shows the dramatic fashion in which silver has been outperforming gold since last August.  The gold silver ratio is calculated by dividing the price of gold by the price of silver.  A declining gold silver ratio indicates that silver has been outperforming gold.   The gold silver ratio has declined from 65 last summer to a current level of 41.
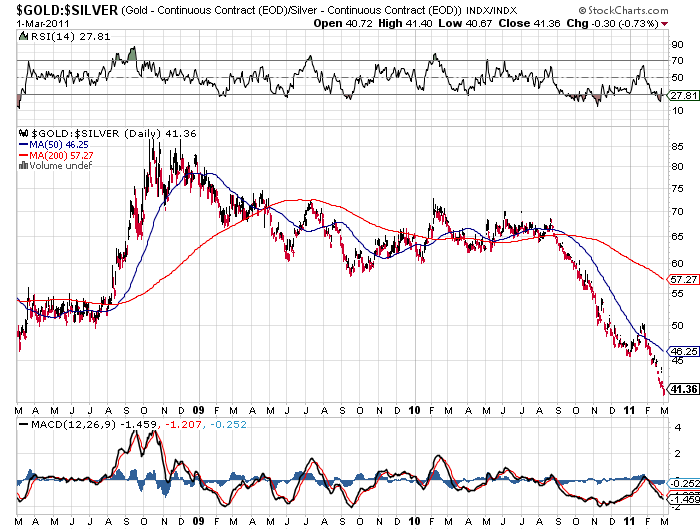
Since August 2010 gold has moved up 22% from the $1,175 level while silver has soared 92% from the $18 range.  Does the declining gold silver ratio indicate that silver prices are due for a correction or is this a fundamental change in the price relationship?

The gold silver ratio has averaged around 60 since the mid 1970’s.  In January 1980, as silver hit its peak price of $48.70, the gold silver ratio briefly hit 16, but rapidly rose as the Hunt brother’s attempt to corner the silver market came undone and silver prices collapsed.

Gold Silver Ratio - Courtesy Stockcharts.com

Will the current decline in the gold silver ratio continue?  From a very long term historical perspective, a gold silver ratio in the 16 range has been the norm.  Since ancient times, it has typically taken 16 ounces of silver to purchase one ounce of gold.  Interestingly, the earth’s  reserves of silver exceeds that of gold by roughly 16 times.  If this ultra long term relationship were to reassert itself, silver would sell for approximately $90 per ounce based on the current price of gold.  With gold at $2,500 per ounce, silver would have a value of $156 per ounce at the historical gold silver ratio of 16.

The fundamental reason that may drive the gold silver ratio back to the 16 range is growing demand by small investors.  Silver, known as the poor man’s gold has seen a huge surge of public demand, as evidenced by record sales of the Silver Eagles.

Increasing public recognition of the need to preserve wealth against paper currencies will continue to propel silver to historic highs.  Simply put, silver is more affordable to the average buyer who cannot afford the higher priced Gold Eagles.  Silver has a lot of catching up to do and we are probably in the early stages of a fundamental reversion to a lower gold silver ratio which will send silver prices soaring past $100 per ounce.

Gold and Silver Recap: Silver Price to $50?

Another Precious Week

Usually we start this column with some guff about gold.  And then after talking mostly about gold we may hit the other metals.  Let’s face it, gold is usually the most exciting metal there is.  If the world collapses about us, we will be using gold as the currency that helps us rebuild civilization.  And after all, what could be more exciting than that.

But the real action has been in the silver market.  Not all up, it must be said as silver took a real pounding on some days, but there’s some real excitement that J.P. Morgan may be about to bite it on silver.

Precious Metals Prices
Fri PM Fix Weekly Change
Gold $1,375.25 -28.25 (-2.01%)
Silver $28.79 +0.05 (+0.17%)
Platinum $1,673.00 -45.00 (-2.62%)
Palladium $737.00 -21.00 (-2.77%)

Gold-Silver Ratio: 47.77 (was 48.83)

First let’s look at some history.  Bunker Hunt and a few friends tried to corner the silver market by buying silver and buying silver futures.  They drove the silver price skywards, to a level that’s not been reached since.  Then the authorities did some dirty tricks with the silver futures contracts, the price of silver fell, and everyone brushed themselves off and got on with life.

Now J.P. Morgan has been accused of doing the same thing, but in reverse.  Instead of buying silver they are selling it short, that is they are selling it now to buy in six months time.  They have, it has been alleged, sold far more silver than they can possibly have.  This has meant that the rise in the silver price is going to kill them if we all buy physical silver.  You see, someone may want to see all this silver they’ve been sold, and then J.P. Morgan will have to buy it and up shoots the price.

The core idea here is that the gold silver ratio is ridiculously high.  Historically (going back to Biblical times) it has been 16:1, now it is around 48:1, although this week it fell quite fast.  A return to historical norms would mean that silver would get to $87 per ounce.

So there’s some correction that’s due.  Now, this doesn’t necessarily mean that silver has to go up.  There could be a new paradigm, or if not, the correction could be postponed for a very long time. If the correction does happen, then it could be that gold would go down to around $500 – where it was only a few years ago.

Gold could keep going down, but there’s enough uncertainty and inflation to suggest that it won’t get all the way to $500 per ounce.  The correction could be delayed by decades or muted, but the collection will come.  You could still lose money betting on it.

Perth Mint Forecasts Jump in Silver Coin Sales

The Perth Mint is operated by Gold Corporation, which is wholly owned by the Government of Western Australia. The Perth Mint currently refines all of the gold mined in Australia, as well as gold from surrounding countries, and scrap gold from Asia. In addition, they refine substantial quantities of silver.
The latter has been favored by Sales and Marketing Director Ron Currie, who stated, “There seems to be more upside with silver than gold right now.”

The State of Silver

Currie’s statements come as the Perth Mint provided their outlook for silver coin sales to increase by more than 50% for the year. The Perth Mint sells investment gold and silver coins and bars to customers throughout the world. They recently launched a website which allows Australian customers to purchase bullion products at live prices.

Other world mints have also recently provided forecasts for higher silver bullion sales. The Royal Canadian Mint, which offers silver bullion coins like the Silver Maple Leaf, forecast an increase in silver coin sales of more than 50% for the year. For 2009, silver coin sales had reached 10,300,000 ounces.

Sales of the United States Mint’s American Silver Eagle bullion coin recently moved into record territory for the year to date. The latest figures available from their website show sales of more than 32,500,000 ounces for the current year.

Silver or Gold?

The recent move towards silver investment, comes as the price of silver has been outperforming gold. For the year to date, silver has risen by about 57%, while gold has gained about 25%.

This recent divergence has resulted in a decline in the gold/silver ratio. This ratio measures the  number of ounces of silver it takes to purchase an ounce of gold. The ratio had spiked to more than 80 in late 2008, and was above 70 as recently as February of this year. Currently, the ratio stands at about 51 ounces of silver to 1 ounce of gold.

During the era when gold and silver were used in circulating U.S. coins, the ratio was officially set at 15 to 16. Within the earth’s crust, gold and silver naturally occur at a ratio of about 17.

Gold and Silver Recap: The Fed Gives a Helping Hand

So the Fed decides that quantitative easing was going to boost the economy, as if the way to prove that you’re really clever is to do the thing that wasn’t working before, just all over again.  This is naturally going to give precious metals a boost as investors realize that whether or not QE2 works for the economy, it’s definitely going to work for inflation.

Silver has always been a purer inflation hedge than gold, apart from in the days of the bi-metallic agitation, but no one’s really sure what that was about.  Those were the days, when to be a money crank was the minimum standard of a self-educated mind.  Of course the biggest money cranks of all, the fiat currency crowd, won.

But while gold is an inflation hedge as well, it’s also an “OMG the whole world’s going to end and I’m going to be living my life in a bunker” hedge.

The smart money is starting to notice silver, which could make things interesting.  The argument for gold to go up is that not every one’s really bought it yet.  How much more true is that of silver?

Anyway the crucial thing here is the gold to silver ratio.  Currently 52 ounces of silver will buy one ounce of gold (or pounds if you want to think big).  Historically it has been around 30 ounces of silver for every ounce of gold.  But recently there’s been manipulation that’s kept the price down through deliberate manipulation of silver short positions.  Well that’s what some investors are claiming and have named HSBC and JP Morgan in a lawsuit.

Well silver’s been the tearaway kid this week but there’s still some action in gold.  Diwali is over and the Republicans have been elected, which means both Indian jewelery buying and US government spending are going to take a short breather.  Although the dollar went up against a basket of currencies it really looks like these events have suppressed demand for gold.

Central banks are starting to notice gold with countries as diverse as the Philippines and South Africa slowly increasing their reserves.  How long will it be before the foreign currency giants such as China, Japan, Taiwan and the oil states start looking at the only currencies that are still standing five thousand years later?

Gold Currency Status, GATA Interview, Gold and Silver Prices

A selection of recent articles on gold and silver from across the internet:

Gold reclaims its currency status as the global system unravelsTelegraph.co.uk

“Central banks of Russia, the Philippines, Kazakhstan and Venezuela have been buying gold, and Saudi Arabia’s monetary authority has ‘restated’ its reserves upwards from 143m to 323m tonnes. If there is any theme to the bullion rush, it is fear that the global currency system is unravelling. Or, put another way, gold itself is reclaiming its historic role as the ultimate safe haven and benchmark currency.”

The story that’s GATA be told Motley Fool

An interview with Bill Murphy, co-founder of the Cold Antitrust Action Committee (GATA).

“What’s important for your readership to understand is that the markets have been made dysfunctional by U.S. policy and what these bullion banks are doing. Even Alan Greenspan said recently that interest rates were left too low for too long. Had the gold price been allowed to trade freely, interest rates wouldn’t have been able to stay down as low as they were. It would have been a warning sign for people not to get involved in the behavior that they did … not to go with all of the risks that developed. And there’s a good likelihood that the disaster would have been nowhere near as bad as it was.

“Alan Greenspan called gold a “thermometer.” So they diffused the thermometer by keeping the gold price managed. And what’s important for people to understand now is that the same thing is going on. If we’re correct, it’s going to lead to a bigger catastrophe, because no one has learned any lessons.”

Silver may advance to $23Bloomberg Businessweek

Silver is called a cheap alternative to gold. The current gold/silver ratio is compared to historical levels.

“An ounce of gold for immediate delivery bought about 65.81 ounces of silver today, compared with the 2008 low of 47.55 ounces and the decade average of 61.99 ounces.”

Five reasons to expect gold and silver prices to be suppressed this weekCoin Update

After reaching an all time high price Monday morning, the price of gold has already dropped by about $30 and silver is down more than $1.

“There are more reasons than usual why the US government would want gold and silver prices to be in the dumps this week…”