April 25, 2024

$40 Silver Predicted By Year End

Will silver hit $40 by year end?

The latest in depth report on silver from the Silver Institute builds a sound fundamental rationale for a price of $40/ounce or higher by 2011 year end.  The Silver Institute report analyzes the current silver market, sources of investment demand, paper instruments linked to silver, silver mining stocks and privately held silver stocks.

Highlights of the Silver Institute report are summarized below and the full report can be found here.

1.   China and India dominate retail demand for silver but demand from India can be volatile with periods of heavy disinvestment such as occurred in 2009.  The key to silver demand in India remains linked to consumer price expectations and inflation in India has been soaring, reaching almost double digits.

Based on India’s current 9% inflation rate, 2012 is likely to see continued huge demand for both gold and silver.   Paper assets currently have little appeal to Indians seeking to preserve their wealth since interest rates are currently negative.  According to an article published at GATA, the yield on ten year notes is almost 1% below the rate of inflation resulting in an erosion of wealth for holders of paper assets.  Savers are reacting accordingly and purchasing precious metals to preserve their wealth.  During October, imports of gold and silver rose 40% to $7.2 billion.

2.   The Silver Institute forecasts that gold and silver will benefit as a safe haven based on the expanding European sovereign debt crisis which appears to be spiraling out of control.  Silver should also benefit from asset reallocation as recession in Europe causes losses in traditional paper assets.

Amazingly, as both paper currencies and governments continue to collapse, investors still have a blind misguided faith in paper assets back only by the “full faith and credit” of insolvent nations.  Proof of this is seen by the Silver Institute’s forecast of only a 10% increase in retail demand for bullion coin and small bar in Europe.  Demand for precious metals in the U.S. is forecast even lower at 7%.  Such modest demand for the only currency that cannot be debased by government actions completely refutes those who claim that precious metals are in a bubble.

3.  The Silver Institute forecasts that investment demand in 2011 will reach new record highs of $10 billion.  Chinese demand for physical silver should grow by 25% and Indian demand for silver should increase by a massive 55% to 45 million ounces.  The Institute Report also notes that the silver market in China is still very small since the market for silver was only recently liberalized in 2009.

U.S. investors have also taken the opportunity to capitalize on bargain silver prices.   U.S. Mint sales of American Silver Eagle bullion coins should easily hit an all time record high of over 42 million ounces in 2011.

4.   The Silver Institute notes that the rise in silver prices has correlated with the increased price of gold and also benefited from the introduction of ETF products, such as the iShares Silver Trust (SLV).  The iShares Silver Trust has grown to $10.6 billion with holdings of 314.6 million ounces of silver since its launch in 2006.

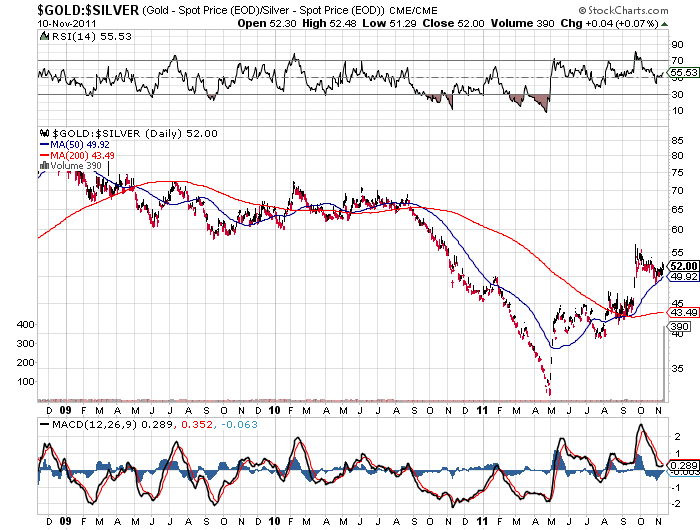
The correlation of silver to gold prices, as represented by the gold/silver ratio, also suggests that the price of silver is undervalued.   From a long term historical perspective, a gold/silver ratio of 16 has prevailed.   After dropping from 70 to 30 during the first half of the year, the gold/silver ratio has climbed to 52.  If the gold/silver ratio returns to 16, silver prices could easily reach $110 per ounce based on the current price of gold.

The increasingly tenuous “value” of paper currencies combined with increased worldwide demand for silver as a safe haven asset makes a compellingly bullish case for additional investment in silver.


Gold and Silver Paper and Physical Markets Realign

Late last year and early this year, a continual observation of the gold and silver markets was the disconnect between the prices quoted on paper markets and the prices that you would actually need to pay to buy physical precious metals. In the past few weeks premiums for physical gold and silver have declined as the prices quoted on the paper market have risen, basically bringing the two markets back into alignment.

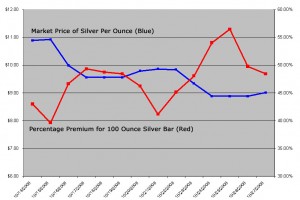
Back in October 2008, I had examined 100 ounce silver bars as an example of the excessive premiums being paid for physical precious metals. I collected some data from recently completed eBay auctions that showed the average price of the 100 ounce silver bar ranging from $1,329 to $1,557 while the market price of silver ranged from $8.88 to $10.89. This represented premiums ranging from $39.62% to 56.45%. This was particularly ridiculous since the 100 ounce silver bar has been traditionally viewed as a low premium method for silver investing.

Reviewing some data for eBay auctions completed yesterday now shows the prices paid for 100 ounce silver bars ranging from $1,450 to $1,500. At yesterday’s closing price of silver of $14.09, this represents a much more reasonable premium of about 3% to 6%.

Peculiarly, the decline in premium is a close match to the increase in price for spot silver. If you invested in silver by buying physical bars back in October, you might be showing zero profit even though the market price is up over 40%.

Future Gold and Silver Price Implications?

When the premiums for physical precious metals were high, it was viewed as a sign of heavy demand amidst a diminished supply that would eventually force market prices to move higher. Now that the disconnect between the paper and physical markets has seemingly resolved itself, is this a signal of slower demand that will lead to lower prices?

Despite the implication of slower demand, I think the realignment of the markets represents a long term positive for the price of gold and silver. Back when premiums were high, I am sure that many potential investors backed away from the market when they were faced with excessive premiums. Potential investors will now actually be able to buy physical gold and silver around the market prices. This is a much better environment for fostering mainstream demand to keep gold and silver moving higher.
[phpbay]100 ounce silver bar, 3, “”, “”[/phpbay]

Gold and Silver News & Headlines for November 19

Safe

To Prevent Bubbles, Restrain the Fed

Some very interesting opinions are being published in the Wall Street Journal lately. “Mr. Obama needs to stop the next asset bubble from being inflated by imposing a commodity standard on the Fed. A commodity standard (such as a gold standard) imposes discipline on a central bank because it forces it to acquire commodity reserves in order to increase the money supply.”

Saudi Arabia buys $3.5bn of gold in two weeks

But at what price? “News about the Saudi gold rush is bound to fuel speculation about the alleged large physical gold transactions that have been taking place at prices will above the spot price set in the futures market.”

Worth $15,000, will you take $30?

Kids sell a 62.5 chunk of metal for gas money. It turns out they had been breaking into safes.

Silver Available Amidst Shortages

Arbitrage play on physical silver of various weights: Sell 100 oz. silver bars, use the proceeds to buy 1,000 oz. bars, and fabricate those into 1 oz. bars. I’m surprised there are not more people doing this in large scale.

Premiums for 100 Ounce Silver Bars

There has been much recent coverage of the rising premiums being paid to purchase physical gold and silver bullion. This has been cited as a consequence of the extreme demand for precious metals and evidence of the growing disconnect between market prices and physical prices.

I decided to look at some data to calculate exactly what kind of premiums are being paid and see if any trend or patterns in the data could be determined.

Specifically, I looked at selling prices for 100 ounce silver bars on eBay. I decided to use this as a source of data since 100 ounce silver bars have historically been a low premium method to acquire silver.  Also, bars of silver are relatively undifferentiated. Bullion coins from different countries or with different dates often carry premiums based on those differences.

I used eBay data because it was accessible. Completed auction records can be obtained for the prior two weeks or more. Also, I believe that eBay represents a real time, liquid market of buyers and sellers who discover prices through a bidding process. Quoted dealer prices may be for delivery at a later date and may not represent actual available supplies.

There are some possible flaws with this method. It does not take into account potential premiums for different manufacturers. I don’t know if people pay more for different makes of bars. Also, shipping costs are not included in the price data used. Some auctions may carry higher shipping charges which would impact the final selling prices. And lastly, some auctions were “true auctions” which start at a minimal opening bid while others were fixed price listings.

Data was available from October 13 to today’s date. I did not include data for today or October 13, since it may represent partial data. I determined the average price for each day’s auctions which closed with a sale. I compared this to the closing market price of silver for each day.

Here is a summary of the data:

Average Price for 100 Ounce Silver Bars on eBay Compared to Market Price of Silver

Date Bars Sold Ave Price Market Price Premium Premium %
14-Oct 12 $1,557.17 $10.89 $468.17 42.99%
15-Oct 10 $1,524.70 $10.92 $432.70 39.62%
16-Oct 29 $1,465.07 $9.99 $466.07 46.65%
17-Oct 19 $1,427.68 $9.56 $471.68 49.34%
18-Oct 28 $1,422.00 $9.56 $466.00 48.74%
19-Oct 46 $1,419.04 $9.56 $463.04 48.44%
20-Oct 21 $1,431.76 $9.79 $452.76 46.25%
21-Oct 17 $1,391.94 $9.86 $405.94 41.17%
22-Oct 19 $1,428.11 $9.84 $444.11 45.13%
23-Oct 25 $1,382.84 $9.34 $448.84 48.06%
24-Oct 37 $1,367.78 $8.88 $479.78 54.03%
25-Oct 13 $1,389.31 $8.88 $501.31 56.45%
26-Oct 33 $1,329.91 $8.88 $441.91 49.76%
27-Oct 15 $1,337.33 $9.01 $436.33 48.43%

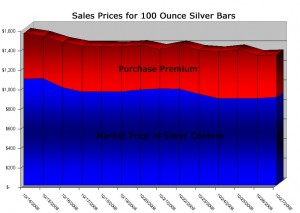
Some charts based on this data appear to the right. (Click for larger versions) The data is only for a limited time frame, but it does spur some interesting observations.

The premium paid for a 100 ounce silver bar has ranged from 39.62% to 56.45%. The premium represents the amount paid in excess of the so-called “market price” of silver. People are clearly paying astounding premiums to acquire physical silver.

On October 15 and 22, the market price of silver dropped. In each instance this caused the percentage premium to rise. This lends some evidence to the anecdotal observation that a decline in market price only spurs greater demand for the physical metal.

Two distinct prices for silver seem to exist. The paper price for the contractual right to acquire future silver, and the physical price to acquire real silver, in hand. How and when will this situation resolve itself?

There have been several recent reports of bullion buyers seeking to take physical delivery of silver and gold from the COMEX. This would allow buyers to purchase real silver at the heretofore “fictional” paper price. If these deliveries take place and become a dependable source of purchasing physical silver, premiums for 100 ounce bars and other physical silver would likely begin to subside.

On the other hand, some are voicing the possibility that since the COMEX only has small coverage of physical metal for outstanding contacts, if enough contact holders demand delivery they will be forced to default and settle in cash. If this occurs, the likely result would be soaring market prices for silver and potentially greater premiums as the argument for physical scarcity gains another leg of support.
[phpbay]100 silver bar, 3, 39489, “”[/phpbay]