April 20, 2024

Measuring Declines from the High for Gold and Silver Prices

The prices of gold and silver had each risen to fresh all time highs, just before the severe declines experienced over the past few days.

On April 25, 2011, the price of silver touched an intraday high of $49.82 per ounce. This narrowly eclipsed the previous all time high of $49.45 reached in 1980. Silver’s recent price of $34.64 represents a decline of $15.18 or 30.47%.

After breaking above the $1,450 per ounce level in early April, the price of gold had achieved a string of new all time highs. This culminated with the most recent high of $1,577.40 per ounce reached on May 2, 2011. The recent gold price of $1,473.60 per ounce represents a decline of $103.80 or 6.58%.

The severity of the decline for silver has drastically altered the Gold Silver Ratio. This ratio measures the number of ounces of silver necessary to purchase one ounce of gold. At their respective highs, the ratio would have been 31.65. Recent prices put the ratio at 42.54.

Gold

Recent High: $1,577.40 (May 2, 2011)
Recent Price: $1,473.60 (May 5, 2011)
Decline: -$103.80 (-6.58%)

Silver

Recent High: $49.82 (April 25, 2011)
Recent Price: $34.64 (May 5, 2011)
Decline: -$15.18 (-30.47%)

Gold and silver’s stellar performance over the past several years has been interrupted by other declines, some of them even more drastic. From intermediary peaks reached in March 2008, gold and silver fell sharply as the financial world melted down later that year. Gold fell from $1,011.25 to $712.50 per ounce, losing 29.54%. Silver fell from $20.92 per ounce to $8.88, for a loss of 57.55%.

Despite the recent carnage, both gold and silver hold onto gains for the year to date. From the price levels on December 31, 2010, gold is up $63.35 per ounce or 4.49% and silver is up $4.01 per ounce of 13.09%.

Gold At Record High As Silver Price Soars Towards $50 – Why The Rally Will Continue

As government spending spirals out of control and the Federal Reserve perpetuates a deliberate strategy of currency debasement, precious metals prices continued to soar. Gold, as measured by the London PM Fix Price, closed at $1504.00, up $27.25 on a shortened four day trading week .
Gold has gained $86 during April and $185 from its January low of $1,319.  The price acceleration in April comes in the aftermath of the government’s dismal failure to reduce deficit spending, even as S&P warned of a credit ratings downgrade for the U.S.  The great budget compromise reached by both parties was soon exposed as a shameful hoax by the Congressional Budget Office, which said that government spending would actually be higher after the “budget cuts” due to gimmicks.

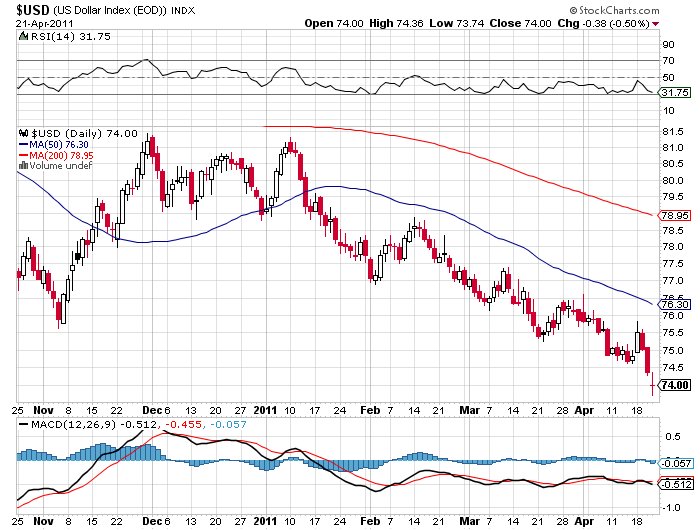
As unsustainable government debt continues to balloon and the Fed continues to print money, the dollar is getting trashed. Governments worldwide are taking steps to protect themselves from the Fed’s explicit policy of dollar debasement and this means selling dollars.  The US dollar has fallen almost 10% since the beginning of the year.  Gold and silver are becoming the de facto reserve currency, as the flight from dollars intensifies.

US Dollar- COURTESY STOCKCHARTS.COM

Silver has continued to confound the bears with another standout performance, gaining $3.65 or 8.57% on the week, after gaining $2.39 in the previous week. The closing price for silver as measured by the London PM Fix Price was $46.26.   Silver is rapidly closing in on its all time closing high of $48.70 hit in January 1980. The current price momentum in silver could easily push silver into new all time highs next week.

The huge rally in silver prices has some wondering if there will be a pullback soon.  Silver has gained $8.63 per ounce this month for a 22% gain.   Since the January low of $26.68, silver has gained a spectacular $19.58 per ounce for a huge gain of 73%.  The question is not one of if, but rather of when there will be a pullback – a routine event in every bull market.

Precious Metals Prices
Fri PM Fix Since Last Recap
Gold $1,504.00 +27.25 (+1.84%)
Silver $46.26 +3.65(+8.57%)
Platinum $1,812.00 +25.00 (+1.40%)
Palladium $765.00 -7.00 (-0.91%)

But perhaps the bears will have to wait a while longer for the much anticipated pullback.  The volume in put options on the silver ETFs has seen numerous days of record volume, implying that some big players are betting on a significant decline in silver prices.  Does the record put buying on silver reflect speculators betting on a silver plunge or merely long time silver investors hedging long positions?  Either way, the implication is that the expectations for a silver pullback seems to be growing, but markets rarely accommodate investors’ perceptions of when a market is truly overbought – expect higher silver prices to shock the put buyers in silver.

Long term, any price pullback in silver should be looked at as a gift.  Financial players should never “fight the Fed”  and in this case, both Federal Reserve and Government policies guarantee higher precious metals prices (see Why There Is No Upside Limit To Gold and Silver Prices).

iShares Silver Trust Holdings Continue Higher, as SPDR Gold Shares Trust Holdings Decline

The holdings of the iShares Silver Trust (SLV) increased on the week while holdings of the SPDR Gold Shares Trust (GLD) declined slightly.

Holdings in the SLV increased by 15.18 tonnes from the previous week.  Since March 1st, the Silver Trust has seen a net increase in holdings of 266.71 tonnes and a year to date increase of 38.82 tonnes.  The SLV now holds 352.4 million ounces of silver valued at $12.9 billion.

Silver hit a 31 year price high today, continuing a strong rally that began in late January.  In recent trading, silver was $37.34 per ounce.

At the inception of the iShares Silver Trust in April 2006, the SLV held 653.17 tonnes of silver valued at $263.5 million.  The SLV has been extremely popular with investors as the price of silver has steadily increased since 2006.  In addition, the establishment of the SLV has attracted many investors who would otherwise be disinclined to own silver considering the inconvenience and costs of taking physical delivery.

GLD and SLV Holdings (metric tonnes)

23-March-11 Weekly Change YTD Change
GLD 1,214.87 -2.43 -65.85
SLV 10,960.39 +15.18 +38.82

The price of the SLV hit a new all time high yesterday closing at $36.47, up $.93 on the day.  The move upward continued today in early trading, before a pull back erased the day’s gains. The SLV has gained over $10 since late January providing silver investors with a solid 38% gain.  Since the inception of the Silver Trust in 2006, the SLV has almost tripled.

Holdings of the SPDR Gold Shares Trust (GLD) declined modestly on the week by 2.43 tonnes.  The GLD has seen a year to date decline in its holdings of 65.85 tonnes.  The GLD currently holds 39.1 million ounces of gold valued at $56.2 billion.