May 19, 2024

Have Gold Stocks Hit Bottom Yet? Richmont Mines Latest Disappointment

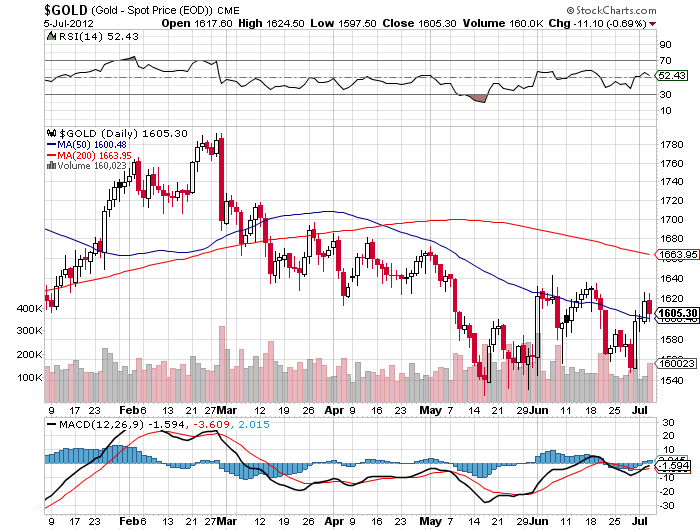
The price of gold is almost exactly unchanged on the year.  The first trading day of the year saw gold close at $1598 per ounce.  After reaching a high of $1781 on February 28th, gold has drifted lower and at today’s closing price of $1604 gold is up a fraction of a percent on the year.
 

The story has been quite different for stockholders in gold mining companies.   Gold stocks have gone through a brutal sell off during 2012 despite the neutral price action of gold bullion.  Stock prices of the junior gold miners have been particularly brutalized as shown by the Market Vectors Junior Gold Mine ETF (GDXJ) which is down over 50% from its high late last year.
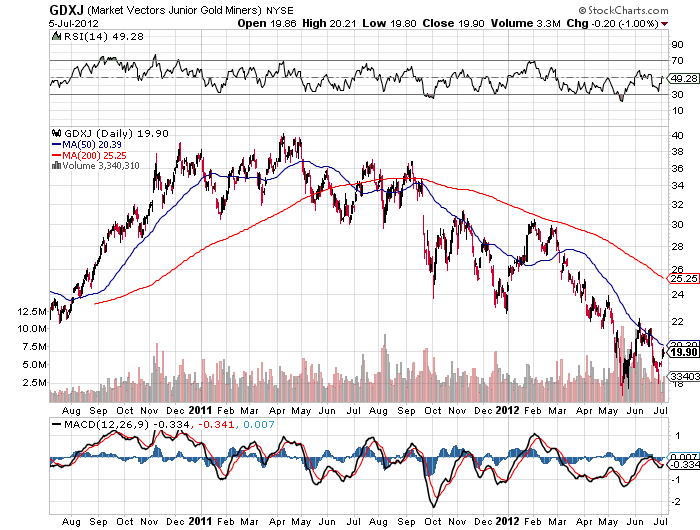
 

GDXJ - Courtesy stockcharts.com

The shares of the largest gold miners have also seen major losses during 2012.  The PHLX Gold and Silver Index (^XAU), comprised of 16 major gold and silver producers, has decline by 21% from its peak reached in early February.
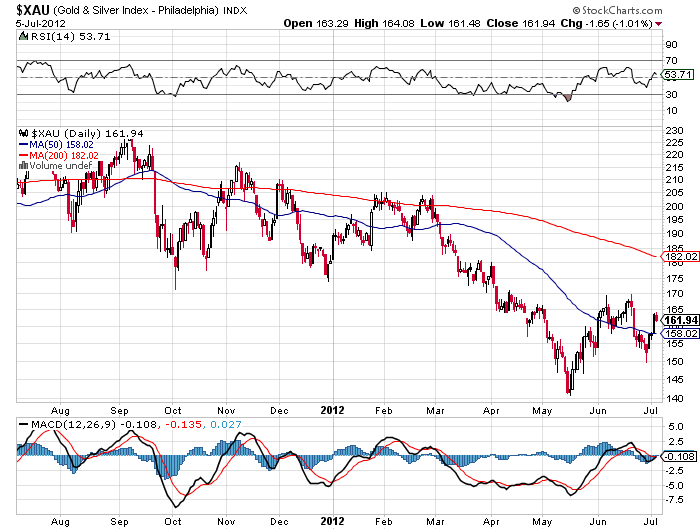
 

XAU - courtesy stockcharts.com

The latest casualty in the junior gold mining sector was Richmond Mines (RIC) which recently lowered its estimate of reserves and production and took a major write down on assets.  Richmond, a highly regarded gold mining company with excellent reserves and earnings prospects, was only one of the latest blowups in the junior gold mining sector.  Richmond Mines has collapsed 70% from its $13 per share price in late January, closing today at $3.97.
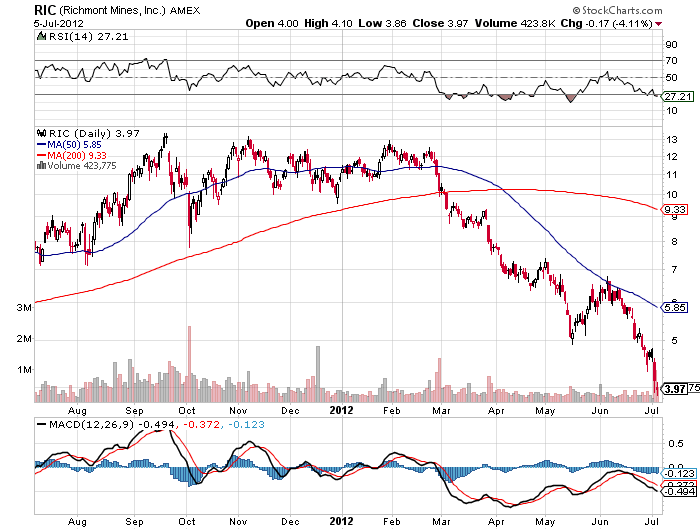
 

Courtesy stockcharts.com

Is the decline in gold mining shares a harbinger for the future trend in gold bullion or is the latest sell off a major buying opportunity?

Here are some thoughts from two of the brightest minds in the industry who both have superb long term track records.

Legendary gold investor John Hathaway of the Tocqueville Gold Fund (TGLDX) remains bullish as discussed in his latest Gold Strategy Investment Letter.

Why would anyone own them other than for the possibility of a higher gold price?  While we do not wish to minimize such issues as capital spending cost pressures, resource nationalism, or competition from GLD and similar instruments, we believe those concerns will fall by the wayside with the resumption of the bull market in the metal.  If gold were to trade at $2,000/oz. later this year, and should the ratio of gold mining shares (XAU basis) return to the mid -point of its range since the launch of GLD in 2004, or roughly 15% versus the current level roughly 10%, mining stocks could  double on a 25% increase in the gold price.

The policy challenges facing the Volcker Fed and the Reagan administration that ultimately capped the previous bull market in gold seem mild by comparison to those of today.  We believe that gold remains under owned and misunderstood notwithstanding a thirteen year bull market.  It is considered a fringe strategy to most, a little bit exotic and slightly risqué to the mainstream investor.  While policy makers attempt to buy time by inventing solutions that are incomprehensible to most, the dream of mainstream investors for robust growth amidst stable economic conditions remains alive.  Faith in half-baked policy improvisations that are nothing more than repackaging bad debt in the envelope of sovereign credit, along with hope that ever increasing quantities of sovereign debt will generate growth is, in our opinion, delusional.

Peter Grandich gives an excellent in-depth analysis on both gold stocks and gold bullion in a recent post on the Grandich Letter website.  The full post is a must read – here are some of his latest thoughts.

Despite general metals prices much, much higher than a decade or two ago, the mining and exploration industry is far more challenged now than ever before. This is especially true as you move further down the food chain in the junior resource sector.

I’m certain there are other reasons, but I believe the above is a good part of why we’re where we are today. The question now is does this mean the mining and exploration stocks are no longer worthy?

The “mother” of all bull markets continues thanks to four key reasons:

  • Once dominant sellers that capped any advances, Central Banks are now net buyers.
  • Gold producers, who once “cut their noses to spite their faces” by selling forward large quantities of future production and helped capped the price by doing so, now operate under the belief hedging is a “four-letter” word among investors.
  • Gold Exchange Traded Funds (ETFs) greatly changed the balance between supply and demand. Investors who never or rarely sought exposure to gold beforehand (because of difficulties associated with physical bullion buying) and/or who ended using mining shares for exposure only to see them not come close to correlating movements in the gold price themselves, embraced ETFs in a big and powerful way in order to have exposure to gold. Whether or not those ETFs are really direct ways to physical ownership doesn’t concern them, but their large-scale appetite for them combined with the changes among Central Banks and gold producers greatly altered the supply versus demand in favor of demand.
  • Gold is money. There’s no Central Bank printing it like it’s going out of style. There’s no government(s) borrowed up to their eyeballs in it. Where you find real growing wealth in the world you find those people acquiring it are using gold as a storer of their wealth.

Gold Bullion Coin Sales Up 13% In June, Silver Bullion Coin Sales Remain Steady

According to the latest report from the U.S. Mint, sales of gold bullion coins increased by over 13% during June, while total sales of the silver bullion coins were essentially unchanged from May.
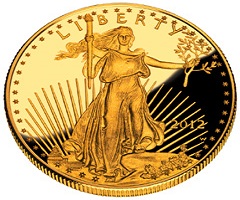
Monthly sales of the American Eagle gold bullion coin have fluctuated considerably during 2012 with sales reaching a monthly high of 127,000 ounces in January and a monthly low of 20,000 ounces in April.  Sales rebounded strongly in May to 53,000 ounces and continued higher in June with the sale of 60,000 ounces.

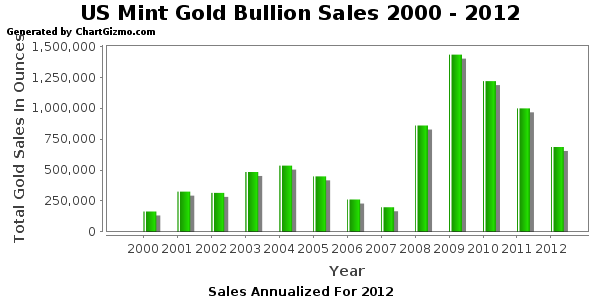
Sales of the American Eagle gold bullion coin can vary dramatically from month to month based on many factors.  The all time yearly sales record for the gold bullion coins of 1,435,000 ounces was reached in 2009  when many people feared that the financial system would collapse.  Sales volume of the gold bullion coins have not, however, had a direct correlation to the price of gold.  Gold closed 2009 at $1,087.50 per ounce and subsequently went on to hit a 2011 high of $1,895 on September 5th.  Despite the fact that gold increased by over 74% since year end 2009, total gold bullion coin sales declined in both 2010 and 2011.

If the European financial storm continues to unwind into a collapse similar to what we experienced in 2008, sales of the gold bullion coins could easily expand dramatically over the record levels seen in 2009.  With each passing day, there seem to be fewer reasons to maintain confidence in the paper money system as central bankers and governments attempt to prop up a debt burdened world economy with additional debt and money printing.

Listed below are the yearly sales of the American Eagle gold bullion coins since 2000.  The total for 2012 is through June 30th.

Gold Bullion U.S. Mint Sales By Year
Year Total Sales Oz.
2000 164,500
2001 325,000
2002 315,000
2003 484,500
2004 536,000
2005 449,000
2006 261,000
2007 198,500
2008 860,500
2009 1,435,000
2010 1,220,500
2011 1,000,000
2012 343,500
Total 7,593,000

If the sales trend of American gold bullion coins continues on the pace it has been on thus far, 2012 may turn out to be the fourth year in a row of lower sales.  The graph below shows gold bullion coin sales since 2000 with figures for 2012 annualized based on sales through June 30th.

U.S. Mint sales of the American Eagle silver bullion coin continued strong in June at 2,858,000 ounces, down slightly from the May total of 2,875,000 ounces.  After a strong start in January with sales of over 6 million ounces, sales dipped below 2 million ounces in February and April.  Year to date sales through June 2012 of the silver bullion coins total 17,392,000 ounces, down by 22% from the comparable sales period in 2011 when 22,303,500 ounces were sold.

If sales of the silver bullion coins continue at the same pace for the remainder of 2012, total sales could exceed 34 million ounces, not far below the record set during 2011 of 39.9 million ounces.   Considering that silver has corrected in price from $48.70 reached during April of 2011, the volume of silver bullion coin sales is very robust, with buyers taking advantage of lower prices.

In addition to gold and silver bullion coins, the U.S. Mint sells numismatic series of both gold and silver American Eagle coins which the public can purchase directly from the U.S. Mint.  Bullion versions of the gold and silver American Eagles are only sold to Authorized Purchasers who in turn resell the product to the general public and other dealers.

Total annual U.S. Mint sales of the American Silver Eagle bullion coins since 2000 are shown below.  Sales totals for 2012 are through June 30th.

American Silver Eagle Bullion Coins
YEAR OUNCES SOLD
2000 9,133,000
2001 8,827,500
2002 10,475,500
2003 9,153,500
2004 9,617,000
2005 8,405,000
2006 10,021,000
2007 9,887,000
2008 19,583,500
2009 28,766,500
2010 34,662,500
2011 39,868,500
2012 17,392,000
TOTAL 215,792,500

Gold, Dow and Oil All Plunge On Economic Weakness – Is Gold Still A Safe Haven?

The combination of increasingly ominous economic reports along with the Fed’s failure to announce bold new monetary initiatives resulted in a brutal reassessment of risk by investors.  Stock, commodity and precious metal markets all plunged with the Dow down 250 points, gold down by $41.60 per ounce  to $1,566 and silver off by 4.4% to $26.98.  Crude oil in New York trading was off 4%, dropping below $80 a barrel for the first time in eight months.
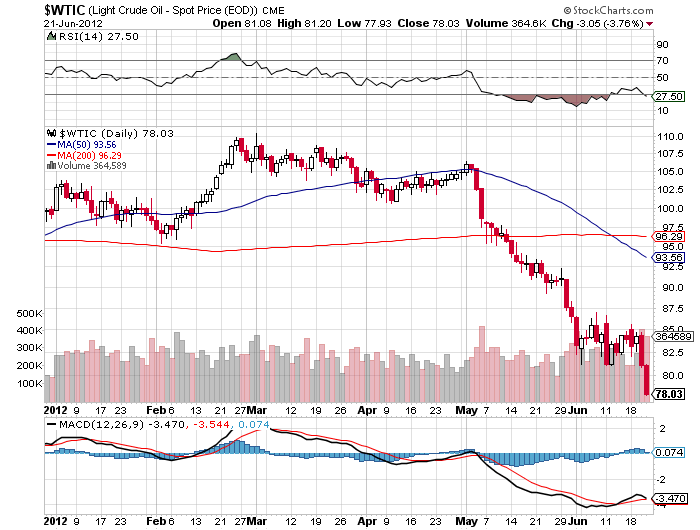
Since the end of May, the Dow had rallied over 700 points on rumors of massive coordinated central bank easing.  Investor optimism changed in a flash after yesterday’s FOMC announcement that Operation Twist would continue in an effort to further reduce long term interest rates.  Markets were clearly expecting more concerted action.  The Fed has already suppressed interest rates to all time lows with little to show for it.  In addition, the crisis in the Europe is on the verge of spinning out of control as insolvent sovereign states comically attempt to bail out insolvent banks.

The steep sell offs in oil and other commodities since early May have been a screaming warning sign of a steep slowdown in the global economy.   Further adding to investor concerns is the inability of policy makers to address fundamental economic problems that have beset the global economy since 2008.  Government borrowing, spending and a storm of money printing  has only made the fundamental problem of excessive debt burdens worse.  Now, as the world rapidly slides back into recession, we have to wonder – where do we go from here?


Oil - courtesy stockcharts.com

Gold - courtesy stockcharts.com

Despite Bernanke’s frequent remarks that “We stand ready to act” and his assertion that the Fed has many “tools in the toolbox”, the worst nightmare seems to be unfolding – a Fed that is out of options (or out of touch) as the world economy marches to the brink of a financial meltdown.

Will the world slide into a deflationary abyss as central banks stand aside and allow free markets to clear the debt excesses of the past two decades?  Not likely based on the entire history of the Federal Reserve.  What is highly likely, however, is that as the United States reaches the limits of credit expansion and taxation, neither the public nor our elected politicians will accept austerity as the road to restructuring the economy and national balance sheet.   Reality be damned as we reach the tipping point – the public will demand their entitlements and the politicians who resist will be voted from office.  The pressure on the central bank to “solve” our economic problems through an endless series of QE follies will result in a national financial nightmare.

Where does gold go from here as the world financial system totters on the brink?  No one can predict the short term moves in gold, but in a very uncertain world, there is one undeniable  dictum – “Gold is money.  Everything else is credit.”  (JP Morgan -1912).

Gold And The Dow Both At 12,000? – Here’s How It Could Happen

During his almost 20 year reign as Chairman of the Federal Reserve, Alan Greenspan’s easy money policies seemed to work like magic.  Ever lower interest rates and easy bank lending resulted in vast asset price inflation of both stocks and housing.  Flipping stocks and houses became the national past time as the asset bubbles continued to grow.  The average American envisioned a cushy retirement buoyed by ever rising housing values.

In 2004 George Bush nominated Alan Greenspan for an unprecedented fifth term as Chairman of the Federal Reserve, convinced that the “maestro” would continue to ensure a permanent national prosperity.  By the time Greenspan retired in January 2006, he had attained rock star cult status.  Who would have thought that a mere two years later, the 20 year Greenspan cycle of false “prosperity”, engineered through excessive borrowing, consumption and leverage would explode, hurtling the world into financial chaos?

Even worse, who would have thought that the same failed policies would be continued by Greenspan’s successor?  Bernanke’s attempts to re-inflate the burst bubbles of a past era are being defeated as a debt choked system crashes asset values as it deleverages.  Bernanke has proven himself to be equally maladroit at recognizing both housing bubbles and liquidity traps.

Meanwhile, the debt laden sovereign nations of the Eurozone are waking up to discover that their credibility in the bond markets has been vaporized.  How will it all end?  Some see hyperinflation in our future, others an all encompassing deflationary crash.  Either way, Vin Maru at TDV Golden Trader sees the Dow/gold ratio moving towards 1:1.

The Dow/gold Ratio Will Move Towards 1:1, Are You Positioned To Profit From It?

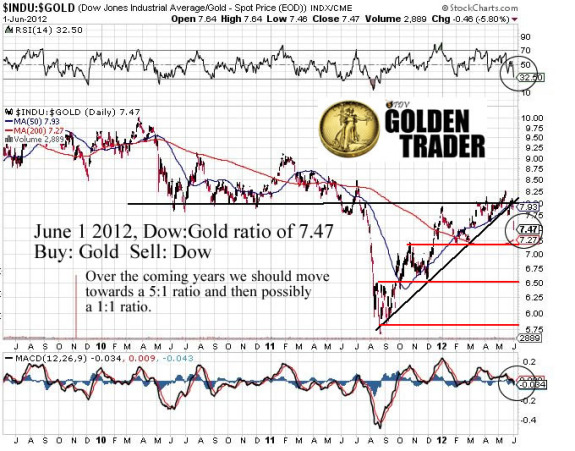
After spending the last month consolidating (around 8:1) the Dow/gold ratio broke down on Friday to close at 7.47.  This is a major shift, as the upward trend line in favour of the Dow since September has been broken with a significant drop.  This is a significant event that should trigger the selling of the boarder equity sector as money moves out of the Dow and S&P and into gold and related equities. Gold has once again become a safe haven as uncertainties around the Euro and fiat paper currencies persist. In addition, the growing consensus of a global economic slowdown and possibly a recession in the U.S. in the coming quarters, is bullish for gold.

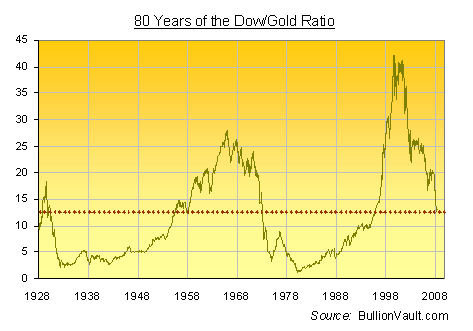
Gold is on the rise, especially compared to the Dow, as we move from a 7.5 ratio (Dow at 12,000 and gold at $1600) towards a 5:1 ratio and lower in the coming year.  Within a few years, we wouldn’t be surprised to see a Dow to Gold ratio of 1:1. History tells us that this ratio should be revisited again in the coming years.  If the longer term chart of the Dow/gold ratio is any indication of how quickly it will happen, it will be sooner rather than later. If you are invested in the broader stock market or mutual funds, this is the time to act and protect your wealth.  Once the final waterfall on the Dow develops and gold begins rising, it can move very quickly. By all indications on the charts and given the current market conditions, we believe it has already started.

HOW DO WE REACH THE DOW/GOLD RATIO OF 1:1?

The Inflationary Path

With the Dow now slightly above 12,000 and gold around $1620, the ratio is contracting fast as we move towards and below 5:1 in the coming years. How this will manifest itself is anyone’s guess at the moment.  If the Dow remains at 12,000, in an inflationary environment, gold will gravitate towards to the 1:1 ratio as it moves to a fair market value based on the outstanding debts and currency units floating around in the system. In the coming years, if the central bankers continue the path of papering over the financial mess that they have created, gold can easily reach $10K+. During a currency event, gold could climb to that price objective and it will take silver along with it.  If we return to the historical gold/silver ratio of 15:1, we could easily see silver at over $650 per ounce. Silver has been trading at around 55:1, and a currency event could move it towards the 15:1 ratio. At today’s price, silver has a lot of upside compared to gold.

Under this scenario, this assumes that currency inflation remains constant and that the financial markets continue to leave the Dow at 12,000.

The Deflationary Path

A deflationary spiral that unwinds debt around the world and leads to revaluations of paper currencies could also be in the cards.   The unravelling of the Euro could cause just such an environment. In this case, central bankers will not be able to stop the deflationary spiral that ensues as individuals start opting out of the paper/debt based system.  The bankers are pulling out all the stops and printing endless amounts of money to prevent this, but psychological forces can easily overwhelm this; economic law has a way of correcting imbalances created by man.   Under this scenario, the Dow will crash in a deflationary spiral towards gold’s price and possibly meet somewhere in the middle or at the lower end of gold’s trading range.

WATCH FOR 1:1

Either way, history has shown us that we are moving towards a long term cycle of low stock prices and higher gold prices; this should play out in the next few years, as it has already has started.  Trying to predict the price of gold is futile, what is most important is the Dow/gold ratio if 1:1.  Once we reach that objective or close to it, it will be time to get out of gold and move to other undervalued asset classes such as the Dow, until then stay long gold and short the Dow.

Once a trend based on fundamentals is in motion, it is very difficult to stop, as much as the masters of the paper universe would like to maintain control.  If a loss in confidence by the population of the world in purchasing power of fiat currency and  the value of the assets based on that paper price starts, (something we think has already started) then the there is no stopping this trend.  All the bankers can do is try and maintain the illusion of control, but eventually their efforts will fail.  The gold market senses this. As a result gold and gold related equities will outperform every other paper market and asset class moving forward for the next few years.  The price action on June 1, 2012 is just the beginning for the golden days ahead; just make sure your financial survival kit contains a percentage of gold, it may be the only thing that maintains its value as the paper currencies and paper assets around the world devalue compared to gold.

STRATEGY FOR HEDGING YOU PAPER ASSETS

Many of our readers already have a long position in physical gold and positions in several key mining companies and juniors.  We have kept a core position in the gold sector and will continue to add on additional weakness.  We are also evaluating potential gold producers and precious metals juniors/explorers which will have significant upside in the coming years as the nominal value of gold rises compared to other asset classes.

If you are looking for ideas and strategies for protecting your wealth and trading opportunities in the precious metals sector, please visit our site and sign up for our regular updates and blog posts.  We regularly provide technical analysis on the price of gold and the HUI index which can help you identify good entry and exit points for trading.

Gold and Silver Bullion Coin Sales Rebound Strongly In May

According to the latest report from the U.S. Mint, sales of both gold and silver bullion coins rebounded strongly during May.

Sales of the American Gold Eagle bullion coins during April had declined to only 20,000 ounces, the lowest monthly sales since June 2008 when 15,500 ounces were sold.  During May, the U.S. Mint sold 50,000 ounces of gold bullion coins, up 150% from April sales of 20,000 ounces.

The monthly sales figures for bullion coins can vary dramatically for a number of reasons, but support for the increase in demand during May may be due to the recent pullback in gold prices.  During May, the closing London PM Fix Price for gold declined by 6.3% from $1,664 to $1,558 per ounce.  Through the end of May, gold has declined by $40 from $1,598 at the beginning of 2012.  Gold reached a 2012 high of $1,781 on February 28th.

Sales of the American Eagle gold bullion coins hit a record high during the financial turmoil of 2009 as investors eagerly purchased 1,435,000 ounces of gold.  Ironically, sales of gold declined during the next two years despite the fact that the financial system has become more unstable as sovereign governments worldwide continue to borrow and print fiat money on an unprecedented scale in an effort to prop up a world economy burdened by unsustainable debt levels and nonexistent economic growth.  The ongoing simultaneous collapse of the banking systems and economies of the Eurozone is the most obvious trigger for the next phase of the financial crisis.  As confidence in paper money evaporates, expect gold to soar as investors stampede into the only currency that governments cannot debase.

Gold Bullion U.S. Mint Sales By Year
Year Total Sales Oz.
2000 164,500
2001 325,000
2002 315,000
2003 484,500
2004 536,000
2005 449,000
2006 261,000
2007 198,500
2008 860,500
2009 1,435,000
2010 1,220,500
2011 1,000,000
2012 280,500
Total 7,530,000
Note: 2012 totals through May 31, 2012

Sales by the U.S. Mint of the American Silver Eagle bullion coins for May almost doubled from the previous month.  Total sales of  silver bullion coins for May totaled 2,750,000 ounces, up 81% from sales of 1,520,000 ounces in April.  Year to date sales of the American Silver Eagle bullion coins through May 31st came in at 14,409,000, down by 23.8% from the first five months of 2011.  Sales of the silver bullion coins reached all an all time high during 2011.   Since reaching a multi decades high of $48.70 during April of 2011, silver has since corrected, closing out the month of May 2012 at $28.10.

Total annual U.S. Mint sales of the American Silver Eagle bullion coins since 2000 are shown below.  Sales totals for 2012 are through May 31.

In addition to gold and silver bullion coins, the U.S. Mint also sells numismatic versions (uncirculated and proof) of gold and silver American Eagle coins which can be purchased by the public directly from the U.S. Mint.  Gold and silver bullion coins are sold by the U.S. Mint only to authorized purchasers who in turn resell them to the general public and secondary retailers.

American Silver Eagle Bullion Coins
YEAR OUNCES SOLD
2000 9,133,000
2001 8,827,500
2002 10,475,500
2003 9,153,500
2004 9,617,000
2005 8,405,000
2006 10,021,000
2007 9,887,000
2008 19,583,500
2009 28,766,500
2010 34,662,500
2011 39,868,500
2012 14,409,000
TOTAL 212,809,500

Are Gold And Silver Bullion Sales Reported To The IRS? Tips For Keeping Bullion Sales Private

Long term gold and silver investors who have gradually accumulated physical precious metals over the years have seen the value of their holdings increase substantially when measured against the value of the paper dollar.   Astute investors realize that a large part of the “gains” on their precious metals have merely preserved purchasing power compared to paper money which has been consistently debased by the monetary and fiscal policies of the government and federal reserve.
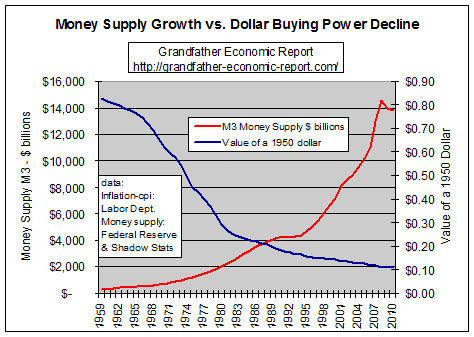
In the eyes of the taxing authorities, however, the increased value of an investment due to inflation is still considered a gain regardless of whether or not there was an increase in purchasing power.  As the chart below graphically depicts, a $4,000 investment made in 1986 and now worth $8,000 is still worth only $4,000 in purchasing power -thus the true economic gain is zero.  Try telling that to the IRS!  After paying long term capital gains on the phantom $4,000 “profit”, you are left with less that you had in 1986.

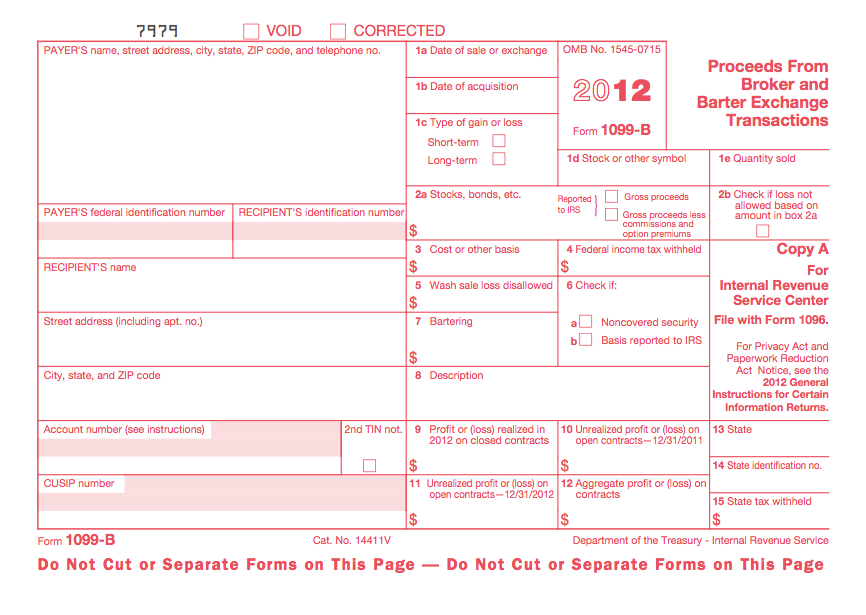
There is, however, a silver and gold lining for investors in physical precious metals since, under many circumstances, the sale of your gold and silver bullion is not reported to the IRS.  There are circumstances, however, in which a bullion dealer is required to file a Form 1099-B with the IRS which reports sales transaction proceeds, name, address and social security number.  It is obviously important to most investors to know what types of sales are kept private and what types of sales are reported to the IRS.

Thanks to our friends at GoldSilver.com, here is the essential up to date information that you need to know before selling gold and silver bullion.

Before we begin, the following information covers aspects of investor privacy, not an investor’s responsibility to pay income tax gains on any profits made from the purchase and sale of investment grade bullion products.  For tax questions, please seek professional tax consul.

We know investor privacy is very important to physical silver and gold purchasers and confidentiality is one of the values we covet most along with our customers.

For some bullion investors, ensuring themselves a private sale is their most important objective and we understand the myriad of reasons as to why this is so.

That being said, we must always adhere to the rules of our industry.

Being a bullion dealer, we are often asked by customers questions like…

– Are my transactions private?

– When I sell my gold bullion or silver bullion, is it a private transaction, or is it reported to the IRS?


First, when a customer buys from our dealership, the transaction is private.

We have specifically designated the current payment method options on our website so that investors who buy bullion from us, do so in confidentiality.

Secondly, when an investor sells their gold bullion or silver bullion to a dealer like us, some of these trades are private while some are not.

Depending upon what you are selling will depend upon whether the powers that be require us as a bullion dealer to fill out something called an IRS 1099-B Form.


IRS 1099 Gold Reporting & Silver Reporting

When you sell your bullion back to a dealer, the pertinent questions for a dealer are:

1) What form of gold and or silver bullion are you selling?

2) What amount of silver bullion and or gold bullion are you selling?


The following covers private investor sales of bullion products we currently offer at GoldSilver.com.

1099 EXEMPT PRIVATE SILVER BULLION

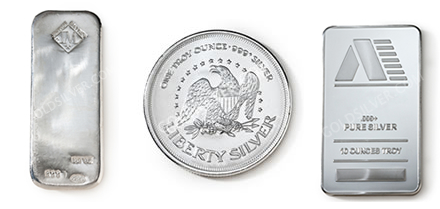
Private silver bullion ( IRS 1099 Form exempt ) consists of any quantity sold to a dealer of the following items:

– American Silver Eagle Coins

– Canadian Maple Leaf Silver Coins

– Austrian Philharmonic Silver Coins


1099 REQUIRED SILVER BULLION

Reported silver bullion ( IRS 1099 Form required ) consists of 1000 ounces or more sold to a dealer of the following items:

– .999 fine silver bullion bars  (any sizes)

– .999 fine silver bullion rounds  (any sizes)


1099 EXEMPT PRIVATE GOLD BULLION

Private gold bullion ( IRS 1099 Form exempt ) consists of any quantity sold to a dealer of the following items:

– American Gold Eagle Coins

– American Gold Buffalo Coins

– Gold Austrian Philharmonic Coins


1099 REQUIRED GOLD BULLION COINS

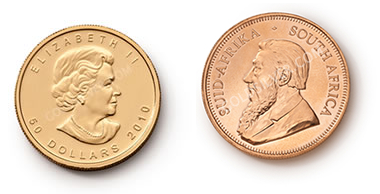
Reported gold bullion coins ( IRS 1099 Form required ) consists of 25 ounces or more sold to a dealer of the following items:

– Canadian Gold Maples (1 oz)

– South African Krugerrands (1 oz)


1099 REQUIRED GOLD BULLION BARS

Reported gold bullion bars ( IRS 1099 Form required ) consists of 32.15 ounces or more sold to a dealer of the following items:

– .999 fine gold bullion bars (any sizes)

***

These are the IRS 1099-B Form reporting requirements for the bullion products we offer at GoldSilver.com as of May 2012.

Stay tuned to GoldSilver.com for any future news or proposed changes to the current IRS 1099 gold and silver reporting requirements.

Correction In Gold and Gold Stocks Spells Opportunity For Long Term Investors

It is no secret that the price of gold has been declining since reaching almost $2,000 per ounce last year.   After rallying in the early part of the year, gold prices have now fallen to $1,556, representing a decline of $42 per ounce or 2.6% below the closing price on the first trading day of 2012.

The devastating declines in the stock prices of major gold mining companies since early 2012 have been far out of proportion to the decline in the price of gold bullion.  Viewing the gold stocks in isolation, one would assume that the price of gold had collapsed by hundreds of dollars per ounce.

While opinions vary on where we go from here, the deeply bearish price action and bearish press articles on gold and gold stocks lead this writer to believe that we are setting the groundwork for a major rally at some point in the future.  Actions by global central banks to prevent a collapse of the financial system via the creation of oceans of newly printed paper currencies leads to the inevitable conclusion that at some point gold and gold stocks will soar far beyond the most bullish gold price forecasts.  As always, however, the question is the timing of gold’s ascent.

TDV Golden Trader has examined the current factors impacting the gold market and cautions that a return to new highs in gold, gold stocks and silver, although inevitable, may not be imminent.

Is This The Bottom For Gold and Gold Stocks? Not So Fast…

Since the speculative highs of 2011, the precious metals are continuing to correct and head lower, even in the face of Operation Twist and the ECB’s Long Term Refinancing Operation (LTRO) printing.  And with the elections in France and even more socialism on its way, it looks like Euroland is ready to run the printing press again and the Fed will join the party. But I am not convinced that gold and silver will take off right away.  Everyone knows that the central banksters are running the printing presses on overtime, so in effect, we always had and always will have QE, yet the price of the metals continues to drift lower.

When comparing the 2007-2008 peak and crash to what we are dealing with now, I think we have to look beyond the chart patterns and timing.  Looking at market conditions and sentiment for clues to turning points is just as important.  Back in ’08 we had a liquidity event which caused the nose dive in the markets.  Once the system was liquefied by TARP and then QE, the precious metals came bouncing back fairly quickly and then went on to make new highs right after QE2.

We appear to be in a period where the gold price will not run away quickly anytime soon, but we are also in the midst of a long drawn out liquidation of the metals as the central banksters keep accumulating gold at lower prices. Many central banks have been net buyers and importers of gold, and that trend looks sure to continue.  So, where is the selling coming from?

FROM WHERE COMES THE SELLING?

The paper selling we are witnessing is most likely squeezing the weak hands into coughing up their gold. Hopefully it’s only paper gold that is getting liquidated.  Investors in gold and silver may get frustrated and then capitulate into selling as the paper pushers continue to force them out of their positions.  But there are two potential catalysts that could reverse this trend:

1. If the shorts are forced to cover their position and decide to jump on the long side
2. The paper traders are forced to deliver the physical, which will most likely never happen.

Black swans are always lurking in the background, but they have yet to rear their ugly heads and the gold market is not anticipating any of them at the moment.  Until they appear, the precious metals may continue to drift lower.

The metals have been in a great bull run for the last decade.  But, what we haven’t seen yet is a 1974 style peak and trough that lasts for a couple of years. That is where we could be heading with precious metals right now.  In September of 2011, the price of gold peaked over $1900 and ever since then has been correcting lower (now almost nine months later).  During 1974 the peak price was just under $200 at which point it went into a tail spin falling to just above $100 in the summer of 1976.  After the negative trend continued for almost 2 years and then a sideways base during 1977, the gold bull market raced to its 1980 high around $850.

Until we see the fundamental shift back to gold, we are more than likely to continue correcting and then build a base just like in the mid 1970s.  The one thing to note is that gold peaked in early 1974, corrected for about six months and then went on to make a high by the end of 1974 before the major correction started that lasted almost two years. If a similar scenario plays out, then the correction we are currently in may end at the support and third test of the $1550 price range.  If this is the case, we could see a strong rally which would take the price of gold right back up to $1900 or higher before starting another bear phase in the long term bull market.

THE END MAY NOT BE NEAR

This standstill could last for some time still.  Especially since all the “speculators” are getting wrung out of the system as they have been taken to the cleaners in the last year.  More than likely, the average investor will stay away from precious metals until we have a major currency crisis.  Something that is more than just the problems that we currently see in Euroland. Until then we can expect the downtrend to continue and move sideways. If this scenario plays out like it did in the mid 1970s, we could still be in a period of time where the gold price continues to correct lower. This could bring the price of gold towards $1200-$1400 in the coming year.

If gold can hold support at $1530, then this correction may be over and the price of gold will continue higher toward the end of this year or early next year.  If the broader stock market continues to sell off, the Fed may pull the trigger on more easing, which could reverse gold’s negative trend and then we are looking at a target price of around $2100.

There seems to be no consensus among investors or analysts on which way the price of gold will go from here. But if the mid 1970s bull market in gold is any guide, be mentally prepared for a lower price. Then be ready to take advantage of the coming basing period and average down on your physical holdings at these lower prices. If the correction is over and we get a strong bounce from here, expect higher prices and a much better opportunity to sell.  We are currently in the eye of the storm of The End Of The Montetary System As We Know It (TEOTMSAWKI).  The pain is not over yet and neither is this gold bull market, the looming currency and debt crisis will make sure of that.  Just remember that the hardest thing to do as a trader and investor is to stay long for the full extent of the bull market.  This rough patch is again testing the mettle of investors.

THE TDV GOLDEN TRADER STRATEGY AND OUTLOOK

We have been lucky to have played the last six months almost perfectly.  We were strong buyers of the junior gold stocks throughout December and then after they rose significantly on March 2nd we issued a dispatch to TDV Golden Trader subscribers entitled, “Trade Alert: Close Out Many Of Our Trading Positions”.  We sold most of our trading positions on that day… something that has worked out tremendously well as shown by the chart of Market Vectors Junior Gold Miners ETF (GDXJ).

Will this be the bottom?  Nobody knows.  But we are remaining patient and waiting until we see the whites of their eyes before we reload and buy back in.  In the meantime we are advising subscribers to do the same and looking for stink bid opportunities to buy some of our favorite gold stocks at ludicrously low prices should a seller need to get out in an illiquid market.

Gold And Silver Bullion Coin Sales Plunge In April – What Is John Q Public Thinking?

The latest sales figures from the U.S. Mint show a continuing trend of lower gold bullion coin sales. Sales of American Gold Eagle bullion coins hit an all time high in 2009 when the Mint sold 1,435,000 ounces. During 2010, sales declined to 1.2 million ounces and in 2011 only 1 million ounces of gold bullion coins were sold.
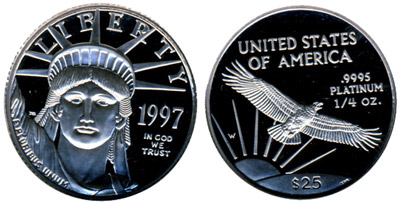
Sales of the American Gold Eagle bullion coins in April totaled only 20,000 ounces, the lowest monthly sales figure since June 2008 when 15,500 ounces were sold.  Total year to date gold bullion sales of 230,500 ounces through April 2012 are down a substantial 43% from the first four months of 2011 when the U.S. Mint sold 407,500 ounces.

If sales of the American Eagle gold bullion coins continue at their present pace, 2012 could turn out to be the fourth year in a row of declining sales.

Gold Bullion U.S. Mint Sales By Year
Year Total Sales Oz.
2000 164,500
2001 325,000
2002 315,000
2003 484,500
2004 536,000
2005 449,000
2006 261,000
2007 198,500
2008 860,500
2009 1,435,000
2010 1,220,500
2011 1,000,000
2012 230,500
Total 7,480,000
Note: 2012 totals through April 30, 2012

Total sales of the American Silver Eagle bullion coins for April 2012 totaled 1,520,000 ounces, down from 2,542,000 ounces in March.  Year to date sales of the Silver Eagle coins through April 30 totaled 11,659,000 ounces, down by 23.5% from total sales of 15,248,000 ounces in the first four months of 2011.  Sales of the American Silver Eagle bullion coins reached an all time record high of 39,868,500 ounces during 2011.

Shown below are the U.S. Mint sales figures for the American Silver Eagle bullion coins since 2000.  Sales totals for 2012 are through April 30th.

American Silver Eagle Bullion Coins
YEAR OUNCES SOLD
2000 9,133,000
2001 8,827,500
2002 10,475,500
2003 9,153,500
2004 9,617,000
2005 8,405,000
2006 10,021,000
2007 9,887,000
2008 19,583,500
2009 28,766,500
2010 34,662,500
2011 39,868,500
2012 11,659,000
TOTAL 210,059,500

The American Gold and Silver Eagle bullion coins cannot be purchased by the public directly from the U.S. Mint. Instead, the Mint sells the coins to a network of authorized purchasers who in turn resell them to the public and secondary retailers.

Sales figures shown above do not include U.S. Mint sales of gold and silver Eagle numismatic coins.  The public is allowed to purchase numismatic versions (uncirculated and proof) of gold and silver coins directly from the U.S. Mint and sales of these coins have also been declining during 2012.

According to Mint News Blog, sales of the 2011 Proof Gold Eagles declined by about 50% from 2010 and sales of the 2012 Proof Gold Eagles have declined by over 60% from the previous year.  The same trend has been seen in the proof version of the American Silver Eagle with 2012 sales down 19% through April.

There are a number of factors likely contributing to the drop off in sales. Over the past few years, the US Mint has caught up with demand for bullion coins, allowing more certainty for the numismatic offerings. The sense of urgency and pent up demand that characterized the product return in 2010 has greatly diminished. There also seems to be a shift away from precious metals in recent months, with some moving back to collector coins. Sales of the US Mint’s Gold Eagle bullion coins were down 30% in the first quarter.

Gold prices may also be having an impact in various ways. For the past two years, the Proof Gold Eagles were released in an environment of rising prices. For the current year, prices have fallen over the past two months leading up to the release. Despite this recent drop, the initial prices for this year’s offerings were higher by the equivalent of $200 per troy ounce compared to last year, possibly making affordability a factor for some collectors. Finally, some collectors may have been delaying orders in anticipation of the price decrease which will take place later today.

With the world economy on the brink of collapse in 2008, Americans decided that they needed to prepare for a financial hurricane and subsequently purchased record amounts of both gold and silver.  Perhaps the public has not noticed that a financial crisis potentially worse than 2008 (and certain to impact the U.S. economy) is brewing “across the pond” with European governments and banks tottering on the brink of insolvency and many countries already in full blown depressions.

With the global economy drowning in debt and facing unprecedented financial problems, it is almost comical that many Americans are avoiding the only asset class able to preserve their wealth.

Gold and Silver Bullion Coin Sales Rise In March

Production figures from the U.S. Mint for March show a sharp increase in the sale of both gold and silver bullion coins from the previous month.

Total sales of the American Gold Eagle bullion coins increased in March to 62,500 ounces, up from 21,000 ounces in February.  Total sales of the American Silver Eagle bullion coins totaled 2,542,000 ounces in March, up from 1,490,000 ounces in February.  Sales of both bullion coins for the first quarter of 2012, however, declined from the prior year.

Sales of the American Gold Eagle bullion coins totaled 210,500 ounces for the first quarter of 2012, down 29.7% from the 299,500 ounces sold in the first quarter of 2011.  Total sales of the American Silver Eagle bullion coins amounted to 10,139,000 ounces during the first quarter of 2012, down by 18.4% from the 12,429,000 ounces sold in the prior year’s first quarter.

The all time record year for sales of the American Gold Eagle bullion coins occurred in 2009 with 1,435,000 ounces sold.  The all time high record for sales of the American Silver Eagle bullion coins was in 2011 when a total of 39,868,500 one ounce coins were sold.

Gold Bullion U.S. Mint Sales By Year
Year Total Ounces Sold
2000 164,500
2001 325,000
2002 315,000
2003 484,500
2004 536,000
2005 449,000
2006 261,000
2007 198,500
2008 860,500
2009 1,435,000
2010 1,220,500
2011 1,000,000
2012 210,500
Total 7,460,000
Note: 2012 totals through March 31, 2012

The amount of physical gold bullion purchased purchased from the U.S. Mint over the past 12 years remains relatively small compared to the amount of gold invested in the two largest gold trust ETFs.  The SPDR Gold Shares ETF (GLD) is the world’s largest physically backed gold exchange traded ETF fund with current holdings of 41.4 million ounces of gold.  The iShares Gold Trust ETF (IAU) currently holds 6.2 million ounces of gold.

The total sales of gold and silver bullion coins detailed above do not include U.S. Mint gold and silver numismatic coin sales which are directly sold to the public.  American Gold and Silver Eagle bullion coins are only sold to a network of authorized purchasers  who in turn resell the coins to secondary retailers and the public.  The U.S. Mint decided that using  Authorized Purchasers to sell gold and silver bullion coins to the public was the most efficient means of selling the coins to the public at competitive prices.

Shown below are the U.S. Mint sales figures for the American Silver Eagle bullion coins since 2000.  Sales totals for 2012 are through March 31st.

American Silver Eagle Bullion Coins
YEAR OUNCES SOLD
2000 9,133,000
2001 8,827,500
2002 10,475,500
2003 9,153,500
2004 9,617,000
2005 8,405,000
2006 10,021,000
2007 9,887,000
2008 19,583,500
2009 28,766,500
2010 34,662,500
2011 39,868,500
2012 10,139,000
TOTAL 208,539,500

What Precious Metal Has Performed Best In 2012 And Where Do We Go From Here?

After the recent volatility in precious metals, let’s take a look at the year to date performance of gold, silver, platinum and palladium.  The new year started off with a strong rally across the entire precious metals group which erased some of the losses seen in the second half of 2011.

The across the board rally in precious metals came to an abrupt halt in early March after serial dollar printer Fed Chairman Bernanke made comments suggesting that further quantitative easing was unnecessary (see The Flash Crash In Gold).  Gold, which had closed at $1781 on February 28, sold off sharply, losing $136.75 per ounce by March 14.  Silver, platinum and palladium also sold off and are currently below the highs of the year seen in late February.

The precious metal with the largest gain to date for 2012 is platinum with an impressive 19% gain.  Silver is up 12.72% on the year, followed by palladium with a 5.72% gain and gold is now in last place with a year to date gain of 4.5%.

Platinum may be the most undervalued of all the precious metals based on the fact that the platinum to gold ratio is at levels not seen since 1986  (see Platinum To Gold Ratio Plunges – Buy Signal or New Metric?).

GOLD SILVER PLATINUM PALLADIUM
JAN 3RD $1,590.00 $28.78 $1,406.00 $664.00
MARCH 19TH $1,661.50 $32.44 $1,673.00 $702.00
$ GAIN $71.50 $3.66 $267.00 $38.00
% GAIN 4.50% 12.72% 19.00% 5.72%

Based on previous history, serious precious metal investors probably gave little credence to Bernanke’s suggestion that further Fed monetary easing was not in the cards.  Indeed, barely a week passed before the Fed Chairman was again discussing a new version of quantitative easing known as “sterilized bond-buying.” The always astute James Grant of Grant’s Interest Rate Observer, dismissed the notion that central bank money printing was about to end anytime soon.  In a recent interview with Bloomberg Television, Grant had this to say.

The price of gold is the reciprocal of the world’s faith in the deeds and words of the likes of Ben Bernanke. The world over, central banks are printing money as it has never been printed before. The European Central Bank has increased the size of its balance sheet at the annual rate of 89%. It’s amazing. The Fed is far behind at only 15%. The Bank of England 67% over the past few months. These are rates of increases in the production of paper currencies we have never seen in the modern age. It takes no effort at all. They simply tap the computer screen.

The full interview with Grant is well worth listening to and can be accessed below.

Where do we go from here in what could turn out to be a very interesting year for precious metals?  Here’s a brief roundup of interesting thoughts and analysis from around the web.

The Golden Trader discusses paper trading and manipulation of precious metal prices along with a technical assessment of gold and silver.

Mint State Gold explains why “all the major signs are showing that the quality rare coin market is starting its long awaiting rally. Let me explain why we could see a 30% move higher by year end.”

Why financial repression should be the focus of investor attention.