May 6, 2024

Silver ETF Holdings Increase Slightly In January As The Stealth Silver Advance Continues

Silver has started off the new year with a scorching performance

For the month of January, silver gained $5.42 per ounce closing at $33.60, up 19.2% from the 2011 closing price of $28.18.  January’s gain has more than erased the 8.1% loss on silver during 2011.  Silver has far outperformed gold which closed at $1,738.00 on January 31st, up 10.4% on the month from the 2011 closing price of $1574.50 (all prices from the closing London PM Fix Price).

The large gain in silver’s price has been somewhat of a stealth advance, with little coverage in the press.  In addition, an apathetic response to silver by investors can be seen in the volume statistics and bullion holdings of the iShares Silver Trust (SLV).

Silver holdings of the iShares Silver Trust reached a record 11,390.06 tonnes on April 25, 2011, shortly before silver reached its peak price of $48.70 on April 28th.  The value of silver held by the SLV on April 28th was $17.3 billion compared to its current value of $10.4 billion, representing a decline in both the price of silver and total ounces of silver held by the Silver Trust.

Although silver prices have soared since the beginning of the year, holdings of the SLV have increased only modestly.  At the end of 2011, the SLV held 9,605.79 tonnes of silver compared to 9,608.95 on January 31, 2012, a negligible increase of only 3.16 tonnes.  The small increase in silver held by the iShares Silver Trust indicates that investors are not participating in the silver rally, a very bullish sign from a contrarian point of view.

The silver ETF is structured in a somewhat complicated manner in which authorized participants (AP) buy or sell shares of the SLV depending on the discount or premium of the SLV to the market price of silver.  High buying demand for the SLV results in premium pricing which results in the accumulation of physical silver by the trust due to hedging activity by the APs.

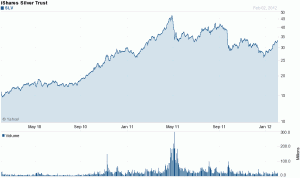
SLV - courtesy yahoo.com

Investor indifference to the silver rally can also be seen in the low volume trading of the iShares Silver Trust.  We are nowhere close to the high volume seen last May that preceded the rapid correction in silver prices.  The low trading volume in the SLV, despite rising prices, is bullish from a contrary viewpoint since it suggests that many investors are still on the sidelines.  As these sideline investors start buying, prices will continue to advance.

Also supporting future price advances by silver is the relentless physical demand for silver as seen in the record purchase volume of the American Silver Eagle bullion coins.  Sales of the silver bullion coin hit at all time record of almost 35 million coins during 2011. Large demand continues in January with the U.S. Mint reporting sales of over 6 million ounces.  2012 could turn out to be a sterling year for silver.
Gold Bullion Coin Sales Soar By 94% In January As Confidence In The Dollar Crumbles

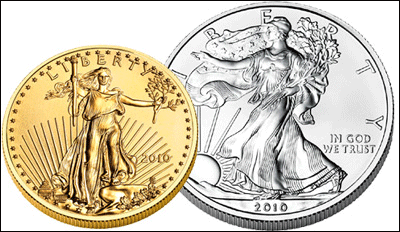
According to the latest production figures from the U.S. Mint, January sales of American Gold Eagle bullion coins soared by 93.8% over the previous month.

A total of 127,000 ounces were sold in January compared to 65,500 ounces in December 2011.  The surge in demand for gold bullion coins is now at the highest level since January 2011 when 133,500 ounces were sold.

Investors are taking opportunity of the bargain price of gold which remains below last year’s high.  After hitting a London PM Fix price of $1,895 on September 6, 2011, gold sold off by 19.2% to a closing low of $1,531.00 on December 29, 2011.

Since the beginning of the year, the price of gold has steadily advanced.  The closing London PM Fix price of $1,744.00 on January 31st represents a gain of $213 per ounce for the month, up 13.9% from the 2011 year end price.  The price of silver has also advanced strongly in 2012 with a gain of 26.8% from last year’s low amid record breaking demand for the American Silver Eagle bullion coins.

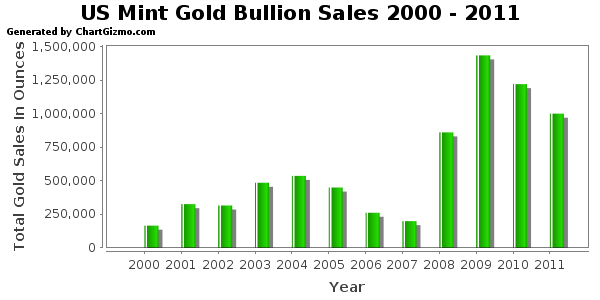
Sales of the American Gold Eagle bullion coins hit an all time record in 2009 when 1,435,000 ounces were sold.  A summary of annual gold bullion sales since 2000 is shown below.

Total yearly gold bullion coin sales from January 1, 2000 to January 31, 2012 are shown below.

Gold Bullion U.S. Mint Sales By Year
Year Total Ounces Sold
2000 164,500
2001 325,000
2002 315,000
2003 484,500
2004 536,000
2005 449,000
2006 261,000
2007 198,500
2008 860,500
2009 1,435,000
2010 1,220,500
2011 1,000,000
2012 127,000
7,376,500
Note: 2012 total through January 31, 2012

The huge demand during 2009 for gold bullion coins came in the wake of the 2008 financial system meltdown as investors sought a safe haven from paper assets.  Here we are four years later and the financial system is more fragile than ever with insolvent banks  and governments being propped up by central banks that are printing money on a scale previously unimaginable.

Although I have been a precious metals investor for many years (more sometimes than I care to think about), many of the people I deal with on a personal  and professional level seemed to be totally confident holding only paper assets, even after the financial system came very close to a total collapse in 2008.

That confidence now seems  to be slowly but persistently eroding and I am seeing many people enter the precious metals market for the first time.  It is not an “all in” seismic shift but rather a thoughtful and fundamental portfolio reallocation based on the growing realization that paper dollars are being constantly debased.

A one time bout of money printing by the Federal Reserve to “save the system” can perhaps be quickly forgotten, but a persistent and deliberate effort to debase the currency is another matter.  The growing realization that the Federal Reserve is deliberately destroying the integrity of the dollar will be the basis for continual future demand for the only real money left – gold.

The growing movement to reallocate wealth into gold is still in its infancy which implies a future gold value many thousands of dollars higher than today’s price.

There’s No Reason Gold Stocks Should Be So Cheap – Newmont Mining On The Bargain Rack

Over the past five years, gold bullion has dramatically outperformed the average gold stock.  Reasons why bullion has outperformed gold stocks include an investor preference for physical gold and the inability of gold miners to produce earnings gains commensurate with the increase in the price of gold.

The end result of investor aversion to gold stocks has resulted in many quality gold stocks, such as Newmont Mining (NEM), winding up on the bargain rack.  Newmont Mining is one of the world’s largest gold producers that has positioned itself for profitable growth after restructuring its operations.  Newmont Mining management is forecasting a 35% increase in gold production to 7 million ounces annually over the next six years.

Revenue growth at Newmont has grown by 10% annually over the past 10 years.  Earnings per share increased from $.45 per share in 2002 to $4.68 per share in 2010.  For the year ending December 31, 2010, gross margins hit a record 61%, cash holdings increased to $4.1 billion and revenues climbed by 23% to $9.5 billion.  Newmont Mining has a dividend yield of 2.3% with a very low payout ratio of 18% and is committed to increasing the dividend in line with the increase in the price of gold.  Newmont’s total proven and probably gold reserves of 93.5 million ounces are valued at only $285 per share.

Newmont Mining - courtesy yahoo finance


In this week’s Barron’s Roundtable, analyst Fred Hickey talks about Newmont Mining and why he is bullish on gold.

Hickey: Newmont Mining [NEM], which I recommended last year, outperformed. [The stock rose 5.5% through Dec. 30.] The driver is gross margin expansion. Gold prices are up by a factor of six through this bull market, yet costs have roughly doubled. The company has had tremendous cash flow, leading to dividend increases. Newmont has tied its dividend policy to the gold price. If the price rises, you are guaranteed more dividends. The money won’t be wasted on bad acquisitions. In 2008 Newmont earned under $2 a share. It could earn $4.82 for 2011, and $5.96 in 2012. There’s no reason these stocks should be so cheap.

As Felix has said, owning physical gold is important. In addition, you can own gold through exchange-traded funds, such as the GLD [ SPDR Gold Shares]. They are audited. The U.S. government’s gold holdings haven’t been independently audited in decades. The GLD charges fees of 0.40% of assets. The IAU, or iShares Gold Trust, charges only 0.25% of assets. It trades for about a hundredth of the price of gold, so it is selling for $15.76 a share. It has been around since 2005 and has $9 billion in assets and 171 tons of gold. It stores its gold in vaults around the world. Last year I recommended stocks. This year I like the GDX, or Market Vectors Gold Miners ETF. It gives you diversification with 31 names, including a few silver stocks. Barrick Gold [ABX], Newmont and Goldcorp [GG] account for 41% of assets. At some point gold stocks will outperform bullion.

Newmont is currently selling at a steep discount to the underlying value of its gold reserves.  As the price of gold continues to rise, the stock will eventually reflect the fundamentals and could easily double from current levels.

Major Buy Signal For Gold And Why Stock Markets Are Ignoring Predictions Of Economic Collapse

Predictions that the global economic system will collapse have been coming at an accelerated pace lately.  Usually, many of  the most extreme scenarios are from sources more interested in gaining publicity rather than offering a balanced analysis.

What’s unusual is that lately, many of these apocalyptic predictions are coming from some of the most normally sedate institutions in the world such as the IMF and the World Bank.

Central bankers and the heads of world financial organizations usually speak in oblique and obfuscated terms designed to convey confidence.  Either the financial powers are writing a new book of rules or we are all headed for some unimaginably horrific scenario of financial and social chaos.

Here’s a small sample of the latest warnings from the sedate and not so sedate.

IMF Chief Warns Europe Must Fuel Growth

BERLIN—The head of the International Monetary Fund warned that in addition to cutting yawning budget deficits Europe needs to do more to promote growth and stop the crisis from spreading to the world economy.

“It is about avoiding a 1930s moment, in which inaction, insularity, and rigid ideology combine to cause a collapse in global demand,” IMF Managing Director Christine Lagarde said before the German Council on Foreign Relations. “A moment, ultimately, leading to a downward spiral that could engulf the entire world,” she said.

World Bank Projects Global Slowdown

“Developing countries need to evaluate their vulnerabilities and prepare for further shocks, while there is still time,” said Justin Yifu Lin, the World Bank’s Chief Economist and Senior Vice President for Development Economics.

Developing countries have less fiscal and monetary space for remedial measures than they did in 2008/09. As a result, their ability to respond may be constrained if international finance dries up and global conditions deteriorate sharply.

“An escalation of the crisis would spare no-one. Developed- and developing-country growth rates could fall by as much or more than in 2008/09” said Andrew Burns, Manager of Global Macroeconomics and lead author of the report. “The importance of contingency planning cannot be stressed enough.”

Feliz Zulauf Sees More Trouble Ahead

Felix Zulauf: Yes, I believe the peripheral nations have entered recession territory, and I believe it will get worse.

So, the situation in Europe will get worse before it gets better. Moreover, the ECB, which has its roots in the German Bundesbank, will see to it that the ECB does not become the lender of last resort until they are absolutely forced into it by the market. For investors, this is very important to understand. The new leader Mr. Draghi may leave Trichet’s conservative path, however, as since he is in power he has talked one way and acted in another way. This is delicate as the credibility of the ECB could be lost quickly.

Euro Breakup Would Cause Global Meltdown

In his speech at Davos, Soros will say it is “now more likely than now” that Greece will formally default in 2012, Newsweek said. Soros nevertheless thinks the euro will survive, according to Newsweek.

The world is facing a period of “evil,” Soros said, adding that he foresees Europe descending into chaos and conflict, while rioting in the streets of the U.S. will lead to a curtailment of civil liberties and the global economic system possibly collapsing altogether, Newsweek reported.

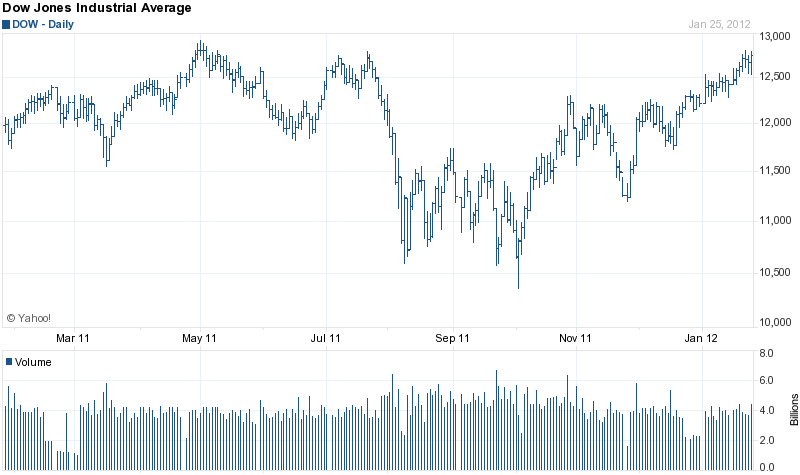
All of the risks to global prosperity mentioned above have been well known by investors for months now.  The day the IMF Chief warned of a global depression worse than the 1930’s, the Dow Jones yawned and drop by 10 points.

Is there a major disconnect from reality by U.S. investors or has the worst already been discounted after the steep stock market sell off last August?  Ever since an inside out day on October 3 of last year, the Dow Jones has powered higher, ignoring all the bad news and warnings of Armageddon.  Exactly what is going on?


Dow Jones - courtesy yahoo.com

The answer is positive for both stocks and gold.  The “collective wisdom” of the markets saw a resolution to the imminent threat of the European debt crisis last fall, and that resolution is known as quantitative easing.  As previously noted in this blog last December, Every Solution To the Euro Crisis Involve Printing Money, which is exactly what happened.  Both the European Central Bank (ECB) and the Federal Reserve stand ready to print whatever quantity of money is required to paper over the European and U.S. debt crisis.

The massive first phase of the ECB’s Long Term Refinancing Operation advanced about $780 billion to Europe’s insolvent banking system, buying time and postponing the day of reckoning.  The ECB will hold a similar operation in February.

Long term this does little to solve Europe’s fundamental problems, but is short term bullish for stocks and extremely long term bullish for gold and silver.


The Gold Bubble Myth – Investors Remain Underinvested In Gold

The chronic myth that gold is in a bubble continues to persist, perhaps driven by the fact that gold has risen for the past 11 years.

The mainstream press has float stories year after year that gold was dangerously overpriced and unsuitable for most investors.  This gold bubble mindset, promulgated by “analysts” who have never owned gold has succeeded in keeping the vast majority of investors out of the best performing asset class of the past decade.

Despite every effort by the Federal Reserve to debase the value of the U.S. dollar, an uninformed and gullible public seems content to hold paper dollars which continue to decline in purchasing power.   Worse yet, in an effort to forestall insolvency and reduce the value of debt obligations that are mathematically impossible to repay, the Fed has explicitly adopted a dollar debasement policy.

While the smart money has been moving into gold, the vast majority of investors are under invested in precious metals.  The relatively low demand for gold can be seen from the third quarter gold demand and supply statistics from the World Gold Council.

Total gold demand has remained relatively stable for the past four years at approximately 4,000 tonnes.  Various categories of gold demand such as bar and coin and ETF rose while jewellery demand actually dropped and technology demand remained relatively unchanged.  Total global gold demand of 4,000 tonnes is valued at only about $230 billion.  By comparison the market value of Apple is $415 billion, the market value of IBM is $222 billion and the market value of Microsoft is $248 billion.

Meanwhile, monetary authorities world wide are printing money to prop up governments that have reached the limits of taxation and borrowing abilities.  This, along with the low level of demand for gold tells us that we are not even close to the ultimate highs that will be seen in the gold market.

More on this topic:

Gold Bull Market Could Last Another 20 Year With $12,000 Price Target

Why There Is No Upside Limit For Gold and Silver Prices

Sources and Demand For Gold

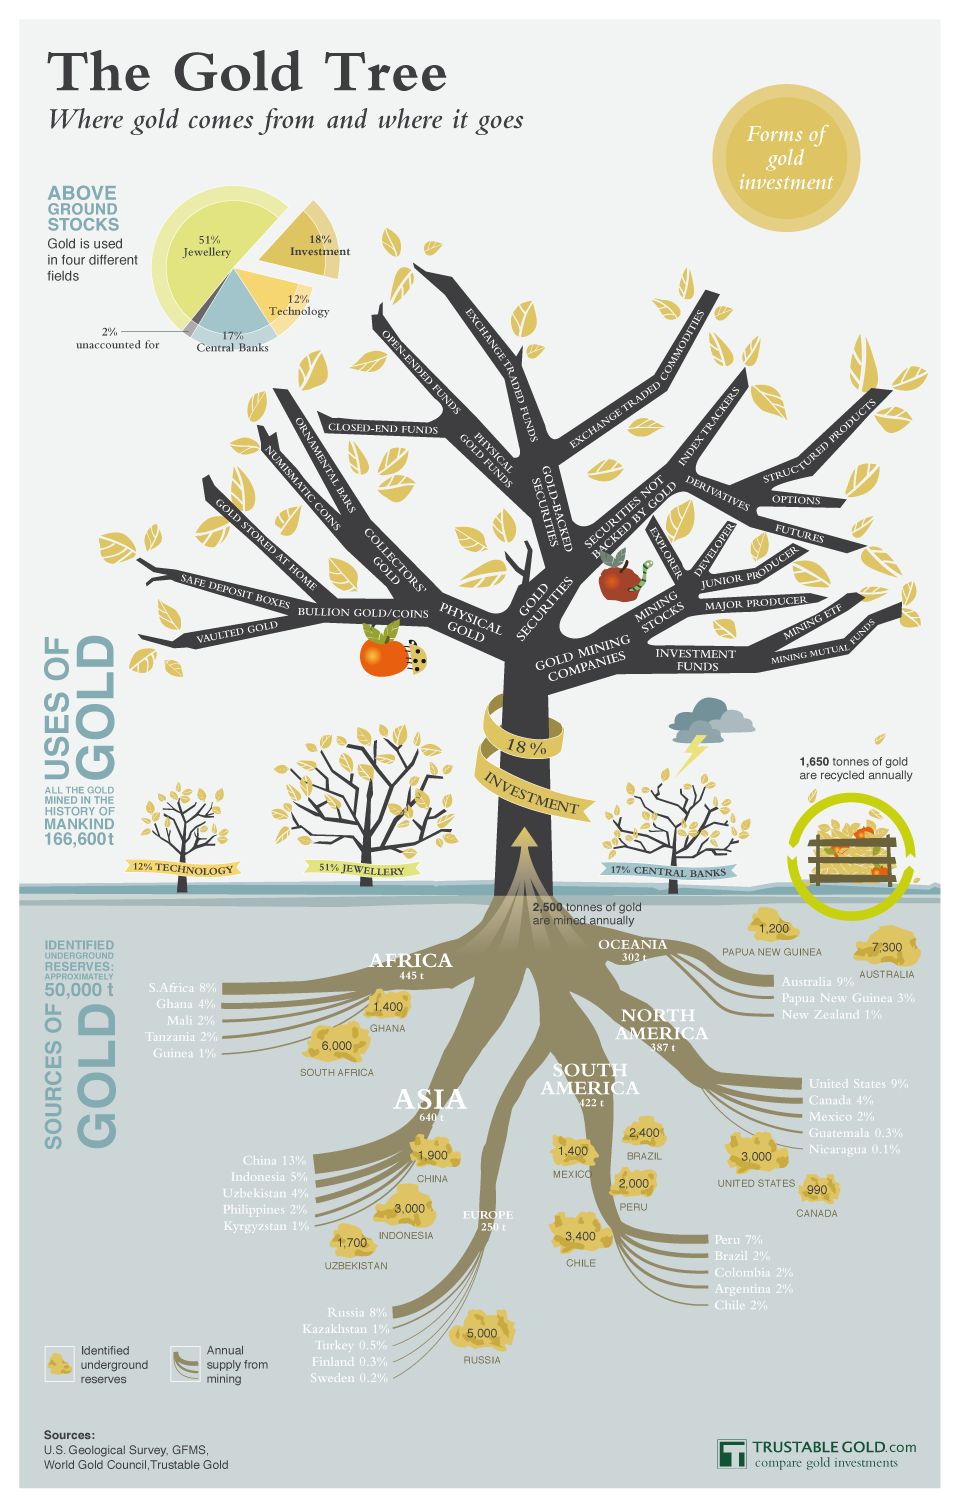
A nifty graphic detailing the sources and demand for gold can be seen below from Trustable Gold, which provides investors with information on gold investment opportunities.


Courtesy - trustablegold.com

Gold Demand Soars On Fears Of European Debt Defaults

After a sharp September price correction, gold is on track to hit all time highs.  According to a Bloomberg survey, 80% of the forecasters with the most accurate track records are predicting that gold will reach $1,950 by the end of the first quarter.   Investors world wide are fleeing paper currencies as the threat of debt defaults spread across Europe.

Ironically, central bank attempts to stimulate debt burdened economies by lowering interest rates to zero has contributed to the worldwide rush to gold.  Why would investors hold return free government debt with the added risk of principal loss?

As financial turmoil spreads across the globe, gold traders are the most bullish since 2004.

Gold traders and analysts are the most bullish in at least seven years as investors accumulate metal at the fastest pace since August to protect their wealth from a widening European debt crisis.

Gold exceeded $1,800 an ounce for the first time in seven weeks on Nov. 8 and hedge funds are holding their biggest bet on higher prices since mid-September, Commodity Futures Trading Commission data show. The metal is rebounding after tumbling as much as 20 percent in three weeks in September on demand for what are perceived as the safest assets. Almost $9 trillion was wiped off the value of global equities since May and yields on Italian and Greek bonds rose to euro-era records this week.

“Throughout history gold has protected people from the sort of turmoil that we’re seeing,” said Mark O’Byrne, the Dublin-based executive director of GoldCore Ltd., a brokerage that sells everything from quarter-ounce British Sovereigns to 400-ounce bars. It’s “an important thing to own when there is this sort of volatility in stock markets and concern about currency devaluations.”

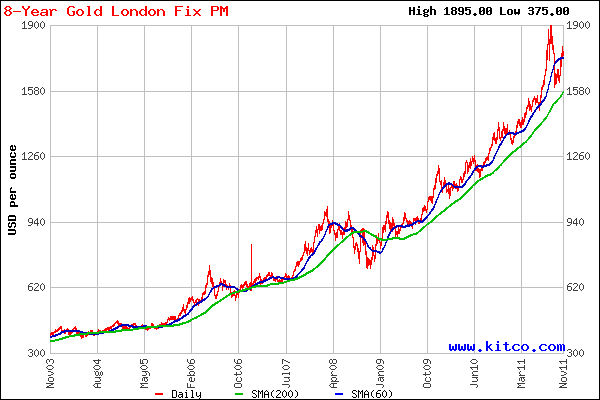
Gold climbed 24 percent to $1,766.72 this year, heading for an 11th consecutive annual advance. It’s the second-best performer behind gas oil in the Standard & Poor’s GSCI Index of 24 commodities, which rose 5 percent.

Technical indicators suggest the rally that began in September has further to go. While gold jumped 14 percent since reaching an 11-week low Sept. 26, its 14-day relative-strength index is at 58, below the level of 70 that indicates to some who study technical charts that the metal is poised to drop.


Gold - courtesy kitco.com

As discussed previously in this blog, proclamations by the mainstream press after the September gold price correction that the “gold bubble had burst” constituted a contrarian buy signal for gold and silver.  The September correction was simply another opportunity for long term gold investors to add to positions at bargain prices.

The fundamental reasons for owning gold and silver have not changed and are not likely to anytime soon.


Why Gold And Silver Prices Will Continue To Rise

The September correction in the price of gold and silver resulted in a flood of bearish articles by the mainstream press, proclaiming that the “gold and silver bubbles” had burst.

Since the mainstream press does not comprehend why precious metals have been in a bull market for the past ten years, the proclamation of the “end of the gold and silver bull markets” was, in reality, a contrarian bullish call.

Every long term bull market has sharp sell offs and gold and silver are no exception to this rule.  The sharp rise of gold prices during the summer attracted hot money from speculators and hedge funds who quickly liquidated positions based on short term technical sell signals, driving down the price of gold by over $300 per ounce.

As previously discussed, the fundamental reasons for owning gold and silver have not changed – in fact, they have grown stronger.  The September sell off in precious metal prices was simply another fantastic opportunity for long term investors to increase positions at bargain prices.

Long term investors in precious metals have outperformed virtually every asset class for the past ten years.  Even after the panic selling of September, gold still held gains of over 20% on the year from a price of $1,405 at the start of 2011.  Silver, despite a very volatile year, also remains above its price of $30.67 at the beginning of the year.

Both gold and silver remain in established long term up trends and remain at oversold, bargain level prices.


One strong fundamental factor providing support for further price gains in gold and silver comes from Mark Hulbert, whose Hulbert Financial Digest measures newsletter sentiment on the gold market.  Recent readings of the Hulbert Gold Newsletter Sentiment Index (HGNSI) (tracked by the Hulbert Financial Digest) revealed that at the end of last week gold timers were extremely bearish on gold.

The HGNSI readings dropped to the most bearish level in two and a half years, with gold market timers recommending a 13% short allocation in gold portfolios.  Hulbert’s research shows that gold usually rises when gold timers are very bearish.  Hulbert notes that gold timers have not been this bearish since March of 2009 – a level from which gold prices subsequently doubled.


A Perspective On The Plunge In Gold and Silver

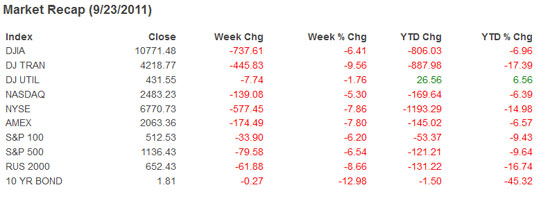
Fed Chairman Ben Bernanke set the world on fire this week as his latest scheme to “twist” long term interest rates lower pleased no one and triggered a 737 point drop in the Dow.  In addition, the Fed panicked investors by admitting that there were “significant downside risks to the economic outlook”.

Virtually every asset class except U.S. treasuries went into full scale meltdowns.  The U.S. stock market registered its worst weekly drop since the dark days of October 2008 when the  U.S. banking system was collapsing.

The rush to liquidity and forced margin selling sent precious metal prices into a tailspin. London silver plunged by $7.07 or 18%, to $32.90, the biggest decline since 1987.  Gold, as measured by the closing London PM Fix Price, dropped $105 on the week to $1,689, the largest weekly decline since 1983.  Spot prices for both gold and silver continued lower in New York afternoon trading with gold settling at $1658.20 and silver at $31.03.

Platinum dropped by $147 on the week to $1,651 and palladium dropped by $73 to $659 for losses of 8.18% and 9.97%, respectively.  Silver, with 60% of its demand relating to industrial use,  took the largest plunge in the precious metals group as economic indicators pointed to a rapidly slowing economy worldwide.

Precious Metals Prices Sept 23
9/23PM Fix Weekly Change
Gold $1,689.00 -105.00 -5.85%
Silver $32.90 -7.07 -17.69%
Platinum $1,651.00 -147.00 -8.18%
Palladium $659.00 -73.00 -9.97%

Although the sharp declines in gold and silver are unsettling, the fundamental reasons for owning gold and silver remain intact.  The rapid price increases in gold and silver since July attracted large investment flows from hedge funds and other short term speculators, who rapidly liquidate large positions based on short term technical sell signals.

Despite this week’s panic selling, long term gold investors have seen their investment rise from $1,405.50 at the beginning of the year, for a gain of $283.50 (20.2%).  Silver, despite this week’s painful sell off, is still higher by $2.23 or 7.3% from the beginning of the year, as measured by the closing London PM Fix Price.

For additional perspective on the relative performance of the gold and silver markets, here’s the record for various stock indices and the 10 year bond since the beginning of 2011.  (Note that the 10 year bond shows yield, not price.)

Asset Performance - courtesy schwab.com

Meanwhile, as the global financial system rapidly moves towards the precipice, faith in the ability of governments to contain the crisis is quickly eroding.  2011 is not a replay of the 2008 financial meltdown – it’s much more dangerous.  The sovereign governments that “saved the system” in 2008 incurred massive amounts of debt which have brought them to the brink of insolvency.  The bankruptcy of one country could ignite a financial firestorm that world governments cannot contain.

The inability of European leaders to effectively act in concert to resolve the Euro debt crisis has drawn the United States into the center of the crisis.  According to The New York Times, the U.S. is pushing Europe to mount a massive bailout to avoid financial Armageddon.

The Obama administration, increasingly alarmed by the spillover effects of Europe’s financial crisis, has begun an intensive lobbying campaign to persuade Chancellor Angela Merkel of Germany and other leaders to ramp up efforts to stem any contagion from the debt crisis in Greece.

In phone calls and meetings over the last week, President Obama urged Mrs. Merkel and President Nicolas Sarkozy of France to take coordinated measures — including spending billions in additional funds to bail out Greece and bolster European financial institutions — to prevent Greece’s debt woes from spreading to its neighbors.

“The biggest single risk to the United States today is that the European situation will spiral out of control,” said Edwin M. Truman, a former Treasury official who is now at the Peterson Institute for International Economics. “Europe is not going to save the U.S. economy, but it could be the straw that breaks it.”

Kenneth Rogoff, a Harvard economist who has written about the history of financial crises, puts Europe’s effect on the United States in blunt political terms. “The downside scenario is awful,” he said…

American officials have also emphasized the Fed’s outsize role in responding to the financial crisis here and urged Europe to view the Fed as a model. It made trillions of dollars in loans so that investors remained able to buy and sell a wide range of financial products.

Given the risks to the United States economy from a banking collapse and sovereign defaults in Europe, anyone who thinks that the United States will not be getting deeply involved in the financial bailout of Europe is delusional.  The “rescue” of Europe will ultimately involve the same techniques (zero interest rates and money printing) used by Bernanke in the United States.  The resulting negative interest rates and worldwide debasement of paper currencies will ultimately send gold soaring to new highs.

Gold and Silver Soar On Fears Of Massive Central Bank Stimulus

Precious metals soared across the board this week.  The dismal jobs report released on Friday showed that the American economy has come to a standstill with zero new jobs added in August.

The specter of the US economy plunging back into recession along with imminent banking crises in Europe and the US have fueled speculation that the Federal Reserve is on the verge of conducting another massive wave of monetary stimulus which will further debase the value of the US dollar.  Apprehension is also growing that the magical Obama plan for “creating” new jobs will involve further borrowing by an already bankrupt  American empire.

Also lurking in the background is the fear of coordinated US and European central bank intervention (money printing) to contain the collapse of the European banking system.  Despite the purchase of hundreds of billions of dollars of Spanish, Greek and Italian debt by the European Central Bank, rising interest rates are forecasting default by numerous sovereign states in the European Union.   Rates are rising again on Italian debt and the rate on one year Greek paper now exceeds 70%.  The yields on Greek debt indicate that default is now a certainty and the losses by insolvent European banks holding PIGS debt will require unprecedented government bailouts to prevent complete financial chaos.

Soaring gold prices have been predicting the collapse of paper money currencies.  As measured by the closing London PM Fix Price, gold soared on Friday by $54.25 to $1,875.25.  In later New York trading, gold continued higher closing at $1,885.20.  Gold is only $2.25 below the all time London close of $1,877.50 reached on August 22nd.

Precious Metals Prices Sept 2
PM Fix Since Last Recap
Gold $1,875.25 +87.25 +4.88%
Silver $42.50 +1.44 +3.51%
Platinum $1,873.00 +61.00 +3.37%
Palladium $785.00 +38.00 +5.09%

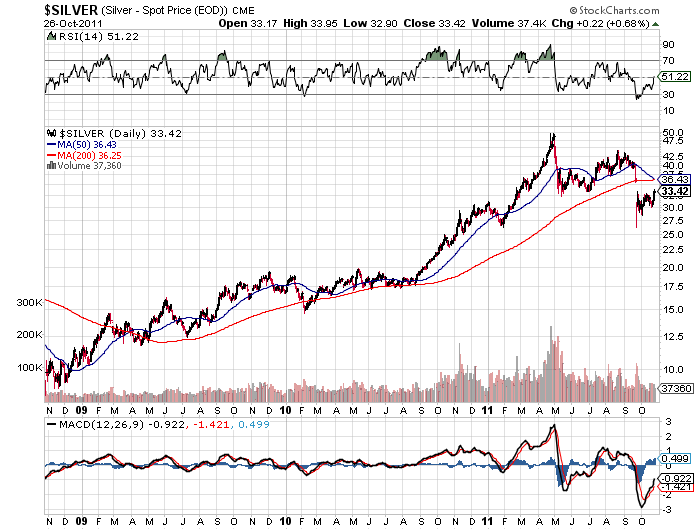
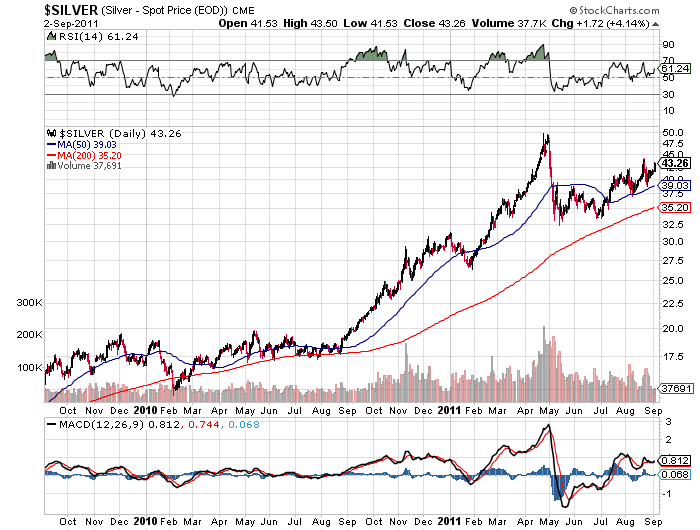
As measured by the closing London PM Fix Price, silver gained $1.44 on the week to $42.50 and continued to rise in later New York trading to $43.35.   After consolidating in the $34 range, silver has resumed its uptrend and is likely to hit new all time highs before year end.


Silver - courtesy stockcharts.com

Platinum soared by $61 on the week to close at $1,873 while palladium finished up $38 to close at $785.

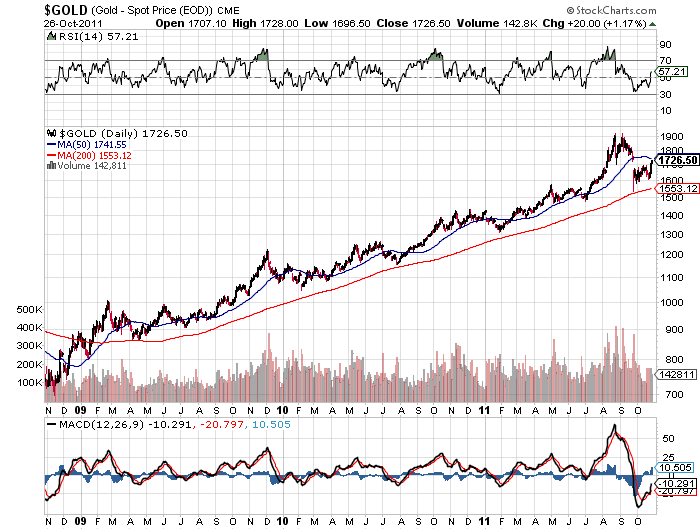
Precious metals may correct after strong advances, but the fundamental case for owning them is growing geometrically.  Expanding deficits and wild money printing will continue as policy makers continue their futile attempts to produce economic recovery by adding more debt to a system already collapsing from the burden of excessive debt.   Continue to increase gold and silver positions on any pullbacks.


Gold - courtesy stockcharts.com

Why Have SPDR Gold Trust (GLD) Holdings Dropped As Gold Soars?

The SPDR Gold Shares Trust (GLD) reported that holdings of gold bullion remained unchanged from the previous week, after dropping by 39.67 tonnes for the week ending August 24th.

On a year to date basis, GLD gold holdings have declined by 48.41 tonnes as the price of gold has increased by $425 (30.6%) from the first of the year.  Why would the GLD show a decline in gold holdings as the price of gold has soared?   Even more interesting, the GLD reached a record high of gold holdings on June 29, 2010 when it held 1,320.47 tonnes and gold was selling at $1,234.50.  From June 29, 2010, while gold has soared by $579 per ounce, the GLD has actually seen a decline in gold holdings of 88.16 tonnes.

The decline of gold holdings by the GLD as the price of gold bullion has skyrocketed indicates that investor preference for gold investment has diversified.  The demand for physical gold has soared as the world financial system becomes more precarious with each passing day.  Confidence in paper assets is becoming more fragile as hapless central banks desperately print money and drive rates to zero in a futile attempt to restore economic growth.  Investors looking for the ultimate safe haven feel more comfortable  holding physical gold.

There have been questions raised about  the safe keeping and even the existence of the gold held by the GLD.  Although these concerns appear to be unwarranted, the financial panic of 2008 blatantly exposed the fact that even institutions considered to be rock solid wound up failing.  (Also see GATA dispatch – How exchange traded fund GLD lets you pretend to own gold).

The SPDR website stresses that the gold with the SPDR Trust is deposited in an allocated account.  According to the SPDR Gold Trust,  “An allocated account is an account with a bullion dealer, which may also be a bank, to which individually identified gold bars owned by the account holder are credited.  The account holder has full ownership of the gold bars and, except as instructed by the account holder, the bullion dealer may not trade, lease or lend the bars.”

Another reason why the GLD gold holdings have not expanded is competition from numerous other gold trusts such as the Sprott Physical Gold Trust which has advantages over the SPDR Gold Trust.

In addition, the shares of many gold mining companies are selling at extreme discounts and investors may be moving funds from gold trusts such as the GLD into mining shares (see Gold Shares Are Positioned For Explosive Move Up).

The GLD currently holds 39.6 million ounces of gold valued at $71.8 billion.

Meanwhile, the case for holding gold grows stronger as concerns about the stability of the world financial system continue to increase.

The Wall Street Journal disclosed today that Goldman Sachs, in a confidential report, estimates that European banks will need as much as $1 trillion in additional capital and that the current situation in world markets is similar to those that preceded the 2008 financial panic.

According to the Wall Street Journal, strategist Alan Brazil of Goldman told clients “Here we go again.  Solving a debt problem with more debt has not solved the underlying problem. In the US, Treasury debt growth financed the US consumer but has not had enough of an impact on job growth. Can the US continue to depreciate the world’s base currency?”

GLD and SLV Holdings (metric tonnes)

August 31-2011 Weekly Change YTD Change
GLD 1,232.31 00.00 -48.41
SLV 9,836.18 -89.38 -1,174.77

Holdings of the iShares Silver Trust (SLV) dropped by 89.38 tonnes this week after increasing by 109.08 tonnes for the week ending August 24th.  The SLV currently holds 313.4 million ounces of silver valued at $13 billion.