May 1, 2024

Lowering Gold Stock Portfolio Risk Through Diversification

There are numerous investment strategies available to capitalize on the gold bull market.  Gold investors have the option of investing in gold bullion, gold coins, gold ETFs, gold mutual funds and individual gold mining stocks.

Although many gold investors prefer to exclusively hold physical gold, diversifying into selected gold stocks can dramatically increase total returns.  Although gold stocks as a group have recently underperformed bullion, selected gold stocks have outperformed gold bullion.

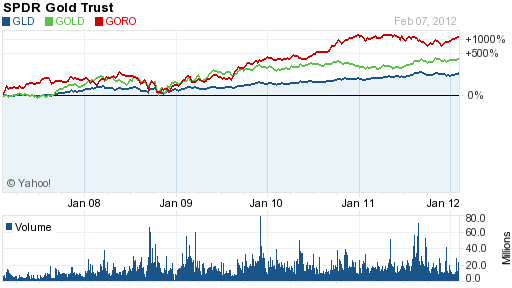
Well managed gold mining companies with large ore reserves and increasing mine production have provided investment returns far in excess of the gain in gold bullion as seen below with the examples of Randgold Resources (GOLD) and Gold Resource Corp (GORO).  Both of these gold mining companies have vastly outperformed gold bullion when compared to the SPDR Gold Trust (GLD) which tracks the price of gold bullion.

GORO, GOLD vs GLD - Courtesy yahoo.com

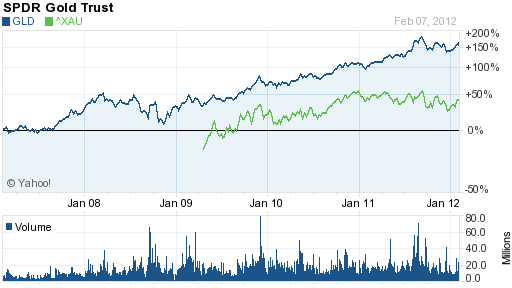
Selecting the gold stock that will outperform bullion is difficult, however, as seen by the lagging performance of the PHLX Gold/Silver Sector (XAU) when compared to the GLD.  The XAU Gold/Silver Sector is a broad based index of sixteen large precious metal mining companies.  The GLD has outperformed the XAU by three times since 2009.

GLD vs XAU - courtesy yahoo.com


As with any stock portfolio, diversification is required into order to avoid the risk of under performance.  An example of the risk of holding a gold portfolio with only a small number of stocks was seen today when the price of Nevsun Resources (NSU) collapsed by almost 31% after the company unexpectedly announced that gold production will plunge by nearly half in 2012 due to a reduction in estimated gold reserves.

Since selecting individual gold stocks can be a daunting task for investors, a better alternative would be to invest in an actively managed gold stock mutual fund with a proven record of superior investment returns.  Past performance has shown that an actively managed gold stock mutual fund has outperformed passively managed gold index funds.

One gold fund that should top the list for investors to consider is the Tocqueville Gold Fund (TGLDX), run by legendary gold investor John Hathaway.  The Tocqueville Gold Fund has a remarkable average annual return over the past ten years of 23.3%, almost double the gain in the Philadelphia Gold/Silver Index.

courtesy yahoo.com

Although gold bullion has outperformed gold stocks since 2008, Mr. Hathaway’s outlook for gold remains extremely bullish and he expects that as gold continues to increase in price, gold stocks should once again outperform the returns of gold bullion.  In his latest Investment Update, here is what Mr. Hathaway had to say.

Gold and gold stocks appear to be bottoming in the wake of a four month correction which began in mid -August when the metal peaked at $1900/oz. Bearish sentiment is at extremes not seen in many years. This and a number of other indicators, such as stocks that have been hit by negative sentiment, the downtrend in gold prices since August, and tax loss selling, support our view that a rally lies ahead. This very bullish market set-up, in our opinion, mirrors the extraordinary investment opportunity of the despondent year end in 2007. Even though gold prices have been declining for several months, they finished the year with substantial gains. This suggests that the value represented by gold mining equities held in our portfolio could be extraordinary.

Disarray in Europe is, in our opinion, a slow motion version of the global market meltdown in 2007. It appears to us that the U.S. Fed is once again acting as the lender of last resort to European central banks in their efforts to save the euro. As in 2007, U.S. sovereign credit will be substituted for failing credits, in this case, peripheral European states. The fig leaf to justify such action on the Fed’s part is sado-fiscalism, or extreme austerity packages administered by technocrats. Tough restraints on profligate public spending, which has become a way of life in all Western democracies, will not go down easily. These measures are deflationary and will be ultimately met by howls of protests from mobs demanding renewed money printing and deficit spending. In our opinion, the fundamentals for gold are stronger than ever because the outlook for paper currencies is dire. The difficult correction of the last four months has shaken out all but the strongest holders, a perfect set-up for advances to new all-time highs in 2012.
Have Gold Investors Become Too Bullish? Ask The Same Question At $5,000

Have too many investors gotten overly bullish on gold?

After a stunning advance of almost $200 per ounce from last year’s closing price, some are asking if gold has gotten ahead of itself.  After advancing almost nonstop since the beginning of the year, gold sold off sharply, dropping by $32.50 to close in New York trading at $1725.90.

Analyst Mark Hulbert, who tracks investor sentiment as reported in the Hulbert Gold Newsletter, reports that bullish sentiment on gold has become extreme.  At the end of 2011, short term gold timers were completely out of the gold market.  The Hulbert Gold Newsletter Sentiment Index (HGNSI) registered 0.3% on December 29th compared to 51% today.  Mr. Hulbert sees the rapid return to bullishness by gold investors as a worrisome signal and notes that the HGNSI never got as high as it is today when gold previously traded at current price levels.

Mr. Hulbert notes that his indicator can be early as was the case last year.  In early December Hulbert noted that bearish sentiment was reaching extreme levels but gold subsequently plunged from $1,752 on December 1st to $1,574.50 on December 30th.

One indicator of gold sentiment that does not seem to be signaling an imminent sharp correction in gold is the CBOE Gold ETF Volatility Index (Gold VIX) which measures gold volatility based on SPDR Gold Trust (GLD) options trading.  As bearish put positions on the GLD increase, the VIX rises as it did last August prior to a sharp correction in the price of gold.  After peaking at 40 last year, the VIX is currently at 22.

CBOE Gold VIX (GVZ) - courtesy cboe.com


Could the price of gold correct in the short term? Yes.  Should long term investors who hold gold as a safe haven against a government that has an official policy of debasing the currency be worried?  No.

A short term correction is nothing more than a buying opportunity for long term investors.  Why would one care if gold corrects to $1,600 on its way to $5,000?  Here are a few items for consideration by those worried about a “correction” in the price of gold.

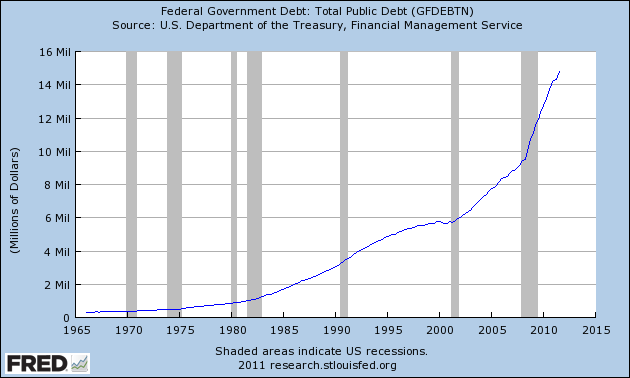
The U.S. has accumulated debt obligations and promises that are mathematically impossible to repay.  Neither future economic growth nor tax increases will be sufficient for the government to meet its obligations without debasing the value of the dollar.  The government is spending $1.60 for every $1.00 collected in revenues, half of all families receive some type of government payment and half of all wage earners pay no taxes.

The government’s “solution” for too much debt remains the same – more debt.  Here’s what Treasury Secretary Geithner said when he asked Congress to raise the debt limit in August 2009 when government debt totaled “only” $12.1 trillion.

“Congress has never failed to raise the debt limit when necessary. Because members of both parties have long recognized the need to keep politics away from this issue, these actions have traditionally received bipartisan support. This is clearly a moment in our history that calls for continuation of that tradition.”

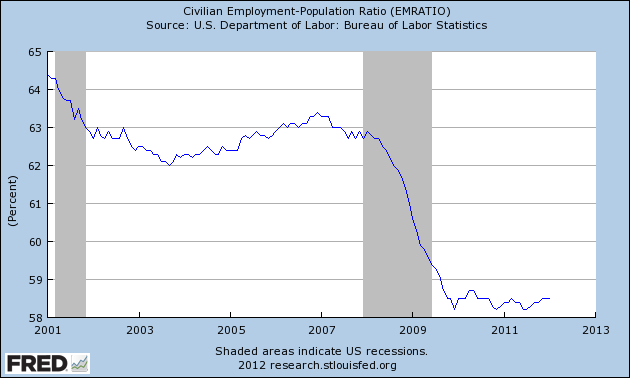
As the debt burden approaches the day of reckoning, the proportion of the population actually working continues to decline.

Investors late to the party attempting to diversity into gold may find that it’s too late – gold may not be available at any price.

Gregor Macdonald notes that global gold production over the last decade has been below the average of the past 110 years.  Normally, higher prices will  result in higher supplies as producers rush to capitalize on higher prices.  Despite the fact that the price of gold has increased every year for the past decade, gold production has barely increased – there is simply not that much gold left which hasn’t already been mined.


Global gold production - courtesy gregor.us

A looming price correction in gold?  Bring it on!

Bearish Gold Forecasts Suggest Soaring Gold Prices In 2012

Will gold soar this year as central banks go wild with money printing?  Or will gold collapse as debt defaults overwhelm the system and propel the world economy into a deflationary black hole?

Members of this week’s Barron’s Roundtable were asked what they thought about gold.  Panel members offered their usual variety of informed opinions on what could happen to the price of gold during 2012 – here’s what they had to say.

Marc Faber, editor of the Gloom, Boom & Doom Report, expects massive money printing by central banks during 2012 and a continuing correction in gold prices.

The worse the news gets, the more the U.S. and the European Central Bank and China will print money.
In the past 10 years gold and silver have performed superbly. The gold price overshot on the upside when it reached $1,921 an ounce on Sept. 6. Now it is in a correction phase and could fall another $200.
It is not that the gold price will go up. It is that the value of paper money will go down. Diversification is important, and people should put 15% to 25% of their assets in gold.

Brian Rogers, Chief Investment Officer of T. Rowe Price, sees oil as a good investment but does not foresee a big rally in gold prices.

It is easier to get your arms around oil than gold in terms of the numbers and demand.  Oil is a good investment in the next few years, with optionality to the upside if something extreme happens in the Middle East. Gold is a good diversifier, but not a great way to make money.

Fred Hickey, editor of The High-Tech Strategist, predicts higher gold prices this year and views gold stocks as a relative better value than gold bullion.

Gold will rally, then have a seasonal selloff. By the end of the year it could be up 15%, as has been typical in this 11-year secular bull market for gold.
Gold stocks have been terrible. They dropped 20% last year, so that makes them a better buy relative to the price of gold. Last year I owned a lot of gold. Now I have more money in gold stocks than in physical gold or the GLD [ SPDR Gold Trust].
I own a smaller amount of exploration companies through the GDXJ [ Market Vectors Junior Gold Miners exchange-traded fund] and a larger percentage of producers.

Felix Zulauf, President of Zulauf Asset Management, sees gold prices soaring as the world economy approaches depression like conditions, forcing central banks to print money on a vast scale.

The world economy will experience a brutal slowdown. Deflationary forces are going to strengthen and commodities in general will decline. You can buy oil to hedge a decline in base metals. Gold started a cyclical correction within a secular bull market last summer. The first wave of selling is ending now. Gold has to be bought some time this year, probably in the second half, below $1,600. Then the monetary authorities will load their guns again and print more money, which will make investors buy more gold. The gold market is so tiny that when people want to shift just a small piece of their wealth into gold, the price flies to new highs.

Scott Black, President of Delphi Management, favors a modest position in gold stocks but thinks that people holding gold as a hedge against inflation are misguided.

A lot of people own gold as a hedge against inflation. I don’t see inflation in the cards in the U.S. Capacity utilization in the manufacturing sector it is only 77%. We own a couple of gold stocks but buy them as we do other stocks. We look for high returns on equity and low P/Es. We own Barrick Gold [ABX], which trades for 7.8 times this year’s expected earnings. Even absent a big upswing in gold prices, it will do well because production is growing.

Putting things into perspective, the rather lukewarm endorsement for gold by the Barron’s Roundtable should be viewed as a bullish indicator for gold prices.  The healthy and normal correction in the price of gold from the high of $1,900 in August has resulted in rampant bearishness and numerous predictions that the bull market in gold is over.  Ironically, many of the most bearish gold forecasts are coming from the same “analysts” who were predicting the end of the gold bull market multiple times over the past decade.

Bearish sentiment on gold has reached extreme levels according to the Hulbert Gold Newsletter Sentiment Indicator.  The average gold timer has thrown in the towel.  Over leveraged speculative investors panicked at the first sign of weakness in gold and sold out.  According to Hulbert, “this is building a strong foundation for a fresh assault on gold’s recent all-time high above $1,900 an ounce.”

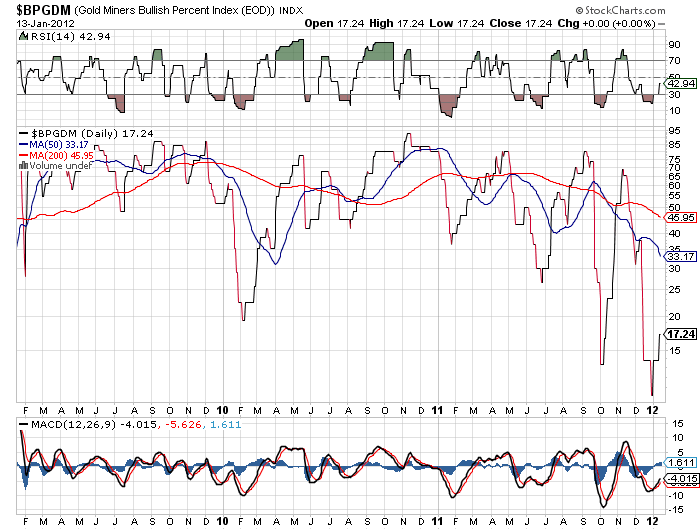
Bearish sentiment on gold stocks has also reached extreme levels as seen by the Gold Miners Bullish Percent Index.


Courtesy: Stockcharts.com

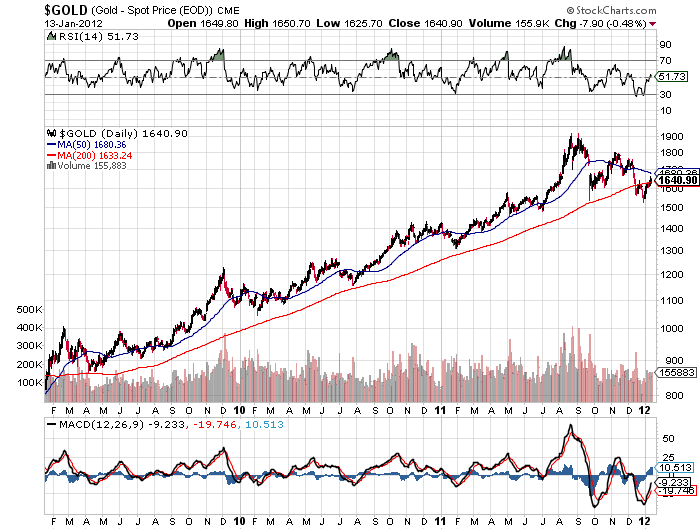
After briefly falling below the 200 day moving average, gold rebounded strongly, rising from $1,598 at the start of the year to a Friday closing price of $1,635.50.  Over the past decade, the few times that gold previously fell through the 200 day moving average  set the groundwork for a major price advance.


Courtesy: stockcharts.com

The fundamental and technical indicators for gold remain rock solid.  Gold may very well wind up shocking the bears by outperforming every other asset class in 2012.

Gold Bullion Coin Sales Jump 9% In December, But Decline 18% For The Year

Demand for physical gold increased in December as buyers took advantage of a recent pullback in gold prices.

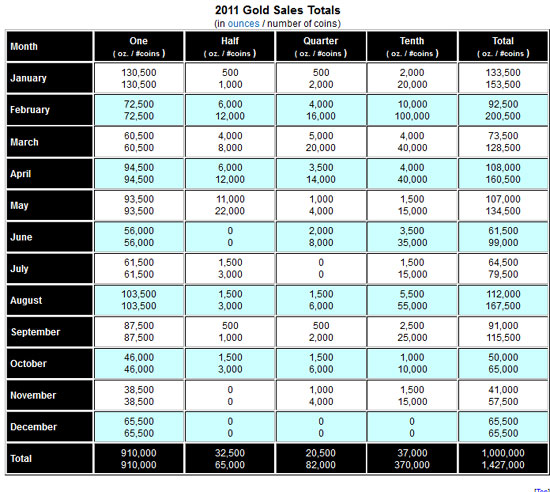
According to production figures from the U.S. Mint, sales of American Gold Eagle bullion coins in December totaled 65,500 ounces, an increase of 9.2% from December 2010.  Total sales of gold bullion coins for 2011 declined by 18% from the prior year.  For all of 2011, a total of 1,000,000 ounces were sold compared to previous year sales of 1,220,500 ounces.

The sales figures cited above do not include gold numismatic coins sold by the U.S. Mint.  Collector versions of gold coins such as the American Buffalo Gold Proof Coin can be purchased directly by the public from the U.S. Mint.

The American Gold Eagle bullion coins cannot be directly purchased by the public from the U.S. Mint.  Instead, a network of authorized purchasers (AP’s) buys the coins in bulk from the Mint at a fixed markup.  The AP’s in turn resell them to secondary retailers for public sale.  The AP distribution system established by the U.S. Mint was determined to be the most efficient method for selling gold bullion coins to the public at competitive prices.

Although sales of gold bullion coins increased during August and September when gold was soaring to all time highs, the largest  monthly sales of gold bullion coins occurred in January when gold was trading in the $1,350 range (please see chart below for monthly sales figures).

U.S. Mint Gold Bullion Sales By Month


2011 marks the third year in a row of reduced purchases of gold bullion coins but this is not indicative of an overall reduction in investment gold demand.  Competing investments such as gold trust ETFs may be responsible for a large part of reduced demand for physical gold.

Besides much lower transaction costs, investors in gold ETFs or other paper gold products do not have to worry about security and storage costs.  Since their launch in 2005, investors have poured billions of dollars into gold trust ETFs.  For example, the SPDR Gold Shares Trust (GLD) and the iShares Gold Trust (IAU) now hold gold bullion valued at over $82 billion.  By contrast, the approximate value of all American Eagle Gold bullion coins purchased last year amounts to only $1.6 billion.

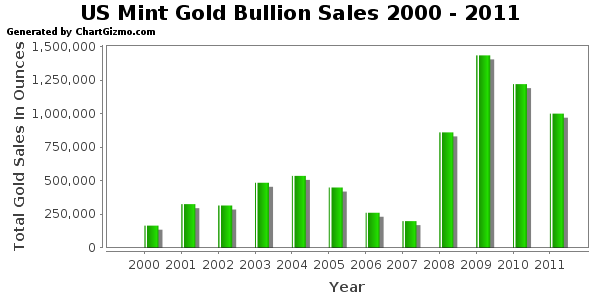
The all time record sales of American Eagle gold bullion coins occurred in 2009 when 1,435,000 ounces were sold.

Gold Bullion U.S. Mint Sales Since 2000
Year Total Ounces Sold
2000 164,500
2001 325,000
2002 315,000
2003 484,500
2004 536,000
2005 449,000
2006 261,000
2007 198,500
2008 860,500
2009 1,435,000
2010 1,220,500
2011 1,000,000
Total 7,249,500


Will gold bullion sales continue to decline?  The recent implosion of MF Global along with unrestrained money printing by central banks should provoke some clear headed thinking by investors.  Customers of MF Global who thought they had warehouse receipts for physical gold and silver were shocked to find that the bankruptcy trustee put all assets into a single pool to cover  claims of all customers who have lost billions of dollars.

Paper assets can be vaporized in an instant, even those that are allegedly backed by physical assets such as gold and silver.  A question well worth pondering is “Could what happened at MF Global also happen to investors in the gold trust ETFs”?


Gold Bullion Coin Sales Plunge 63% In November and 20% YTD – Have Americans Given Up On Gold?

Total sales of American Gold Eagle bullion coins plunged in November according to production figures from the U.S. Mint.

Total sales of gold U.S. Mint bullion coins declined by 63.4% in November from the previous year.  Sales of U.S. Mint gold bullion coins declined by 19.5% on a year to date basis through the end of November.  A total of 41,000 ounces were sold in November 2011 compared to sales of 112,000 ounces in November 2010.  Year to date sales through November totaled 934,500 ounces compared to the previous year to date totals of 1,160,500 ounces.

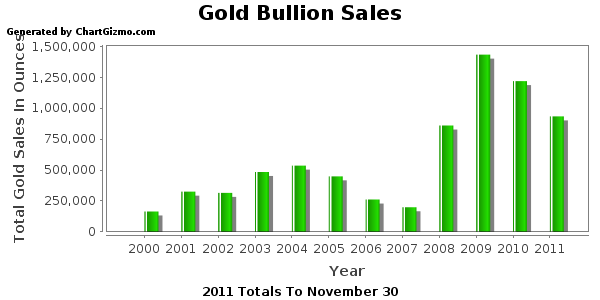
The reduction in the purchase of U.S. Mint gold bullion coins continues a trend of reduced sales since the record breaking year of 2009 when a total of 1,435,000 ounces were sold.  Total gold bullion sales  for 2011 will probably slip below one million ounces for the first time since 2009.  If sales decline in December by the same percentage amount as in November, total 2011 sales of gold bullion coins will come in at 956,500 ounces.

A summary of gold mint bullion coin sales since 2000 is shown below.

Gold Bullion Sales Since 2000

Gold Bullion U.S. Mint Sales Since 2000
Year Total Ounces Sold
2000 164,500
2001 325,000
2002 315,000
2003 484,500
2004 536,000
2005 449,000
2006 261,000
2007 198,500
2008 860,500
2009 1,435,000
2010 1,220,500
2011 934,500
Total 7,184,000

Why would gold bullion coin sales be plunging when gold has been steadily rising?  Have Americans given up on gold?  Let’s look at various trends in gold sales to get some perspective.

-Annual sales of gold bullion exceeded a half million ounces only once before 2008.  The financial crash of 2008 precipitated concerns about the integrity of both the banking system and the U.S. dollar, causing a huge increase in demand for physical gold.  Gold bullion sales exploded higher in 2008 and sales for 2011 remain far above levels seen prior to 2008 despite the recent drop in sales.

-Based on the current price of gold, the total value of all gold bullion purchased from the U.S. Mint since 2000 is $12.6 billion.  This amount represents only a fraction of the amount of investment dollars that have flowed into gold over the past decade.  In addition to purchasing physical gold, investors now have the option to purchase gold through gold trust ETFs.  The amount of money poured into the gold trust ETFs is many multitudes greater than the investment in physical gold bullion coins.  For example, since their inception in 2005, the combined gold holdings of the SPDR Gold Shares Trust (GLD) and the iShares Gold Trust (IAU) have grown to 47.2 million ounces valued at $82.5 billion.

-Gold ETFs have grown exponentially from their inception a short six years ago but the largest gold ETF, the SPDR Gold Shares Trust (GLD), has not been able to exceed its record gold holdings of 1,320.47 tonnes reached on June 29, 2010.  In addition, billionaire John Paulson recently liquidated a substantial portion of his GLD holdings, although much of the selling may have been forced due to severe losses in his hedge funds.

-Gold trader sentiment is either bullish or bearish, depending on who you talk to.

-Central banks, which have been increasing their purchases of gold since 2000, have sharply accelerated their purchases of gold bullion over the past several years.  Central banks from Asia and Latin America have accounted for most of the increased purchases.

-According to the World Gold Council, global gold investment demand increased by 33% in the 2011 third quarter compared to the prior year.  Investment demand for gold bars and coins increased by 29% and global gold holdings by gold trust ETFs increased by almost 78 tonnes.  Demand for gold increased notably during the third quarter in Europe and China.

While it is indisputable that global gold demand has increased, the appetite for gold by U.S. investors seems to be diminishing.  What do you think?


Chinese Seek To Buy Undervalued Gold Mining Company

China has been steadily adding to its gold reserves as it attempts to diversify its huge holdings of foreign currency.  From only 395 tonnes in 1988, the Chinese central bank has increased its gold reserves to 1,054 tonnes.  As the largest foreign holder of U.S. Treasury debt, the Chinese have complained loudly about America’s addiction to debt and the nonstop efforts of the Federal Reserve to debase the U.S. dollar.

Besides buying ever increasing amounts of gold bullion, the Chinese have now decided to add gold mining companies to their shopping list.  Given the incredible disconnect between the market value of gold mining companies compared to the value of gold bullion, the decision to buy gold mining companies should come as no surprise.   Many gold mining stocks are selling at a substantial discount to their net asset values of proven gold reserves.

As reported by Bloomberg, China’s second largest gold producer, Shandong Gold Group Co, Hunts for Brazilian Gold Acquisition.

Jaguar Mining Inc. (JAG), which is exploring its options after receiving acquisition proposals, is proving that even a record takeover premium for a gold company can be a bargain.

Shandong Gold Group Co., owner of China’s second-largest gold producer, offered to buy Jaguar for $785 million in cash, two people familiar with the deal said Nov. 16. The $9.30-a- share bid is 77 percent more than Jaguar’s prior 20-day average, the highest premium in a cash takeover of a gold miner greater than $500 million, according to data compiled by Bloomberg. Jaguar is still trading at a 3.5 percent discount to its net asset value, cheaper than 94 percent of comparable gold miners.

“Relative to their peers, Jaguar is trading at a pretty substantial discount,” Sachin Shah, a Jersey City, New Jersey- based special situations and merger arbitrage strategist at Tullett Prebon Plc, said in a telephone interview. “Even a $9.30 offer may be undervaluing the company. They could actually get a longer-term value asset at a cheap price. It’s the Brazilian assets that make Jaguar so appealing.”

After closing at $7.80 in New York on Nov. 16, Jaguar fell 3.5 percent yesterday to $7.53. The company is trading at 0.97 times its net asset value of $7.80 a share, based on the average of analysts’ estimates compiled by Bloomberg. That means it’s still cheaper than 16 of 17 other gold companies with similarly sized mines, the data show. Jaguar’s rivals are worth an average of 1.8 times the value of their underlying assets.

“The stock has lagged the group and generally underperformed, and as a result the company was ripe for the picking,” Mark Kellstrom, a senior partner at Summit, New Jersey-based Strategic Energy Research and Capital LLC, which focuses on energy and natural resources, said in a phone interview. “For a purchaser like Shandong, there’s a real opportunity here to buy gold reserves at cheaper valuations, improve the operating results and therefore reap a nice return.”

It was simply a matter of time before cheap gold mining companies became acquisition targets.  Gold mining companies have lagged far behind the gains of gold bullion and are selling at huge discounts to the value of their gold reserves.  A look at the comparative performance of the SPDR Gold Trust (GLD) to the PHLX Gold/Silver Index (XAU) shows that since 2008, gold has returned approximately 200% compared to a return of only 50% for the XAU.

The fundamental appeal of gold mining stocks is further bolstered by increasing demand for gold bullion.  The Gold Demand Trends released by the World Gold Council shows that global demand for gold increased by 6% in the third quarter.


Courtesy yahoo finance

Despite the recent volatility in gold prices, the long term fundamental case for gold remains intact and, in fact, grows stronger by the day as one sovereign nation after another stares into the abyss of debt default.  The move by the Chinese to acquire Jaguar Mining could be the spark that sets off a stampede to acquire undervalued gold mining companies.

Why Have SPDR Gold Trust (GLD) Holdings Dropped As Gold Soars?

The SPDR Gold Shares Trust (GLD) reported that holdings of gold bullion remained unchanged from the previous week, after dropping by 39.67 tonnes for the week ending August 24th.

On a year to date basis, GLD gold holdings have declined by 48.41 tonnes as the price of gold has increased by $425 (30.6%) from the first of the year.  Why would the GLD show a decline in gold holdings as the price of gold has soared?   Even more interesting, the GLD reached a record high of gold holdings on June 29, 2010 when it held 1,320.47 tonnes and gold was selling at $1,234.50.  From June 29, 2010, while gold has soared by $579 per ounce, the GLD has actually seen a decline in gold holdings of 88.16 tonnes.

The decline of gold holdings by the GLD as the price of gold bullion has skyrocketed indicates that investor preference for gold investment has diversified.  The demand for physical gold has soared as the world financial system becomes more precarious with each passing day.  Confidence in paper assets is becoming more fragile as hapless central banks desperately print money and drive rates to zero in a futile attempt to restore economic growth.  Investors looking for the ultimate safe haven feel more comfortable  holding physical gold.

There have been questions raised about  the safe keeping and even the existence of the gold held by the GLD.  Although these concerns appear to be unwarranted, the financial panic of 2008 blatantly exposed the fact that even institutions considered to be rock solid wound up failing.  (Also see GATA dispatch – How exchange traded fund GLD lets you pretend to own gold).

The SPDR website stresses that the gold with the SPDR Trust is deposited in an allocated account.  According to the SPDR Gold Trust,  “An allocated account is an account with a bullion dealer, which may also be a bank, to which individually identified gold bars owned by the account holder are credited.  The account holder has full ownership of the gold bars and, except as instructed by the account holder, the bullion dealer may not trade, lease or lend the bars.”

Another reason why the GLD gold holdings have not expanded is competition from numerous other gold trusts such as the Sprott Physical Gold Trust which has advantages over the SPDR Gold Trust.

In addition, the shares of many gold mining companies are selling at extreme discounts and investors may be moving funds from gold trusts such as the GLD into mining shares (see Gold Shares Are Positioned For Explosive Move Up).

The GLD currently holds 39.6 million ounces of gold valued at $71.8 billion.

Meanwhile, the case for holding gold grows stronger as concerns about the stability of the world financial system continue to increase.

The Wall Street Journal disclosed today that Goldman Sachs, in a confidential report, estimates that European banks will need as much as $1 trillion in additional capital and that the current situation in world markets is similar to those that preceded the 2008 financial panic.

According to the Wall Street Journal, strategist Alan Brazil of Goldman told clients “Here we go again.  Solving a debt problem with more debt has not solved the underlying problem. In the US, Treasury debt growth financed the US consumer but has not had enough of an impact on job growth. Can the US continue to depreciate the world’s base currency?”

GLD and SLV Holdings (metric tonnes)

August 31-2011 Weekly Change YTD Change
GLD 1,232.31 00.00 -48.41
SLV 9,836.18 -89.38 -1,174.77

Holdings of the iShares Silver Trust (SLV) dropped by 89.38 tonnes this week after increasing by 109.08 tonnes for the week ending August 24th.  The SLV currently holds 313.4 million ounces of silver valued at $13 billion.


Gold And Silver ETF Holdings Remain Steady As Gold Plunges

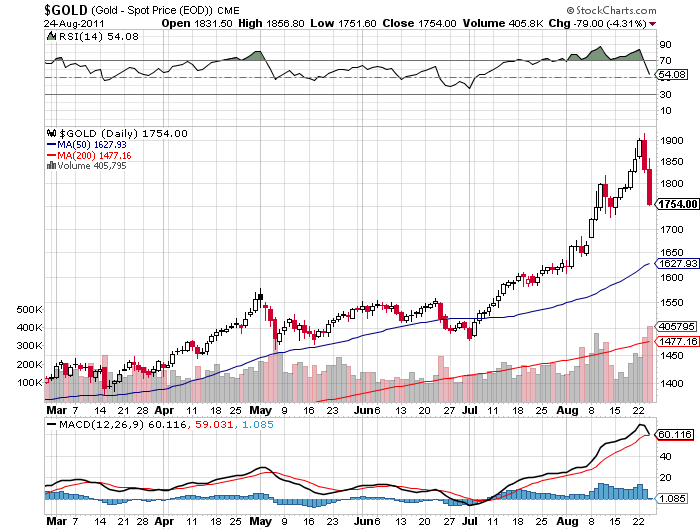
Gold’s non stop advance since early July saw a rapid reversal on Wednesday as gold lost $104.20 to close at $1,752.30 in New York trading.

Gold prices have soared this year on fears of another financial crisis and the continual debasement of paper currencies by governments that are tottering on the brink of default.  Gold began the year at $1,388.50 and by early May traded over $1,550.  After consolidating for two months, gold broke out of its trading range in early July and breached the $1,900 level earlier this week.  Despite today’s sharp sell off, gold is still up $363.80 or 26% for 2011.

As short term trend traders, hedge funds and speculative buyers jumped into gold, prices became overbought with gold trading $423 above its 200 day moving average.  The same traders playing gold for short term profits jumped out just as quickly when prices started to reverse.  Two factors that encouraged profit taking in gold were reports that the Fed would not immediately announce another round of money printing and the sharp hike in margin requirements on gold futures by the CME Group.

On a short term basis gold was overbought and due for a correction after an almost vertical rise from $1,500 as can be seen below.


Gold - courtesy stockcharts.com

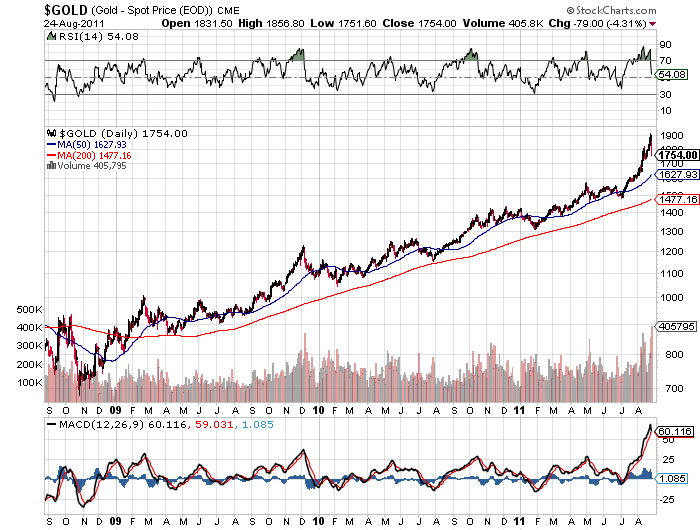
A view of a longer term chart gives a different perspective – the long term bull market in gold remains intact and the fundamental reasons for owning gold have not changed.


Gold - courtesy stockcharts.com

The non stop “gold bubble” chatter by talking heads who missed participating in the decades long gold rally are focusing on a short term price movement instead of the fundamentals that will continue to drive gold prices higher.  Every bull market has corrections and are an opportunity to add to positions.  As a long term investor in gold since the early 1990’s, I have seen other investors trade in and out, losing money each time, instead of simply going with the long term bull trend.

Many analysts have expressed concern that investors might be panicked out of the GLD causing the price of gold to plunge.  This does not seem to be the case despite the large drop in gold prices this week.  As of Wednesday, the GLD gold holdings declined by only 39.67 tonnes.  In addition, when silver spiked in early May, trading volume in the SLV exploded by 750% above the daily average trading volume.  Despite the volatility in gold this week, trading volume in the GLD expanded by only 350% above average trading volumes.  This would seem to indicate that investment in the GLD is a core holding by long term gold investors who are not inclined to sell on normal price corrections.

The SPDR Gold Trust currently holds 39.6 million ounces of gold valued at $70.1 billion.  There has been much hype about the value of the GLD exceeding that of the SPDR S&P 500.  A more proper context for comparison is to compare the value of the GLD to the increase in sovereign debt and money printing.  Bernanke’s latest episode of QE2 money printing was 850% larger than the entire value of the GLD and you can count on additional Fed currency debasement in the future.

GLD and SLV Holdings (metric tonnes)

August 24-2011 Weekly Change YTD Change
GLD 1,232.31 -39.67 -48.41
SLV 9,836.18 +109.08 -1,085.39

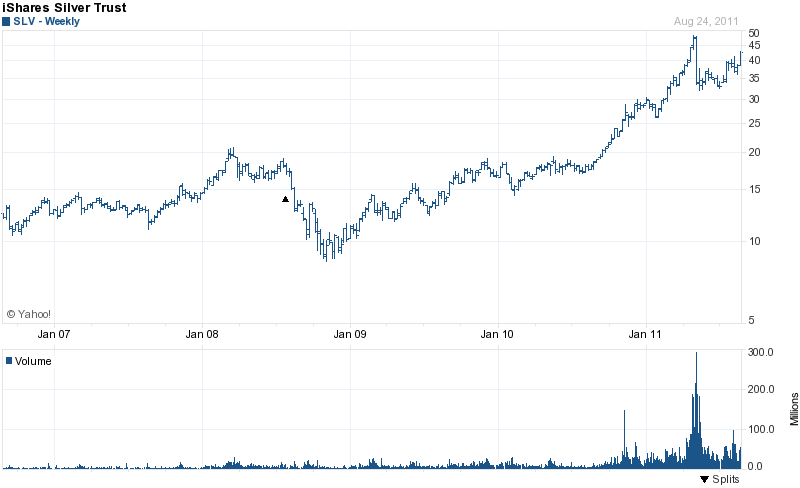
The iShares Silver Trust holdings gained 109.08 tonnes for the week ending August 24, despite the slide in silver prices.  The SLV has been building a base in the $35 to $40 range since the May correction.   Many analysts proclaimed that the “bubble” in silver prices had burst after the sharp price correction in May.  From a long term perspective, the May correction did little to diminish either the bullish fundamentals or the long term upward trend in silver prices.


SLV - COURTESY YAHOO FINANCE

The SLV currently holds 316.2 million ounces of silver valued at $13.3 billion.

SPDR Gold Trust And iShares Silver Trust Holdings Decline

Gold holdings of the SPDR Gold Trust (GLD) declined slightly on the week by 24.54 tonnes after a gain of 10.22 tonnes in the previous week.   GLD  gold holdings have declined by 8.74 tonnes since the beginning of the year.   The all time high holdings of the GLD occurred on June 29, 2010 when the Trust’s holdings reached 1,320.47 tonnes.

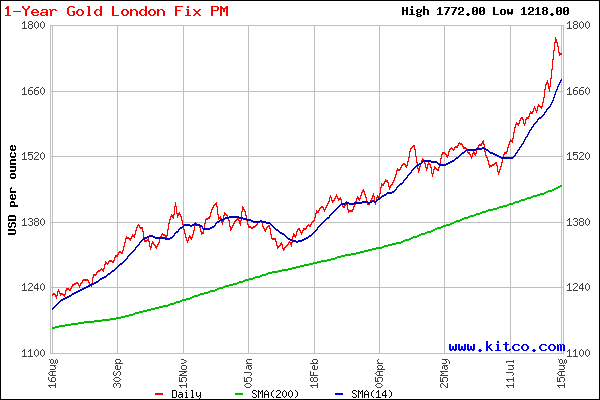
As measured by the closing London PM Fix Price, gold started the year at $1,388.50.  Gold closed in Wednesday trading at $1,790.00 for a gain of $401.50 or 28.9% on the year.  Gold has been in a steady, virtually uninterrupted uptrend since late 2008.  At the beginning of July, the price trend of gold entered an accelerated uptrend.


GOLD - COURTESY KITCO.COM

Although a pullback is possible after an almost vertical rise of $256 since July 1st, it is just as likely that gold could confound the skeptics and continue to rise.  The increase in gold prices for the past  decade has reflected widespread apprehension over the value of paper currencies.  The world economy never recovered from the financial crisis starting in 2008 despite the borrowing and printing of trillions of dollars by world central banks and governments.  The increase in the price of gold is reflecting the growing realization that governments and central banks no longer have the ability to contain a second full blown financial crisis.  Under this scenario, gold effectively has no ceiling price.

The GLD is the largest gold exchange traded fund with 40.9 million ounces of gold.  According to Bloomberg, the total holdings of all  major gold  ETFs worldwide amount to 70.7 million ounces of gold.  Holdings of all gold ETFs worldwide have increased by 4.1 million ounces or 6.2% since the beginning of the year.

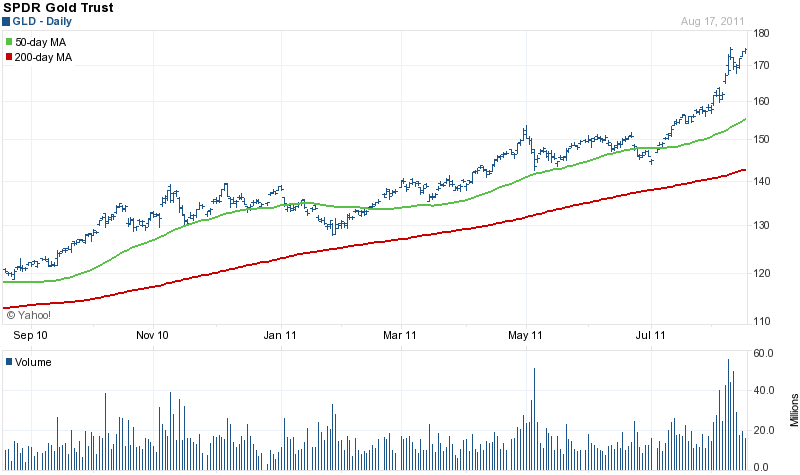
The SPDR Gold Trust currently holds 40.9 million ounces of gold valued at $73.2 billion.  For perspective, the entire value of the GLD would fund less than 18 days of US Government deficit spending which is projected to exceed $1.5 trillion this year.


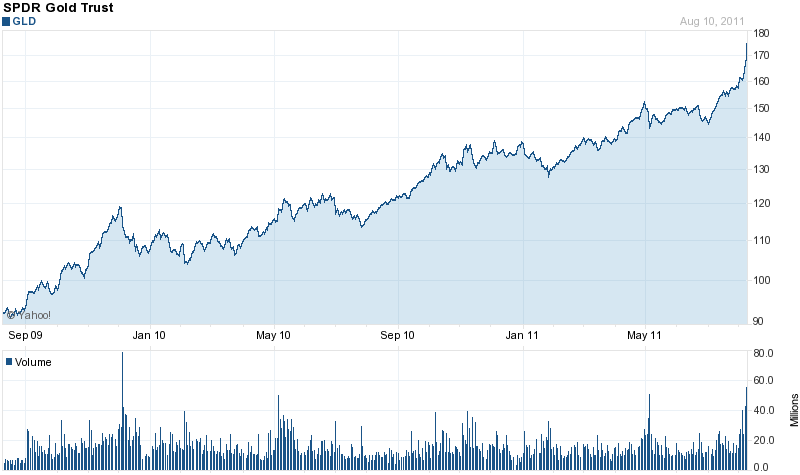
GLD - COURTESY YAHOO FINANCE

The GLD closed the day at $174.42, fractionally below its all time high of $175.13

GLD and SLV Holdings (metric tonnes)

August 17-2011 Weekly Change YTD Change
GLD 1,271.98 -24.54 -8.74
SLV 9,727.10 -45.46 -1,194.47

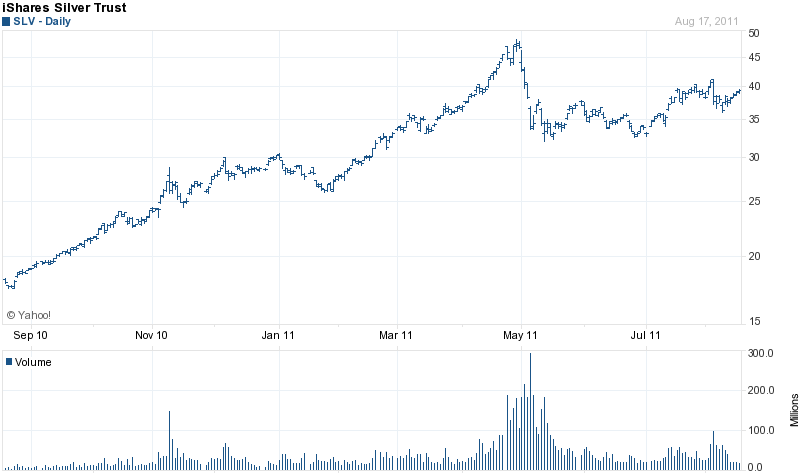
Holdings of the iShares Silver Trust declined by 45.46 tonnes on the week after a decline of 86.36 tonnes in the previous week.  Since July 1st, the SLV has gained 190.95 tonnes.

After a price correction in early May, silver has recovered in price and is building a base in the $40 range before the next move up.  Silver has gained $6.17 or 18.2% since July 1st, rising from $33.85 to $40.02.


SLV - COURTESY YAHOO FINANCE

The SLV currently holds 312.7 million ounces of silver valued at $12.5 billion.  Investors in the SLV have had an annual rate of return of 25% over the past three years.

Gold ETF Holdings Hit All Time High As Silver ETF Holdings Decline

The SPDR Gold Shares Trust (GLD) added 10.22 tonnes of gold since last week as gold prices continue to surge higher.  The GLD now has a net gain in gold holdings of 15.80 tonnes since the first of the year.  The all time high holdings of the Gold Shares Trust was 1320.47 tonnes reached on June 29, 2010.

The value of the GLD during August has increased by 12.1% to $73.9 billion on high volume.  During July, the highest volume day for the GDL was on July 13th when 25.2 million shares traded.  On August 8th, 9th and 10th, volume on the GLD exceeded 40 million shares.  On previous occasions when trading volume in the GLD surged, gold prices either pulled back slightly or consolidated in sideways trading before continuing higher.

All of the fundamental factors that have been pushing gold prices higher for the past decade are now being amplified by a looming currency collapse and sovereign debt crises.  Adding to concerns is the apparent inability of central banks and governments to contain the rapidly expanding financial crisis.

As measured by the closing London PM Fix Price, gold started the year at $1388.50 and closed Wednesday in New York trading at $1796.50, up $51.30.  Gold has gained $407.90 or 29.4% since the first of the year.

Total holdings of all gold ETFs recently reached a record of 2,276 tonnes of gold, valued at $130 billion.  The GLD currently holds 41.7 million ounces of gold valued at $73.9 billion.

GLD - COURTESY YAHOO FINANCE


The GLD hit a new all time high in Wednesday trading, closing at $174.58, up $5.97.

GLD and SLV Holdings (metric tonnes)

August 10-2011 Weekly Change YTD Change
GLD 1,296.52 +10.22 +15.80
SLV 9,772.56 -86.36 -1,149.01

Holdings of the iShares Silver Trust (SLV) declined by 86.36 tonnes on the week but have gained 236.41 tonnes since July 1st when silver prices began rallying.

Silver prices have not kept pace with the increase in gold prices as investors worry about reduced industrial demand for silver in a severe economic downturn.  Silver closed Wednesday at $39.39, up $1.58.  Silver began the year at $30.67 and is now up by $8.72 on the year returning investors a gain of 28.4%.

The SLV peaked in late April at the $50 level before prices corrected to the low 30’s.  The SLV has had an average annualized total return of 25% over the past three years.

The iShares Silver Trust currently holds 314.2 million ounces of silver valued at $12 billion.


SLV - COURTESY YAHOO FINANCE

As the world economy marches off the edge of the cliff and many wonder why, we look back at some prophetic  thoughts from Bill Murphy, co-founder of the Gold Anti-Trust Action Committee (GATA) in an interview with The Motley Fool in June 2010.

“What’s important for your readership to understand is that the markets have been made dysfunctional by U.S. policy and what these bullion banks are doing. Even Alan Greenspan said recently that interest rates were left too low for too long. Had the gold price been allowed to trade freely, interest rates wouldn’t have been able to stay down as low as they were. It would have been a warning sign for people not to get involved in the behavior that they did … not to go with all of the risks that developed. And there’s a good likelihood that the disaster would have been nowhere near as bad as it was.

“Alan Greenspan called gold a “thermometer.” So they diffused the thermometer by keeping the gold price managed. And what’s important for people to understand now is that the same thing is going on. If we’re correct, it’s going to lead to a bigger catastrophe, because no one has learned any lessons.”