May 19, 2024

Physical Gold Outperforms Vanguard And Fidelity Gold Mutual Funds

Investors in gold mutual funds have dramatically underperformed the return from holding physical gold over the past three years.  For a variety of reasons, many gold mining companies have been unable to turn higher gold prices into increased earnings.   As a result, gold stock mutual funds have dramatically underperformed the price gains of gold bullion.

Over the past three years, gold has increased by 80%, from a monthly low of $853 in May 2008 to $1,535 at today’s closing price.  Holders of the physical metal have done extremely well while investors in gold mutual funds run by two of the countries largest investment companies (Vanguard and Fidelity) have dramatically underperformed.

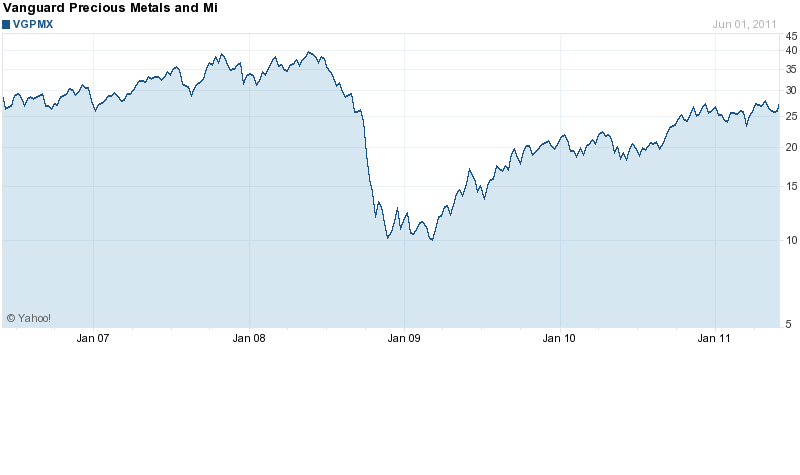
According to the Vanguard web site, the Vanguard Precious Metals and Mining Fund (VGPMX) has a three year average annual performance of -.46%, while the price of gold has soared 80%.  Vanguard states that although this fund is not a “pure gold or precious metals fund”, it invests in companies that are ” involved in the mining or of exploration for precious and rare metals and minerals”.  The Vanguard precious metals fund invests in 50 different stocks in 14 different countries and foreign holdings total 92% of assets.  The fund has net assets of $5.8 billion.

In early May 2008, the VGPMX reached $39 per share compared to today’s closing price of $27.20.  The fund has paid out dividends which added to the overall returns of the fund.

VGPMX - COURTESY YAHOO FINANCE

The ten year return on the Vanguard gold fund, however, would have outperformed holding physical gold.  A $10,000 investment in the Vanguard Precious Metals Fund made in May 2001, would now be worth approximately $76,300.  In May 2001, an investor could have purchased almost 38 ounces of gold for $10,000 which today would be valued at $58,330.  As noted above, the dividend payments by VGPMX added to the fund’s return.

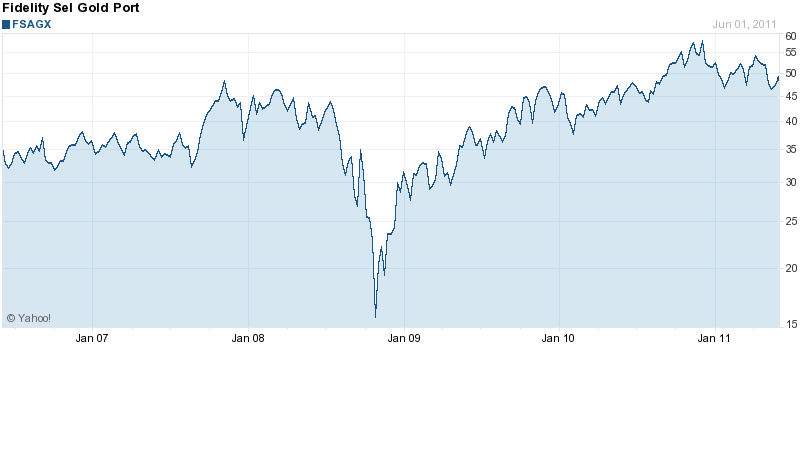
The Fidelity Select Gold Portfolio (FSAGX) has outperformed the Vanguard fund, but still trails the three year return on gold bullion.  According to the Fidelity web site, the Fidelity gold portfolio had a 3 year return of 16.2%, compared to an 80% increase in the price of gold.

The Fidelity Fund invests at least 80% of its assets in companies involved in gold mining, exploration or processing.  The Fund also invests in gold bullion or coins and to a lesser degree, platinum, silver and diamonds.  The FSAGX has net assets of $4.5 billion.  The top ten holdings of the Fund at March 31, 2011 were Goldcorp, Barrick Gold, Newcrest Mining, Anglogold Ashanti, Newmont Mining, Kinross Gold, Agnico-Eagle Mines, Yamana Gold, Rangold Resources and Eldorado Gold Corp.  The total number of holdings of the Fund is 131.

FSAGX - COURTESY YAHOO FINANCE

The long term results of the Fidelity gold fund slightly trail the Vanguard gold fund.  Fidelity had a 10 year average annual performance of 22.54% compared to a return of 24.02% for Vanguard.   Both the Vanguard and Fidelity fund had returns that exceeded the increase in the value of gold over the past ten years.

Will physical gold or gold mutual funds deliver the best return going forward?

A continued rise in gold prices should eventually translate into higher leveraged profits for gold mining companies, unless the substantial costs of gold mining exceed the increase in gold prices.  Inflation is rapidly rising as central banks continue to flood the global economy with cheap money.  A continued rise in energy costs and general inflation could negate the benefit of increased gold prices for gold mining companies.  Investors who hold physical gold or invest in gold trust ETFs, rather than gold mutual funds, should expect to see continued superior investment performance.
Precious Metals Stage Impressive Rally – Are Gold Stocks Next?

As measured by the closing London PM Fix Price, precious metals staged impressive gains this week, rallying across the board.  Ongoing concerns about the sovereign debt crisis in Europe, the debt limit ceiling stalemate in the U.S. and a weak dollar all contributed to continued fundamental demand for the metals.

After the London close, precious metals continued to gain in New York trading with gold at $1,537.00, silver at $38.15, platinum at $1,805.00 and palladium at $766.00.

The star of the week was silver which gained $2.89 per ounce for a gain of 8.3% on the week.  Although the correction of silver in early May was dramatic, the sharp pullback has provided long term investors with an opportunity to add to positions.  Silver fundamentals remain strong as detailed in a recent report by the Silver Institute in which it was noted that demand remained robust despite higher prices.  In addition, although higher prices has lead to increased mine exploration and production, new silver production during 2010 rose by only 2.5%.

Precious Metals Prices
PM Fix Since Last Recap
Gold $1,533.00 +42.25 (+2.83%)
Silver $37.69 +2.89(+8.30%)
Platinum $1,786.00 +19.00 (+1.08%)
Palladium $757.00 +23.00 (+3.13%)

Gold has recovered nearly all of its early May price correction and is now only $8 off its high of $1,541.00 as measured by the London PM Fix Price.  The trend in gold remains solidly bullish and any price corrections should be viewed as a buying opportunity.


GOLD - COURTESY STOCKCHARTS.COM


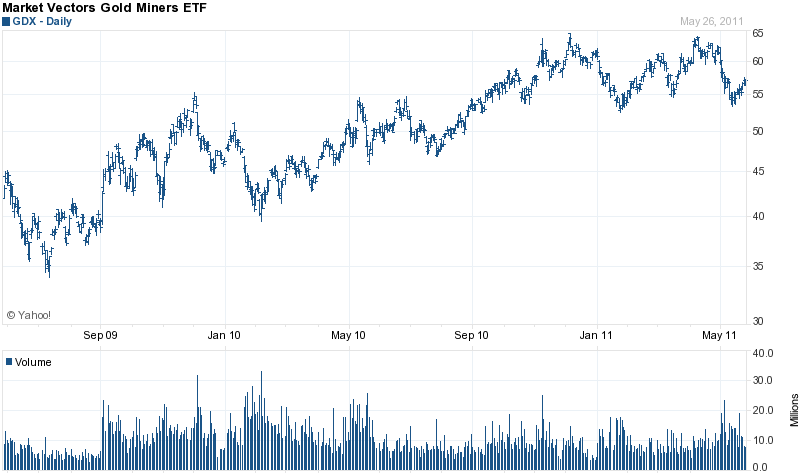
Gold stocks, many of which have trailed the returns of gold bullion, may also be viewed as attractive at this point. As measured by the Market Vectors Gold Miners ETF (GDX),  gold stocks are moving up after making multiple bottoms at the $55 support level.


GDX - COURTESY YAHOO FINANCE

Many of the gold mining stocks are selling at steep discounts to their gold reserves and represent solid values. Earlier this week, Kinross Gold, which sells at the equivalent of $250 per ounce, was a featured story. Value investor David Steinberg of DLS Capital Management, has a price target on Kinross of $27 per share. Kinross closed today at $16.11.

Sale Of U.S. Gold Reserves Would Accomplish Little

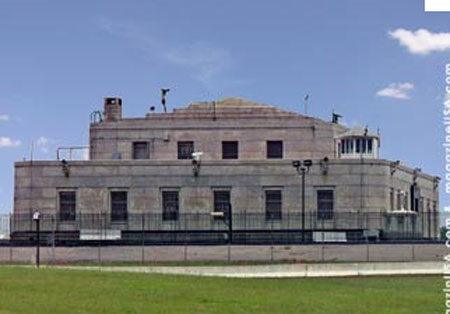
FORT KNOX

The U.S. slammed against the $14.3 trillion debt ceiling last week with a quick resolution to the problem no wheres in sight.

Congressional authorization to extend the debt limit remains mired in ideological disputes.  Secretary of the Treasury Tim Geithner states that the U.S will default in early August if the debt ceiling is not raised.

As the Treasury scrambles to avoid default, a discussion has started on the merits of selling United States gold reserves to avoid default and put the U.S. back on sound financial footing.

While the sale of U.S. gold reserves may appear to be an appealing solution, it would accomplish virtually nothing from a financial standpoint.

According to the U.S. Treasury, total gold holdings of the United States as of April 2011 were 261.5 million troy ounces.

At $1,500 per ounce, the total value of U.S. gold reserves is about $393 billion.  Sound like a lot of money?  Enough to get the U.S. out of the debt/spending crisis that we are in?  Here’s what the U.S. could do with an extra $393 billion.

  • Pay off 2.75% of the national debt
  • Pay less than one year’s interest on the national debt
  • Reduce the estimated 2011 budget deficit of $1.645 trillion by about 23%
  • Reduce this year’s U.S. budgeted spending of $3.8 trillion by about 10%
  • Pay for 40% of the $1 trillion dollar cost of the wars in Iraq and Afghanistan
  • Cover about 33% of the estimated cost of the bailing out Fannie Mae and Freddie Mac
  • Cover half of one percent of the estimated unfunded U.S. government liabilities for social security and medicare
  • Pay off about 4% of total mortgage debt held by American families

Selling the U.S. gold reserves may sound like a good idea until you take a look at the numbers.  The total value of U.S. gold reserves amounts to a mere rounding error in terms of total U.S. debt, spending, deficits and future obligations.   The United States has numerous valuable assets that it could sell, but the sale of U.S. gold reserves would accomplish little.


The Federal Reserve Can’t Produce Oil, Food Or Jobs But They Will Continue To Produce Dollars

Federal Reserve

No bull market goes straight up without normal price corrections along the way.  The recent sharp pullback in silver prices and the more subdued correction in gold prices are likely to be viewed in hindsight as a superb buying opportunity.

Simple trend line analysis suggests that current prices for gold and silver are in a buying range.  Using the SLV and GLD as proxies for the metals, we can see that the recent sell off has brought prices to trend line support.   Combining the “trend is your friend” theory along with solid fundamental underpinnings for gold and silver, higher prices seem inevitable.  For patient long term investors, especially in the gold market, every pullback of the last decade has simply been another opportunity to exchange depreciating paper dollars into a better store of value.

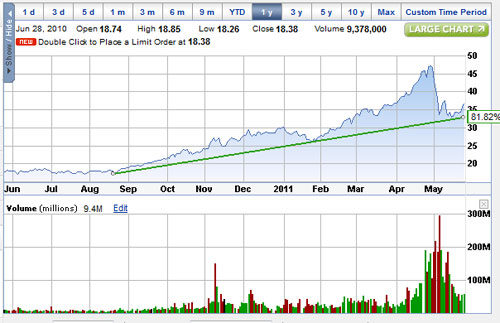
The SLV recently hit its trend line in the low 30’s.

SLV - COURTESY ETRADE.COM

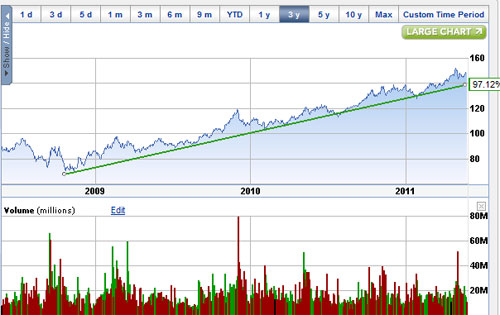
The GLD’s long term trend line does not even hint of parabolic price movement, contrary to mainstream press reports warning the public of the dangers of gold investing.

GLD - COURTESY ETRADE.COM

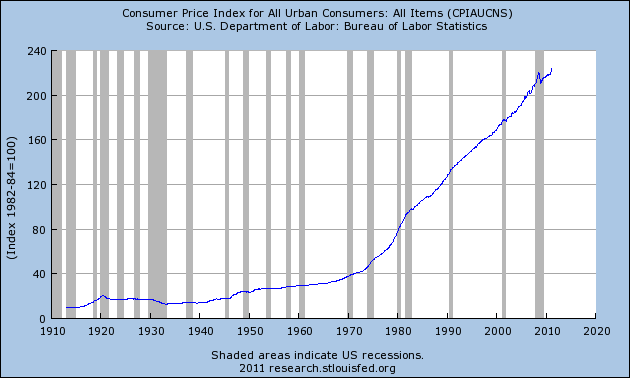
Despite the assertions of Fed Chairman Bernanke that inflation is not a problem, any one outside of the academic inner circle of the Federal Reserve sees inflation everywhere they look.  Soaring gasoline and heating costs have decimated family budgets and retail food inflation is projected to hit 4% or higher in 2011.  Constantly higher inflation, as measured by the Consumer Price Index, has prevailed ever since the U.S. officially went off the gold standard in the early 1970’s.  (See also Why Higher Inflation and $5,000 Gold Are Inevitable).

This week we have seen announcements of higher prices by Starbucks, Smucker Co, Nestle, McDonald’s and Whole Foods.  Walmart previously warned that the debasement of the dollar was translating into higher retail prices on imported items.  The upward price spiral in the cost of necessities is especially burdensome since incomes for the majority of Americans are not increasing.

In an excellent article in the Wall Street Journal this week, Ronald McKinnon persuasively suggests that the United States is entering 1970’s type stagflation, the result of high inflation, high unemployment and stagnant demand.  According to Mr. McKinnon,  “the U.S. economy again seems to be entering stagflation. April’s producer price index for finished goods, which excludes services and falling home prices, rose 6.8%. The Bureau of Labor Statistics reports that intermediate goods prices for April were rising at a 9.4% annual clip. Meanwhile the official nationwide unemployment rate is mired close to 9%.”

McKinnon argues that stagflation is being caused by the Fed’s zero interest rate policies (which besides robbing retirees and savers), has cause a global flood of hot money that has resulted in surging inflation in Asia and Latin America and a 40% rise in commodity prices over the past year.

The Federal Reserve’s policy options at this point seem limited to continuing their policies of cheap money and dollar debasement.  The Fed cannot produce oil as Bernanke recently commented.  Nor can the Fed produce food, jobs or higher housing prices.  The one thing the Fed can and has done is to produce paper dollars in extraordinary quantities.  Debt, when allowed to expand to levels that make repayment impossible, leaves the debtor with no good options – a point that we are rapidly approaching. (See also Why There Is No Upside Limit To Gold and Silver Prices).

How Wall Street Pros Made Huge Profits On Silver ETF Crash As Small Investors Sold

The holdings of the iShares Silver Trust (SLV) declined by a substantial 505.10 tonnes from the previous week.  The decline in SLV silver holdings from the all time high of 11,390.06 tonnes reached on April 25th comes in at a hefty 1,448.73 tonnes or 12.7%.  Silver, meanwhile, has declined in price by $8.31 per ounce or 18.3% since April 25th.

Although the price per share of the SLV tracks the price per ounce of silver very closely, the actual bullion holdings of the SLV can fluctuate, sometimes dramatically, from the underlying price movements of silver.  This same situation applies to the SPDR Gold Shares (GLD).

The reason why the physical holdings of the SLV and GLD do not closely track the price of gold and silver is due to the complex mechanism by which Authorized Participants can “create or redeem” shares in the SLV and GLD.  The silver and gold trusts are structured to allow large Wall Street investment firms to act as Authorized Participants to arbitrage against a premium or discount of the SLV or GLD share prices to the underlying net asset value of the Trusts.

Premiums or discounts to the net asset value of the Trusts occur based on normal supply and demand by investors during the course of trading in SLV and GLD shares.  The Authorized Participants routinely reap profits from their arbitrage activities based on the prevailing discounts or premiums .  According to the prospectuses of the GLD and SLV, the Trusts were structured in this manner to allow the price of the GLD and SLV shares to closely correspond to the underlying value of gold and silver bullion.

The Trusts do not directly buy or sell bullion based on investor buy or sell orders for the SLV and GLD.  The Trusts are not structured like a typical mutual fund which liquidates its holdings if there is a surge of investor redemptions.  Changes in the number of Trust shares outstanding and changes in holdings of gold and silver occur only based on the creation or redemption of shares through Authorized Participants.

Premiums or discounts of the SLV and GLD shares to net asset values are normally less than 1% but can expand dramatically when trading is volatile.  For example, on May 2nd, when silver prices were plunging, the shares of the SLV reached a huge discount of 9.87% from the net asset value of silver held by the SLV Trust.  Investors desperately seeking to liquidate their SLV shares caused the value of the SLV to trade at a steep discount to the underlying net asset value of the Trust.

At this point the lucky Wall Street pros who act as Authorized Participants were gladly buying the SLV shares and simultaneously shorting silver bullion, locking in huge profits.  Authorized Participants who arbitraged during this volatile trading profited greatly at the expense of panicky SLV sellers who sold shares of the SLV at $42.79 that were worth $47.51 based on the net asset value of the SLV.  (Pricing data on the SLV share discount was obtained from the iShares Silver Trust web site).

The Authorized Participants who bought SLV shares during the panic sell off then delivered their SLV shares to the iShare Trust and requested that they be redeemed for silver bullion which was then used to close out short positions in silver bullion.  Under this situation, the silver bullion holdings of the SLV decreased since they delivered silver bullion to the Authorized Participants in exchange for redeemed SLV shares.  This is exactly the situation that has occurred during the May silver sell off and it is therefore no surprise that the holdings of the SLV have plunged.

The average investor in the iShares Silver Trust would be hard pressed to understand the “creation and redemption” features of the SLV shares.  Although the SLV can be an easy way for an investor to participate in silver bullion ownership, my investment thesis is to avoid investments that cannot be fully or easily understood.

For investors seeking to establish investments in gold and silver without having to hold the physical metal, the Sprott Physical Gold Trust (PHYS) or the Sprott Physical Silver Trust (PSLV) offer better opportunities.  Both of these Trust hold specific amounts of physical gold or silver which do not change.  Each share holder has an unallocated interest in the precious metals held by the Trust.

All precious metal holdings of the Sprott Trusts are secured not by a bank, as with the GLD, but by the Royal Canadian Mint of the Canadian Government which is responsible for any loss or damage .  The gold or silver backing the Sprott Trusts are specifically allocated by the Mint to the Sprott Trusts.

From a total investment return standpoint, it is also important to note that the shareholders of the PHYS and PSLV are taxed at the capital gains rate of 15% (if held for more than one year) whereas shareholders of the GLD and SLV are taxed at 28%.  For further information see Sprott Physical Gold Trust Advantages Over SPDR Gold Shares Trust.

GLD and SLV Holdings (metric tonnes)

May 25-2011 Weekly Change YTD Change
GLD 1,214.08 +22.74 -66.64
SLV 9,941.33 -505.10 -980.24

Holdings of the SPDR Gold Shares Trust (GLD) increased by a modest 22.74 tonnes from the prior week to 1,241.08 tonnes.   The GLD held 1,280.72 tonnes at the beginning of the year.  The all time record holdings were reached on June 29, 2010 at 1,320.47 tonnes.  The GLD currently holds 39.0 million ounces of gold bullion valued at $59.6 billion.

Precious Metals Little Changed On Week While Investors Ponder Government Defaults

Precious metal prices traded in a narrow range this week.  As measured by the closing London Fix Price, gold, platinum and silver declined slightly while palladium gained $16 per ounce.

After the London close, prices of precious metals rose across the board in New York afternoon trading.  Gold closed at $1,514.50 up $19.70, silver at $35.26 up $.12, platinum at $1,775 up $8 and palladium at $739 up $8.   Buying in the precious metals may have been prompted by late day worries over the downgrade of Greek debt by Fitch Ratings as well as concerns over the worsening state of public finances in Spain, Portugal and Italy.

Yields of 25% on short term debt Greek debt imply that the markets are are pricing in a very high probability of default by Greece.  What markets do not seem to have priced in is the contagion risk of Greek default and what impact that would have on investor confidence, world financial markets and the global banking system.

Meanwhile the U.S. debt crisis continues to brew as the debt ceiling limit was reached with no indication of a resolution by Congress.  If the past is any guide, Congress will let the debt bomb/deficit crisis simmer until the last minute when the debt ceiling will be raised yet again under the guise of “future fiscal restraint” and the deficit spending and borrowing will continue as usual.

Ignoring the eroding financial condition of the U.S. today only ensures that the inevitable financial crisis will be more devastating than one might chose to contemplate.  The timing may be uncertain but the outcome is not.

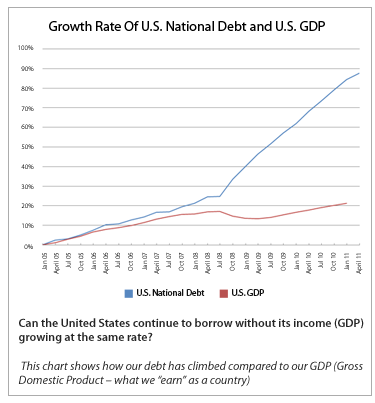
The American Precious Metals Exchange (APMEX) included a chart in one of its latest email newsletters that depicts the gap between the growth of  U.S. GDP and debt.  The chart graphically illustrates the extent to which the U.S. has been living beyond its means and using trillions in deficit financing to do so.

DEBT VS GDP - COURTESY APMEX

APMEX also notes that  “If there is no resolution (of the budget ceiling) by August 2nd, there could be disastrous ramifications for the U.S. and the global economy. The U.S. will be in default on its promises to pay. The value of the dollar could drop dramatically.”


Precious Metals Prices
PM Fix Since Last Recap
Gold $1,490.75 -15.00 (-1.00%)
Silver $34.80 -1.40(-3.87%)
Platinum $1,767.00 -7.00 (-0.39%)
Palladium $734.00 +16.00 (+2.23%)

Precious metals, silver in particular, have been undergoing corrective price action during May, but the fundamental reasons for owning precious metals grows stronger by the day.   Demand for precious metals remains strong.  The World Gold Council’s latest report shows that global demand for gold increased by 11% in the first quarter, while buying by Chinese investors reached all time highs.  The trend is still your friend in the precious metals markets and price weakness should be viewed as an opportunity to increase long term positions.

Gold Demand Soars As Chinese Buying Surges To Record Levels

According to the World Gold Council, total global demand for gold in the first quarter of 2011 jumped by 11% to 981.3 tonnes.   Gold demand was driven by increased investor purchases, especially in China where surging demand for gold reached record highs.

The World Gold Council foresees increased 2011 gold demand based on fundamental factors that include unrest in the Middle East, the sovereign debt crisis in Europe, global inflationary worries, weakness in the U.S. dollar, concern over a slowing U.S. economy and continued strong physical demand for gold by China and India.  Increased purchases of gold by central banks is also likely to increase to protect reserves against paper currencies issued by over indebted sovereign nations.

The World Gold Council noted that gold hit its eight consecutive record high price during the first quarter of 2011 after a brief pullback in prices early in the year.   Due to higher prices the value of gold purchased during the first quarter rose by almost 40% from $31.4 billion to $43.7 billion.

Investment demand surged by 26% during the first quarter to 310.5 tonnes and represented 31.6% of total first quarter gold demand.  The investment demand category includes physical bars, official coins, medals and ETF products.  Investors showed a strong preference for holding physical gold as bar demand increased by 62%, official bullion coins by 39% and medals by 3%.  Bullion holdings by ETFs declined by 55.9 tonnes during the quarter as investors decided to hold more physical gold due to worries about counterparty and credit risk.  Despite the reduction in first quarter ETF holdings, total global holdings of ETFs amount to 2,100 tonnes valued at approximately $95 billion.

Jewelry demand of 556.9 tonnes accounted for 56.8% of total gold demand during the first quarter.  Total jewelry demand grew by 7% during the first quarter with India and China accounting for 63% of total demand.  China, which has seen explosive demand for gold over the past decade, registered a 21% increase in jewelry sales to 142.9 tonnes.

Technology demand for gold, which includes electronics, industrial and dental use declined slightly to 113.8 tonnes.  Gold demand by the electronics industry remains strong and during 2010, the industry consumed a record 326.8 tonnes.

Despite the surging global demand for gold, supply is not increasing and actually dropped by 39.9 tonnes or 4.4% during the 2011 first quarter compared to last year’s first quarter.  The decline was primarily due to large central bank purchases which the World Gold Council deducts from available supplies.  Central Banks have been rapidly increasing their purchases of gold reserves and during the 2011 first quarter purchased 129 tonnes of gold  which exceeded the total amount purchased during the first nine months of 2010.

Surging gold prices should be a natural incentive for the mining industry to increase production but this has not been the case.  Mine production increased by only 7% to 663.9 tonnes during the first quarter, trailing total demand of 981.3 tonnes.  During 2010 gold mine production provided  62% of total supply with recycled gold accounting for the bulk of other supply.

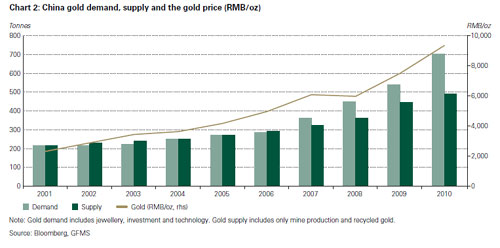
The big picture in the gold market remains focused on China.  The World Gold Council report notes that “The past 10 years have witnessed exponential growth in China investment demand for gold, which entered a new era with the opening of the Shanghai Gold Exchange.   By the end of 2010, annual gold demand totalled 187.4 tonnes, an increase of 71.1% over the previous year.”

Chinese gold demand has been increasing by 14% per year since 2001 with jewelry accounted for 64% of total demand.  During 2010 gold jewelry demand in China was 451.8 tonnes, up 100% since 2004.  Chinese gold investors are also huge buyers and in the first quarter of this year were the largest buyers in the world of physical bullion coins and bars.

The World Gold Council expects Chinese gold demand to double within less than ten years due to gold demand based on Chinese culture, inflationary fears, buying by the Chinese Central Bank, a desire to diversify wealth holdings, advise from prominent Chinese economists to increase gold reserves, increased institutional demand and increased demand by a growing middle class.

Courtesy World Gold Council


Why Higher Inflation And $5,000 Gold Are Inevitable

In his press conference on April 27, 2011, Federal Reserve Chairman Bernanke dismissed inflation worries, stating that “Our expectation is that inflation will come down and towards a more normal level”.   Should we believe him?  Not if you want to preserve your wealth and here’s why.
Chairman Bernanke has a perfect record of making inaccurate economic forecasts.

  • Bernanke, March 2007, prior to the historic housing crash said,  “At this juncture . . . the impact on the broader economy and financial markets of the problems in the subprime markets seems likely to be contained.”
  • Bernanke, February 2008, prior to the banking crisis that almost resulted in the collapse of the entire U.S. banking system  said, “I expect there will be some failures. I don’t anticipate any serious problems of that sort among the large internationally active banks that make up a very substantial part of our banking system.”
  • Bernanke, June 2008, prior to the worst recession and job losses since the 1930’s, said the danger of the economy falling into a “substantial downturn” appears to have waned.

Even if the Fed was able to keep inflation at a “benign” rate of 2% a year, the long term effects on savings are devastating.  Over ten years, a 2% inflation rate reduces the value of $100,000 to $82,034, resulting in an 18% loss in purchasing power.

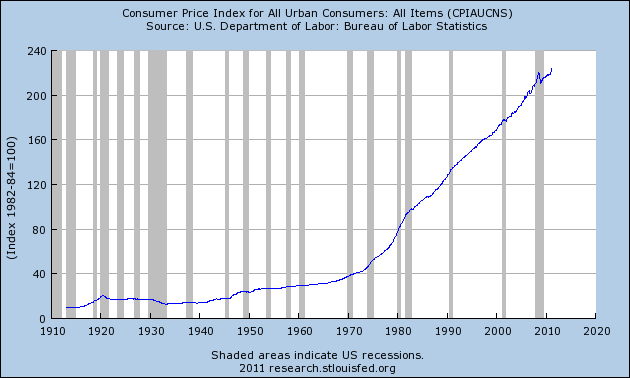
According to the Bureau of Labor Statistics, inflation averaged 3.4% since 1980.  At the beginning of 1980, one dollar had the same purchasing power as $2.86 at the end of 2010.

The cost of living has spiraled upwards since the early 1970’s, correlating perfectly to the point at which the value of the dollar was decoupled from gold.  In 1971, the United States stopped exchanging dollars for gold to foreign official holders of dollars and the dollar gold standard was officially ended in 1973.

The Fed’s policy of pushing easy credit for the past 30 years to fuel economic growth has left Americans swimming in debt.  The housing collapse and declining incomes have resulted in millions of mortgage defaults and underwater homeowners.  The Government’s attempt to bailout a collapsing economy and over leveraged banks and consumers has resulted in trillions of dollars in new debt and a $1.5 trillion deficit.

Government debt has exploded to the point where the solvency of the U.S. Government is now being questioned.  Large tax increases to erase the deficit would spin the U.S. into a deep recession.  The President and Congress lack the political will to cut spending.  The U.S. has spent and borrowed itself to the eve of financial ruin and must “inflate or die” at this point (see Why There Is No Upside Limit For Gold and Silver Prices).

The Fed, with the experience of two money printing campaigns already under its belt, will have no problems extending this practice.  As Bernanke noted in 2002 before he became Fed Chairman, “The U.S. Government has a technology, called a printing press, that allows it to produce as many U.S. dollars as it wishes at no cost”.

The Fed’s cheap money policies and concerted efforts to debase the value of the dollar are just beginning, and that means the biggest move up in precious metals is still in front of us.  My minimum long term forecast for gold remains at $5,000 per ounce and silver at $170 per ounce.

Gold And Silver ETFs Show Modest Decline In Holdings

The holdings of the iShares Silver Trust (SLV) declined slightly on the week by 53.10 tonnes as silver prices continued to consolidate after the sharp sell off of early May.
Since the beginning of the year, holdings have declined by 434.19 tonnes to the current level of 10,540.48 tonnes.  The all time record holdings of the SLV were 11,390.06 tonnes on April 25th, as the price of silver was approaching the $50 per ounce level.

Even after the early May pullback, silver has rewarded investors with a gain of 29.7% from the January low of $26.68.  The SLV has delivered a total return of 115.4% over the past year, and an average 25.8% yearly return since its inception in April 2006.

Despite the downturn in ETF holdings, there is strong evidence of continued strong fundamental demand for silver:

  • The U.S. Mint continues to ration sales of silver bullion coins, as total production cannot meet full market demand. This has led to higher premiums for American Silver Eagles and the newly introduced America the Beautiful Silver Bullion coins.
  • Dealers are reporting continued high demand for silver bullion as an increased number of new investors seek to protect their wealth by diversifying out of paper currency and existing investors use the reduced prices to increase holdings.
  • Investor demand for physical gold and silver is growing dramatically in countries such as India.  According to the Financial Times, silver traders in India report that “People are booking incredible amounts of Silver as they see the current drop in prices as a great opportunity to buy more…most are buying for pure investment.”

Meanwhile, the cheap money policies of the Federal Reserve are not likely to change any time soon.  Minutes of the last Fed meeting on April 27-28th, indicate that the Fed extensively discussed an exit strategy from its easy money policies but provided no guidance on timing.  Most analysts have concluded that it may be years before the Fed actually starts to tighten monetary policy.

GLD and SLV Holdings (metric tonnes)

May 18-2011 Weekly Change YTD Change
GLD 1,191.34 -9.70 -89.38
SLV 10,540.48 -53.10 -434.19

Holdings in the SPDR Gold Shares Trust (GLD) declined slightly on the week by 9.7 tonnes.  It was disclosed this week that investor George Soros sold 4.7 million shares of the GLD during the first quarter, bringing his holdings down to a token 49,400 shares.  The liquidated shares were valued at $684 million based on today’s closing price of the GLD.  The 4.7 million shares of GLD represented only approximately 15 tonnes of gold or 1.2% of total GLD holdings.

Was Soros turning negative on gold, as suggested by the media, or was Soros simply taking some short term profits?  While Soros was selling, legendary hedge fund manager John Paulson did not reduce his massive stake of $4.4 billion in the GLD.  Although Soros has a great long term track record, during the financial panic of 2007-2008, he bought Countrywide and Lehman Brothers shortly before they collapsed.  Perhaps history will repeat and the sale of gold by Soros will mark a major bottom in the gold market.

The long term uptrend in gold is still intact and supported by the fundamentals (see Insights From A Legendary Gold Investor).   Since the SPDR Gold Shares inception date of November 12, 2004, the fund has had a spectacular annual average return of 19.6%.  The GLD currently holds 38.3 million ounces of gold valued at $57.3 billion.


Soros Sells Gold But Also Bought Lehman Brothers and Countrywide Right Before Their Collapse

Countrywide Financial Corp

The $28 billion Soros Fund Management disclosed in SEC filings that it had sold virtually all of its holdings in the SPDR Gold Trust (GLD). At the end of the March, the Soros Fund, run by renown George Soros, owned only 49,400 shares of GLD after selling 4.7 million shares in the first quarter.

Rumors of GLD liquidation by Soros has been public for weeks now and may have contributed to the recent decline in the price of gold.

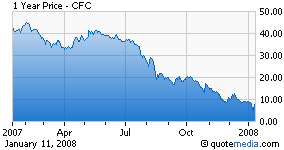
George Soros is one of the world’s most prominent hedge fund investors with a great track record, but like any investor, some of his stock picks have been disastrous. In late 2007, as financial stocks were swooning due to disclosures of huge mortgage loan losses, Soros acquired shares of Countrywide Financial. In the quarter ending September 30, 2007, the Soros fund picked up 1.8 million shares of Countrywide, acquired at an estimated average price of $25. As financial markets collapsed in 2008, Countrywide’s price plunged and it was ultimately acquired by Bank of America at $7 per share.

As markets plunged in 2008, Soros apparently could not comprehend the severity of the financial crisis. During the quarter ending June 30, 2008, Soros increased his stake in Lehman Brothers to almost 9.5 million shares from only 10,000 at the end of March. By mid August 2008, Lehman Brothers stock had plunged 80% on the year as losses on toxic debt holdings climbed into the billions. Shortly thereafter, when the Fed refused to bail out Lehman Brothers, they collapsed on September 15, 2008.

Time will tell if the decision by Soros to liquidate his gold position turns out to be another disastrously ill timed move.

Meanwhile, hedge fund manager John Paulson, who made billions during the financial crisis by shorting subprime mortgages has not reduced his massive $4.4 billion investment in the SPDR Gold Trust.

Soros may be playing the role of a short term trader while Paulson waits for the big payoff as he did with his bets on subprime mortgages.   Trader sentiment in both commodities and precious metals had become massively bullish  and with markets vulnerable to a sell off, perhaps Soros simply decided to take some profits short term.

Ultimately, market fundamentals suggest much higher gold prices and it would not be surprising to see the Soros Fund reestablish gold positions at some later date.