March 29, 2024

Lowering Gold Stock Portfolio Risk Through Diversification

There are numerous investment strategies available to capitalize on the gold bull market.  Gold investors have the option of investing in gold bullion, gold coins, gold ETFs, gold mutual funds and individual gold mining stocks.

Although many gold investors prefer to exclusively hold physical gold, diversifying into selected gold stocks can dramatically increase total returns.  Although gold stocks as a group have recently underperformed bullion, selected gold stocks have outperformed gold bullion.

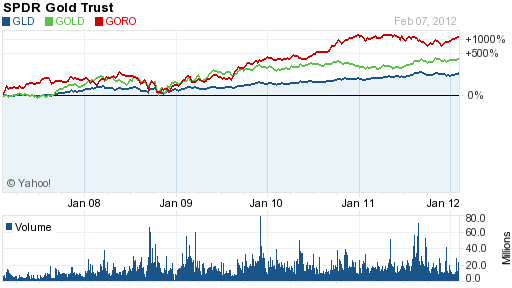
Well managed gold mining companies with large ore reserves and increasing mine production have provided investment returns far in excess of the gain in gold bullion as seen below with the examples of Randgold Resources (GOLD) and Gold Resource Corp (GORO).  Both of these gold mining companies have vastly outperformed gold bullion when compared to the SPDR Gold Trust (GLD) which tracks the price of gold bullion.

GORO, GOLD vs GLD - Courtesy yahoo.com

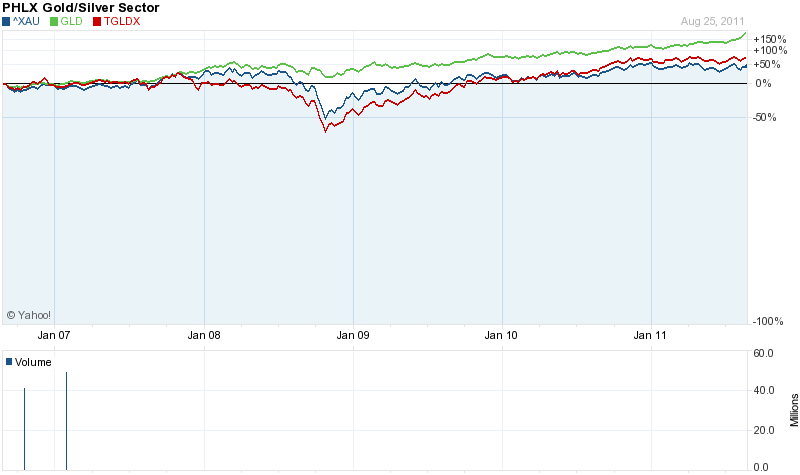
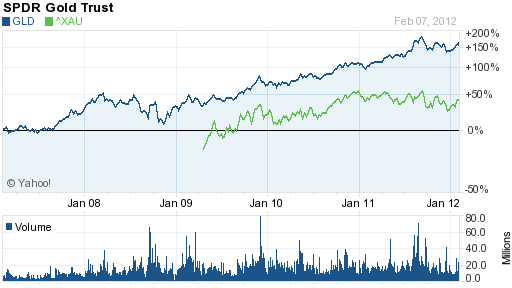
Selecting the gold stock that will outperform bullion is difficult, however, as seen by the lagging performance of the PHLX Gold/Silver Sector (XAU) when compared to the GLD.  The XAU Gold/Silver Sector is a broad based index of sixteen large precious metal mining companies.  The GLD has outperformed the XAU by three times since 2009.

GLD vs XAU - courtesy yahoo.com


As with any stock portfolio, diversification is required into order to avoid the risk of under performance.  An example of the risk of holding a gold portfolio with only a small number of stocks was seen today when the price of Nevsun Resources (NSU) collapsed by almost 31% after the company unexpectedly announced that gold production will plunge by nearly half in 2012 due to a reduction in estimated gold reserves.

Since selecting individual gold stocks can be a daunting task for investors, a better alternative would be to invest in an actively managed gold stock mutual fund with a proven record of superior investment returns.  Past performance has shown that an actively managed gold stock mutual fund has outperformed passively managed gold index funds.

One gold fund that should top the list for investors to consider is the Tocqueville Gold Fund (TGLDX), run by legendary gold investor John Hathaway.  The Tocqueville Gold Fund has a remarkable average annual return over the past ten years of 23.3%, almost double the gain in the Philadelphia Gold/Silver Index.

courtesy yahoo.com

Although gold bullion has outperformed gold stocks since 2008, Mr. Hathaway’s outlook for gold remains extremely bullish and he expects that as gold continues to increase in price, gold stocks should once again outperform the returns of gold bullion.  In his latest Investment Update, here is what Mr. Hathaway had to say.

Gold and gold stocks appear to be bottoming in the wake of a four month correction which began in mid -August when the metal peaked at $1900/oz. Bearish sentiment is at extremes not seen in many years. This and a number of other indicators, such as stocks that have been hit by negative sentiment, the downtrend in gold prices since August, and tax loss selling, support our view that a rally lies ahead. This very bullish market set-up, in our opinion, mirrors the extraordinary investment opportunity of the despondent year end in 2007. Even though gold prices have been declining for several months, they finished the year with substantial gains. This suggests that the value represented by gold mining equities held in our portfolio could be extraordinary.

Disarray in Europe is, in our opinion, a slow motion version of the global market meltdown in 2007. It appears to us that the U.S. Fed is once again acting as the lender of last resort to European central banks in their efforts to save the euro. As in 2007, U.S. sovereign credit will be substituted for failing credits, in this case, peripheral European states. The fig leaf to justify such action on the Fed’s part is sado-fiscalism, or extreme austerity packages administered by technocrats. Tough restraints on profligate public spending, which has become a way of life in all Western democracies, will not go down easily. These measures are deflationary and will be ultimately met by howls of protests from mobs demanding renewed money printing and deficit spending. In our opinion, the fundamentals for gold are stronger than ever because the outlook for paper currencies is dire. The difficult correction of the last four months has shaken out all but the strongest holders, a perfect set-up for advances to new all-time highs in 2012.
Gold Bullion Coin Sales Plunge 63% In November and 20% YTD – Have Americans Given Up On Gold?

Total sales of American Gold Eagle bullion coins plunged in November according to production figures from the U.S. Mint.

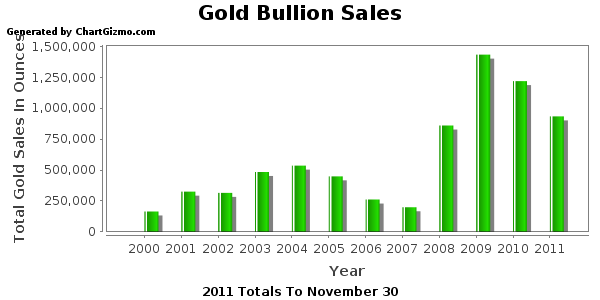
Total sales of gold U.S. Mint bullion coins declined by 63.4% in November from the previous year.  Sales of U.S. Mint gold bullion coins declined by 19.5% on a year to date basis through the end of November.  A total of 41,000 ounces were sold in November 2011 compared to sales of 112,000 ounces in November 2010.  Year to date sales through November totaled 934,500 ounces compared to the previous year to date totals of 1,160,500 ounces.

The reduction in the purchase of U.S. Mint gold bullion coins continues a trend of reduced sales since the record breaking year of 2009 when a total of 1,435,000 ounces were sold.  Total gold bullion sales  for 2011 will probably slip below one million ounces for the first time since 2009.  If sales decline in December by the same percentage amount as in November, total 2011 sales of gold bullion coins will come in at 956,500 ounces.

A summary of gold mint bullion coin sales since 2000 is shown below.

Gold Bullion Sales Since 2000

Gold Bullion U.S. Mint Sales Since 2000
Year Total Ounces Sold
2000 164,500
2001 325,000
2002 315,000
2003 484,500
2004 536,000
2005 449,000
2006 261,000
2007 198,500
2008 860,500
2009 1,435,000
2010 1,220,500
2011 934,500
Total 7,184,000

Why would gold bullion coin sales be plunging when gold has been steadily rising?  Have Americans given up on gold?  Let’s look at various trends in gold sales to get some perspective.

-Annual sales of gold bullion exceeded a half million ounces only once before 2008.  The financial crash of 2008 precipitated concerns about the integrity of both the banking system and the U.S. dollar, causing a huge increase in demand for physical gold.  Gold bullion sales exploded higher in 2008 and sales for 2011 remain far above levels seen prior to 2008 despite the recent drop in sales.

-Based on the current price of gold, the total value of all gold bullion purchased from the U.S. Mint since 2000 is $12.6 billion.  This amount represents only a fraction of the amount of investment dollars that have flowed into gold over the past decade.  In addition to purchasing physical gold, investors now have the option to purchase gold through gold trust ETFs.  The amount of money poured into the gold trust ETFs is many multitudes greater than the investment in physical gold bullion coins.  For example, since their inception in 2005, the combined gold holdings of the SPDR Gold Shares Trust (GLD) and the iShares Gold Trust (IAU) have grown to 47.2 million ounces valued at $82.5 billion.

-Gold ETFs have grown exponentially from their inception a short six years ago but the largest gold ETF, the SPDR Gold Shares Trust (GLD), has not been able to exceed its record gold holdings of 1,320.47 tonnes reached on June 29, 2010.  In addition, billionaire John Paulson recently liquidated a substantial portion of his GLD holdings, although much of the selling may have been forced due to severe losses in his hedge funds.

-Gold trader sentiment is either bullish or bearish, depending on who you talk to.

-Central banks, which have been increasing their purchases of gold since 2000, have sharply accelerated their purchases of gold bullion over the past several years.  Central banks from Asia and Latin America have accounted for most of the increased purchases.

-According to the World Gold Council, global gold investment demand increased by 33% in the 2011 third quarter compared to the prior year.  Investment demand for gold bars and coins increased by 29% and global gold holdings by gold trust ETFs increased by almost 78 tonnes.  Demand for gold increased notably during the third quarter in Europe and China.

While it is indisputable that global gold demand has increased, the appetite for gold by U.S. investors seems to be diminishing.  What do you think?


Gold Stocks Are Positioned For An Explosive Move Up

Historically, gold stocks have outperformed gold bullion.  Mining companies typically benefit from leveraged earning gains as gold prices rise and production costs remain stable.  Higher gross profits on each ounce of gold produced flow right to the bottom line, boasting profits and stock prices.

During the initial phase of the gold bull market, investors reaped greater profits by owning a basket of gold mining stocks as opposed to holding gold bullion.

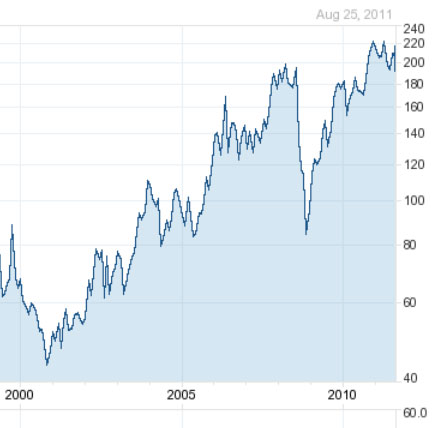
Using the PHLX Gold/Silver Index (XAU) as a proxy for mining stocks, the XAU significantly out performed gold bullion during the initial stages of the gold bull market from 2000 through 2008.  From 43.87 in October 2000, the XAU advanced to 195.25 in June 2008 for a gain of 345%.  During that same period of time, gold rose from $264 in October 2000 to $930 in June of 2008 for a gain of 252%.

XAU GOLD/SLVER INDEX - COURTESY YAHOO FINANCE

Since 2008, however, the price correlation of gold mining stocks to gold bullion has reversed.  Despite a doubling in the price of gold since 2008, the XAU is only marginally higher at 210.93 for a very paltry gain of 8%.  An investor who was super bullish on gold since 2008 would have gained virtually nothing in mining stocks while the price of gold soared.

Investors in broadly diversified precious metal mutual funds had equally poor results.  As of June 2011, both the Vanguard and Fidelity gold mutual funds have drastically under performing gold bullion since 2008.  The Vanguard Precious Metals Fund (VGPMX) actually delivered a horrendous three year return of minus 0.46% as the price of gold soared 80%.  The only investors in gold mining stocks since 2008 who made profits were those astute enough to pick the handful of mining stocks that out performed gold bullion.

Even the Tocqueville Gold Fund (TGLDX), run by legendary gold investor John Hathaway, has been unable to outperform gold bullion since 2008.


XAU, GLD, TGLDX - COURTESY YAHOO FINANCE

Some of the reasons for the disconnect between gold mining companies and gold bullion since 2008 include the following.

  • Investors learned the downside risks of leverage during 2008 when gold stocks got absolutely crushed while the price of gold bullion had a relatively modest decline.  As measured by the XAU, gold stocks declined by a devastating 65.7% during 2008 while gold bullion declined by only 29% from a peak of $1,011 to a low of $713.
  • A growing preference for holding physical gold and silver.
  • The realization by investors that it takes an in-depth technical knowledge of the mining industry as well as the ability to analyze financial statements to be able to pick the gold mining stock that will outperform gold bullion.
  • Gold mining companies can go bankrupt while gold bullion is eternal and will always retain a value and constitute a store of wealth.  Long time gold investors may remember stocks like Echo Bay Mines, Royal Oak Mines and many others which became worthless.
  • The introduction of gold ETFs such as the SPDR gold shares (GLD) created competition for gold mining stocks.  Before gold ETFs were established, investors who wanted exposure to the gold market without having to hold physical bullion would have had to invest in gold mining shares.  The GLD recently became the largest ETF by value with holdings of over $70 billion in gold bullion.

Investor preference for gold bullion and gold ETFs over mining stocks has created a vast pricing disparity between gold bullion and gold stocks.  High quality major gold producers with vast proven reserves of gold are now on the bargain table.  Gold stocks are selling at almost all time lows compared to gold bullion.   Two bargain gold mining stocks previously featured in goldandsilverblog.com are Newmont Mining (NEM) and Kinross Gold (KGC).  Investors in Kinross Gold, for example, are effectively buying gold at around $300 per ounce.

Markets can price stocks far below fundamental values, sometimes for an extended period of time, but ultimately the underlying value will be reasserted.  Gold mining stocks at this time represent immense value and are being steeply discounted.

What will be the trigger for an explosive move up in quality gold mining stocks?  Consider Glencore’s recent bids for nickel, coal and copper miners as reported in ft.com.

Glencore on Wednesday launched a A$268m (US$280m) bid to acquire full control of Minara Resources, an Australia-based nickel miner in which it already has a 73 per cent stake. Last month it offered $475m (£295m) to acquire one of Peru’s largest copper prospects, the Mina Justa project.

Industry executives said that Glencore’s latest target was Optimum, South Africa’s fourth largest coal exporter. The trading house is close to launching a bid for the Johannesburg-listed miner with the support of several South African partners, executives said.

Gold mining stocks have become  irresistible take over targets.  The first takeover bid for a gold mining company will trigger a buying stampede which could rapidly result in a doubling of gold stock prices from currently depressed levels.

Gold And Silver ETF Holdings Remain Steady As Gold Plunges

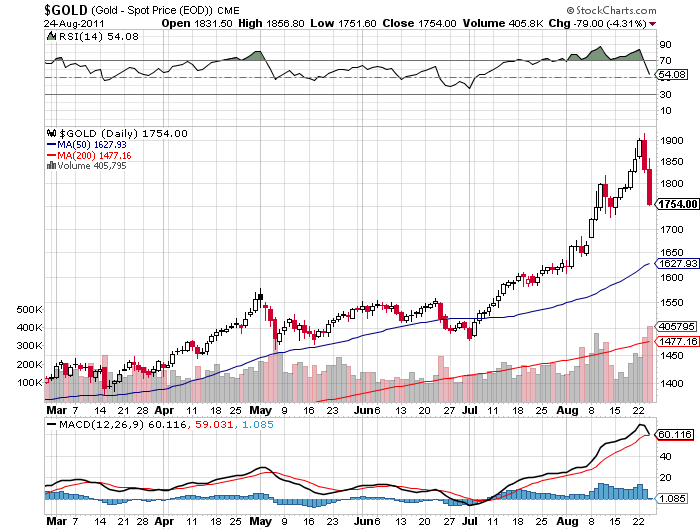
Gold’s non stop advance since early July saw a rapid reversal on Wednesday as gold lost $104.20 to close at $1,752.30 in New York trading.

Gold prices have soared this year on fears of another financial crisis and the continual debasement of paper currencies by governments that are tottering on the brink of default.  Gold began the year at $1,388.50 and by early May traded over $1,550.  After consolidating for two months, gold broke out of its trading range in early July and breached the $1,900 level earlier this week.  Despite today’s sharp sell off, gold is still up $363.80 or 26% for 2011.

As short term trend traders, hedge funds and speculative buyers jumped into gold, prices became overbought with gold trading $423 above its 200 day moving average.  The same traders playing gold for short term profits jumped out just as quickly when prices started to reverse.  Two factors that encouraged profit taking in gold were reports that the Fed would not immediately announce another round of money printing and the sharp hike in margin requirements on gold futures by the CME Group.

On a short term basis gold was overbought and due for a correction after an almost vertical rise from $1,500 as can be seen below.


Gold - courtesy stockcharts.com

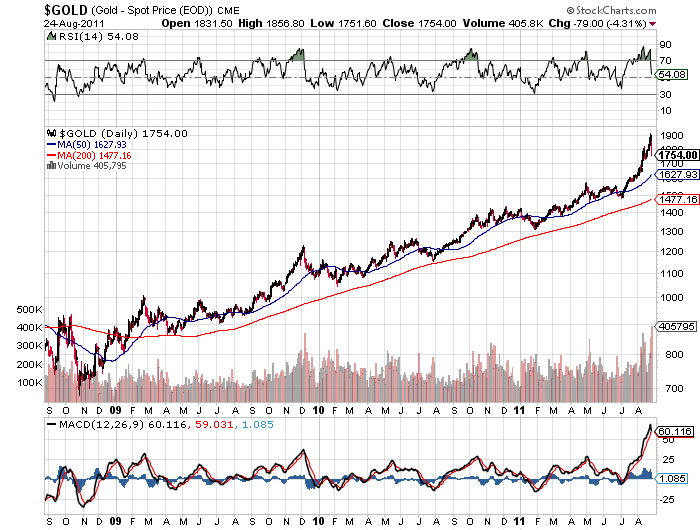
A view of a longer term chart gives a different perspective – the long term bull market in gold remains intact and the fundamental reasons for owning gold have not changed.


Gold - courtesy stockcharts.com

The non stop “gold bubble” chatter by talking heads who missed participating in the decades long gold rally are focusing on a short term price movement instead of the fundamentals that will continue to drive gold prices higher.  Every bull market has corrections and are an opportunity to add to positions.  As a long term investor in gold since the early 1990’s, I have seen other investors trade in and out, losing money each time, instead of simply going with the long term bull trend.

Many analysts have expressed concern that investors might be panicked out of the GLD causing the price of gold to plunge.  This does not seem to be the case despite the large drop in gold prices this week.  As of Wednesday, the GLD gold holdings declined by only 39.67 tonnes.  In addition, when silver spiked in early May, trading volume in the SLV exploded by 750% above the daily average trading volume.  Despite the volatility in gold this week, trading volume in the GLD expanded by only 350% above average trading volumes.  This would seem to indicate that investment in the GLD is a core holding by long term gold investors who are not inclined to sell on normal price corrections.

The SPDR Gold Trust currently holds 39.6 million ounces of gold valued at $70.1 billion.  There has been much hype about the value of the GLD exceeding that of the SPDR S&P 500.  A more proper context for comparison is to compare the value of the GLD to the increase in sovereign debt and money printing.  Bernanke’s latest episode of QE2 money printing was 850% larger than the entire value of the GLD and you can count on additional Fed currency debasement in the future.

GLD and SLV Holdings (metric tonnes)

August 24-2011 Weekly Change YTD Change
GLD 1,232.31 -39.67 -48.41
SLV 9,836.18 +109.08 -1,085.39

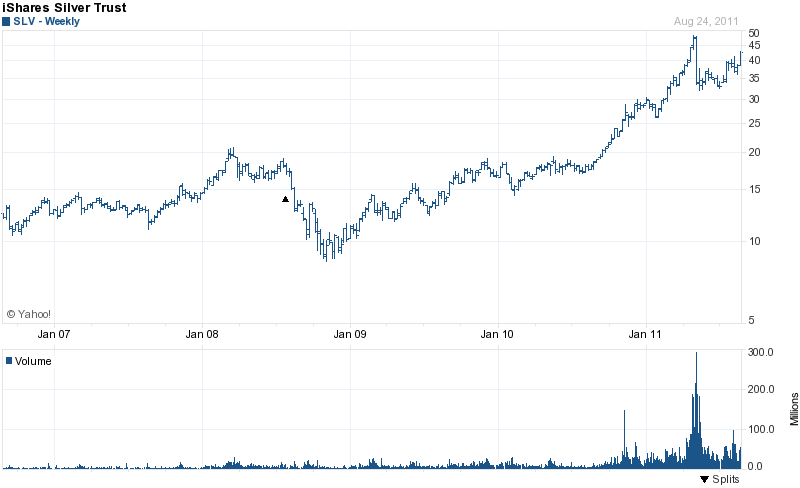
The iShares Silver Trust holdings gained 109.08 tonnes for the week ending August 24, despite the slide in silver prices.  The SLV has been building a base in the $35 to $40 range since the May correction.   Many analysts proclaimed that the “bubble” in silver prices had burst after the sharp price correction in May.  From a long term perspective, the May correction did little to diminish either the bullish fundamentals or the long term upward trend in silver prices.


SLV - COURTESY YAHOO FINANCE

The SLV currently holds 316.2 million ounces of silver valued at $13.3 billion.

Gold Prices Skyrocket, Stocks Plunge – Looking Like 2008 On Steroids

As politicians celebrated the debt limit increase and congratulated themselves for “saving” the nation that they destroyed, collapsing stock markets and soaring gold prices told a different story.  The public spectacle of a dysfunctional Congress debating the debt limit exposed to the world the horrendous extent to which the US government is addicted to endless deficit spending.

Republican presidential candidate Ron Paul summed up the outcome of the debt limit fiasco best:

This deal will reportedly cut spending by only slightly over $900 billion over 10 years. But we will have a $1.6 trillion deficit after this year alone, meaning those meager cuts will do nothing to solve our unsustainable spending problem. In fact, this bill will never balance the budget. Instead, it will add untold trillions of dollars to our deficit. This also assumes the cuts are real cuts and not the same old Washington smoke and mirrors game of spending less than originally projected so you can claim the difference as a ‘cut.’

The plan also calls for the formation of a deficit commission, which will accomplish nothing outside of providing Congress and the White House with another way to abdicate responsibility. In my many years of public service, there have been commissions on everything from Social Security to energy policy, yet not one solution has been produced out of these commissions.

Ron Paul also provided an explanation of what constitutes a “spending cut” in the bizarro world of government accounting and why, in the end, spending and debts will not decrease.

No plan under serious consideration cuts spending in the way you and I think about it. Instead, the “cuts” being discussed are illusory, and are not cuts from current amounts being spent, but cuts in projected spending increases. This is akin to a family “saving” $100,000 in expenses by deciding not to buy a Lamborghini, and instead getting a fully loaded Mercedes, when really their budget dictates that they need to stick with their perfectly serviceable Honda. But this is the type of math Washington uses to mask the incriminating truth about their unrepentant plundering of the American people.

The world was finally tuning in to the reality of the desperate financial condition of the United States.  The mainstream press was predicting a plunge in gold prices and soaring stock prices after Congress agreed to increase the nation’s debt limit.  Instead, the opposite happened as markets reflected underlying economic reality.

Since mid July, the Dow Jones Industrial Average has plunged by 858 points.  Since July 1st, gold has gained $178 per ounce.  Meanwhile, the debt crisis in Europe continues to intensify with bond yields soaring in Italy and Spain.  The world economy is marching off the edge of a cliff as governments lose the ability to contain the spiraling debt crisis.  It’s starting to look like a replay of 2008 on steroids.

Gold  soared by $39.80 on the day to close in New York trading at an all time high of $1,661.10.  Silver more than paced the gain in gold, adding $1.61 to close up 4.1% at $40.95.

SPDR Gold Trust Holdings Increase, Silver ETF Holdings Decline

Holdings of the SPDR Gold Shares Trust (GLD) gained almost 37 tonnes on the week.  For the first time this year, holdings of the GLD are greater than they were at the beginning of the year.  The record holdings of the GLD occurred on June 29, 2010 when the GLD held 1,320.47 tonnes of gold.

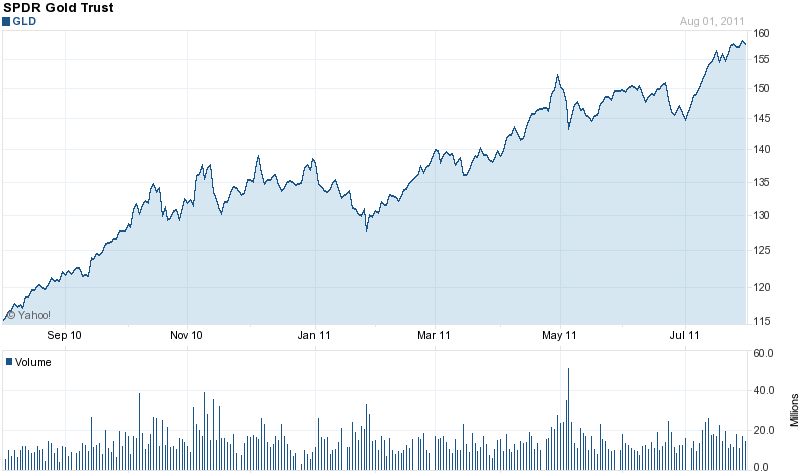
The SPDR Gold Trust currently hold 41.2 million ounces of gold valued at $67.5 billion.  Shares of the GLD hit an all time high, closing at $161.52.


GLD - COURTESY YAHOO FINANCE

Holdings of the iShares Silver Trust (SLV) declined by 90.93 tonnes after an increase of 112.15 tonnes in the prior week.  Since the beginning of July, holdings of the SLV have increased by 288.28 tonnes.

The SLV currently holds 315.9 million ounces of silver valued at $12.5 billion.

GLD and SLV Holdings (metric tonnes)

August 2-2011 Weekly Change YTD Change
GLD 1,281.75 +36.95 +1.04
SLV 9,824.93 -90.93 -1,096.64


Gold and Silver ETF Holdings Decline On Week While Europe’s Debt Crisis Expands

The iShares Silver Trust (SLV) showed a decline in holdings of 48.21 tonnes from the previous week, after rising by 21.23 tonnes in the previous week.   The net outflow of the SLV since the start of the year now totals 1,389.17 tonnes.

Silver opened the year at $30.67 per ounce and closed at $35.38 on July 6th. Despite the fact that silver has gained 15.4% since the start of the year, SLV holdings have declined by 12.7%.  Although increases or decreases in iShares silver holdings can be a guide to silver demand, physical holdings of the SLV do not correlate exactly with the price movements on the underlying metal.  This is due to the complex structure of the SLV which allows authorized participants to create or redeem shares in the SLV (see How Wall Street Made Profits On Silver ETF As Small Investors Sold).

There was, however, a close correlation between holdings of the SLV and the price of silver in late April.  As silver prices surged to a high of $48.70 on April 28th, holdings of the iShares Silver Trust hit an all time high of 11,390.06 tonnes on April 25th.

The iShares Silver Trust currently holds 306.5 million ounces of silver valued at $10.84 billion.  The all time high value of silver holdings by the SLV was reached on April 28th when the Trust held silver valued at $17.3 billion.

The SLV moved up on the week and is basing in the mid 30’s range.


SLV - COURTESY YAHOO FINANCE

Holdings of the SPDR Gold Shares Trust (GLD) declined slightly on the week by 2.42 tonnes after a small decline in the previous week of .91 tonnes.  The decline in GLD gold holdings since the beginning of the year totals 74.91 tonnes. The price of gold has increased 10% from $1388.50 at the beginning of the year to yesterday’s closing price of $1527.25.

The GLD currently holds 38.8 million ounces of gold valued at $59.2 billion.

Gold moved up $32.25 this week after dipping below $1,500 last week.  As measured by the closing London PM Fix Price, gold closed on Wednesday at $1527.25.  Gold has refused to give up its gains this year as distrust of paper money continues to justifiably expand.  The inevitable default by multiple member states of the European Union will require massive monetary support for insolvent banks holding trillions of dollars of sovereign junk debt.   The European Central Bank is desperately trying to maintain the facade of a successful debt restructuring by issuing more loans to insolvent nations.

Bloomberg this week discusses the looming debt crisis in Italy which has over 2 trillion in Euro denominated debt.

Italy, though, has close to 2 trillion euros in debt outstanding. It’s inconceivable that Germany or the IMF could provide a rescue to protect its creditors. Such a package would have to involve loans and guarantees of at least 500 billion, and possibly 1 trillion, euros to impress the markets. This would be a significant fraction of Germany’s gross domestic product of about 2.5 trillion euros. With a debt-to-GDP ratio of about 80 percent, Germany’s ability to take on new debt is limited.

The Netherlands, Finland and Austria, combined with Germany, have a GDP of about 3.5 trillion euros. France adds 2 trillion more, but its debt, already 85 percent of output, is expected to grow over the next several years.

It all adds up to one sobering fact: Europe does not have enough fiscal firepower to handle an Italian crisis — at least in such a way as to protect creditors completely. Beyond the difficult numbers, why would Germany or other EU countries lend to Italy, particularly when its politicians show no sign of coming to grips with their new reality?

The slow motion collapse of overly indebted countries in Europe is picking up speed.  Rising gold prices reflect the coming financial crisis which equity and debt markets have not yet fully discounted.  Expect to see gold prices soar as the debt crisis moves into high gear.


GOLD - COURTESY KITCO.COM

GLD and SLV Holdings (metric tonnes)

July 6-2011 Weekly Change YTD Change
GLD 1,205.81 -2.42 -74.91
SLV 9,532.40 -48.21 -1,389.17


Silver ETF Holdings Decline Again As Gold ETF Holdings Gain

Holdings of the iShares Silver Trust (SLV) declined again this week by 106.14 tonnes after a decline of 248.69 tonnes in the previous week.  The year to date decline in silver holdings by the SLV now totals 1,362.19 tons.

The decline in holdings of the SLV from its all time high of 11,390.06 tonnes on April 25, 2011 now totals 1,830.68 tonnes, or a decline of 16.1%.  There is not a direct and timely correlation between the price of silver and the holdings of the SLV as evidenced by the fact that silver has declined in price by a much larger percentage than holdings in the iShares Silver Trust.  From its high of $48.70 on April 28th, silver has had a price correction of 35.6%.

The holdings of silver by the SLV are structured in a complex manner.  The trust is set up so that the SLV price correlates closely to the price of silver.  This is accomplished by allowing Authorized Participants to arbitrage against a premium or discount of the SLV to the trust’s underlying net asset value  (see How Wall Street Made Huge Profits On Silver ETF Crash As Small Investors Sold).

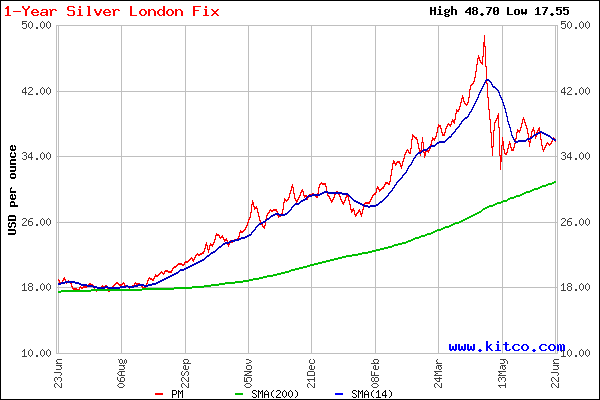
As measured by the closing London PM Fix Price, silver closed today at $35.91, up slightly from last Wednesday’s close of $35.26.  Silver has been consolidating in the mid 30 range after the early May sell off.

As of June 22, 2011, the SLV held 307.3 million ounces of silver valued at $11.0 billion.


SILVER - COURTESY KITCO.COM

Silver seems to be building a base in the mid $30’s and presents a buying opportunity for long term investors.

GLD and SLV Holdings (metric tonnes)

June 22-2011 Weekly Change YTD Change
GLD 1,209.14 +9.09 -71.58
SLV 9,559.38 -106.14 -1,362.19

Holdings of the SPDR Gold Shares Trust (GLD) gained by 9.09 tonnes on the week after a decline of 11.52 tonnes in the previous week.   The GLD currently holds 38.88 million ounces of gold valued at $60.3 billion.

As measured by the closing London PM Fix Price, gold closed on Wednesday at $1,552.50, a new closing high on the year.  The price of gold remains in a solid uptrend supported by huge physical demand from investors and central banks.


GOLD - COURTESY KITCO.COM


Silver and Gold ETF Holdings Both Decline On Week

Holdings of the iShares Silver Trust (SLV) declined by 248.69 tonnes for the week after declining by 27.12 tonnes in the previous week.  The year to date decline of silver held by the SLV is 1,256.05 tonnes.

The holdings of the SLV hit an all time high on April 25, 2011 at 11,390.06 tonnes and the decline from this high now totals  a substantial 1,724.54 tonnes.  Total holdings of the SLV have declined by 15.1% from the high of April 25, while the price of silver has declined by 27.6%  from its high of $48.70 reached on April 28th.

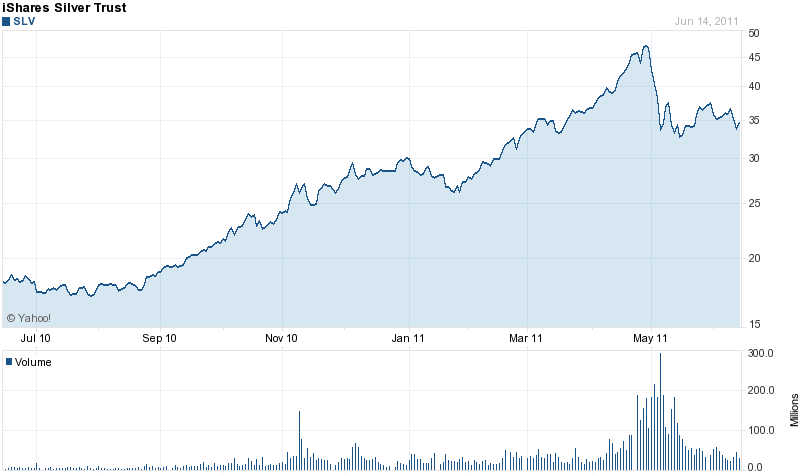
Silver closed today at $35.26 (as measured by the closing London PM Fix price), up $8.58 from the low of the year at $26.68 reached on January 28th.  Shares of the SLV closed today at $34.88, down $13.47 from the high of the year at $48.35.


SLV - COURTESY YAHOO FINANCE

The iShares Silver Trust currently holds 310.8 million ounces of silver valued at $10.95 billion.  At the start of 2011, the SLV held 351.1 million ounces of silver valued at $10.9 billion.  The holdings of the iShares Silver Trust does not directly track the price movement in silver due to the manner in which it is structured.  For a discussion of how SLV shares are created or redeemed by Authorized Participants, see How Wall Street Made Profits On Silver ETF Crash.

According to the iShares website, the SLV closed yesterday at a premium of 2.54% to the fund’s net asset value.  On rare occasions when silver is exhibiting large price swings, the premium or discount to net asset value has been as large as 6%.

GLD and SLV Holdings (metric tonnes)

June 15-2011 Weekly Change YTD Change
GLD 1,200.05 -11.52 -80.67
SLV 9,665.52 -248.69 -1,256.05

Holdings of the SPDR Gold Shares Trust (GLD) declined on the week by 11.52 tonnes, after declining in the previous week by 1.30 tonnes.  The GLD currently holds 38.58 million ounces of gold valued at $59.0 billion.  The all time record holdings of the GLD was 1,320.47 tonnes on June 29, 2010.

Gold traded in a narrow range over the past week, declining by $8 per ounce.  Gold has stayed above the $1,500 level since May 20th and has gained $141.25 since the beginning of the year.

Shares of the SPDR Gold Trust closed at $149.12, up $0.45, not far off the year’s high of $153.61.


GLD - COURTESY YAHOO FINANCE

Why Gold Stocks Are A Better Value Than Physical Gold Or Gold ETFs

Many investors in gold mining companies are probably asking “where did I go wrong”?   While the price of gold bullion has moved relentlessly higher,  many large cap gold stocks have seen little or no price appreciation in recent years.

In a previous post, we examined the poor returns of two major gold stock mutual funds compared to the return on owning physical gold.  While the price of gold has soared 80% over the past three years, the three year return on the Vanguard Precious Metals Fund (VGPMX) was -.46% and the three year return on the Fidelity Select Gold Portfolio (FSAGX) was only 16.2%.

Why gold stocks have so badly lagged the run up in the price of gold remains subject to conjecture.  Some analysts speculate that investors prefer to avoid the risks associated with gold mining stocks and as a result have turned to physical gold and gold ETFs.  Since their introduction in 2004, gold ETFs have become very popular with investors, and now hold a total of almost $98 billion in assets.  By way of comparison, the market value of three of the largest gold mining companies, Barrick Gold (ABX), Gold Corp (GG) and Newmont Mining (NEM) total $108 billion.

If the gold ETFs did not exist, it is likely that some of the funds that flowed to gold ETFs would have instead flowed into gold mining companies.  However, the historical correlation between gold bullion and gold mining stocks has not always been perfectly linked.  There have been times when gold stocks outperformed or simply matched the price gains of gold bullion.

The recent under performance of gold stocks relative to gold bullion will probably not continue.  Many large cap gold mining companies are positioned to see significant increases in earnings that will eventually propel their stock prices higher.  Going forward, it is likely that gold investors will see higher returns on quality gold mining stocks than on holdings of physical gold or gold ETFs.

Two high quality gold mining companies previously featured in the GoldandSilverBlog that should see significant price gains are Newmont Gold (NEM) and Kinross Gold (KGC).

Newmont Gold is one of the world’s largest gold producers.  The Company has been increasing profits and production for several years and is forecasting an increase in gold production of 35% over the next six years.  Newmont has gold and copper reserves valued at $363 per share and pays a cash dividend of $0.50 per share which will be increased by $0.20 for every $100 increase in the price of gold.  Newmont shares closed on Friday at $52.10.

Kinross Gold had very strong first quarter results with revenue up 42% and earnings up 81%.  The Company’s cost of production is $543 per ounce and Kinross is forecasting an increase in gold production of 77% by 2015.  At the current price of $15.50 per share, an investor is effectively buying gold at around $250 per ounce.  Kinross Gold pays a dividend of $.10 per share.

The current pricing disparity between quality gold mining stocks and gold bullion has presented investors with an opportunity to purchase gold shares at deeply discounted prices.

Besides being able to effectively buy gold at a steep discount, gold mining companies pay dividends which are likely to increase substantially.   Another significant benefit of owning gold mining companies is the much more favorable tax treatment on gains.  Gold bullion and gold ETFs are taxed as collectibles at 28%, while the long term capital gains tax rate on gold stocks is only 15%.

Gold and Silver ETF Holdings Decline On Week

Silver holdings of the iShares Silver Trust (SLV) declined for the week by 27.12 tonnes after being unchanged in the previous week.  The price of silver, as measured by the closing London PM Fix Price has declined by $1.73 or 4.6% since June 1st.

After reaching a high of $48.70 per ounce on April 28th, silver has declined by $12.48 or 25.6% based on today’s closing price.  From the low of $32.50 on May 12, silver has seen a price recovery of $3.72.

The iShares Silver Trust has seen a substantial reduction in silver holdings of 1,007.36 tonnes since the beginning of the year when silver traded at $30.67.  The decline in holdings by the SLV from late April have been even more dramatic.   The SLV hit an all time high for silver holdings on April 25, 2011 of 11,390.06 tonnes.  The decline in SLV holdings from the all time high registers at 1,448.73 tonnes or 46.6 million ounces of silver valued at $1.7 billion.

The iShares Silver Trust currently holds 318.7 million ounces of silver valued at $11.5 billion.  On April 27th, the value of silver held by the SLV was $16.1 billion.

At today’s closing price of $36.03, shares of the SLV traded at a premium of $0.71 or 2.0% to the net asset value of the Trust.  Since the beginning of the year, the SLV has gained 20.2% and over the past year has increased by 115.4%.  For a discussion on why silver prices may see a quick recovery to all time highs see – How Soon Will Silver Hit New Highs?

GLD and SLV Holdings (metric tonnes)

June 8-2011 Weekly Change YTD Change
GLD 1,211.57 -1.30 -69.15
SLV 9,914.21 -27.12 -1,007.36

Holdings of the SPDR Gold Shares Trust (GLD) were little changed on the week, declining by 1.3 tonnes, after a decline of 1.21 tonnes in the previous week.  The GLD currently holds 38.95 million ounces of gold valued at $59.9 billion.  Holdings of the GLD hit at all time record high of 1,320.47 tonnes on June 29, 2010.

Gold prices gained slightly on the week, closing up $4.00 per ounce from the June 1 close.  Gold has now gained $149.25 since the beginning of the year, up 10.75%.  Gold has remained in a narrow trading range for several months, consolidating its early year gains.  Gold has remained above the $1,500 level since May 20th when it closed at $1490.75 per ounce.