April 19, 2024

ProShares Ultrashort Silver (ZSL) – Double Inverse Silver ETF

Many of us have been accumulating large positions in silver bullion and silver mining shares. Whether these positions have been held for decades or only for the past year, the recent explosive move up in the silver price has caused some to wonder if there is a way to protect gains from a possible pull back in silver prices.

The bull market in silver has a long ways to go considering the perilous state of sovereign finances, surging commodity prices, and the risk of political and military turmoil in Saudi Arabia. Nonetheless, it is normal for every bull market to experience sharp price sell offs, such as the almost $300 per ounce drop in gold prices during 2008. An experienced investor with a long term view and fundamental understanding of the long term appeal of gold would have used this occasion to increase gold positions in a portfolio.

For investors who may be short term bearish and do not wish to see their portfolio take a steep dive, hedging against a significant short term sell off may make sense and increase overall portfolio returns.

Investors in silver sitting on a 400% gain since October 2008 and wishing to protect profits may consider the purchase of an offsetting position in the ProShares UltraShort Silver (ZSL) to protect profits. Investments in commodities or precious metals can exhibit very volatile price movements. In 2008, the price of silver dropped by 50% in four months, possibly prompting some investors to sell their positions and miss out on the explosive upward move that followed. Hedging volatility to protect large gains without reducing core silver holdings is possible for the average investor by purchasing the ZSL.

The Ultrashort Silver (ZSL) is an inverse ETF that seeks to produce twice (200%) the opposite investment result of the daily price movement in silver. An inverse ETF for silver is therefore a means of profiting from a downward move in silver as measured by the U.S. London fix price. In theory, a 10% drop in the price of silver would result in a 20% gain in the price of the ZSL.

The ZSL trades on the New York Stock Exchange and was launched by ProShares which offers the largest selection of leveraged and inverse ETFs. ProShares is part of the ProFunds Group which has $31 billion in ETF and mutual fund assets.

The ZSL does physically hold any position in silver bullion. In order to achieve a 200% inverse investment result of the price change in silver, the ZSL positions itself daily through the use of financial instruments whose value is based on the underlying silver price. The complex financial instruments used to achieve the ZSL’s investment objectives include swap agreements, forward contracts, futures contracts and option contracts.

ProShares states that the ZSL seeks achievement of the targeted returns for only a single day since investment returns beyond a day can be higher or lower than the 200% inverse investment return objective. According to ProShares, the four factors affecting the divergence between daily and long term investment results are the holding periods, index volatility, leverage and inverse multiples. An investment in the ZSL should be monitored daily since the return for longer periods of time can vary significantly from short term results.

For the investor who understands the risks associated with a double inverse ETF, the ZSL can be a valuable tool to manage the risk of a large investment in silver. The four most common uses of the ZSL (according to ProShares) is to help hedge a silver portfolio, obtain greater profits (or loss) through leverage, commit less cash investment for a specific level of silver exposure, and to reduce exposure to a silver position without a reduction of portfolio holdings.

Ironically, the ZSL was launched near the bottom of the silver market in late 2008 and the investment results have been catastrophic for a buy and hold investor in ZSL. The split adjusted price of ZSL has dropped from $1100 to the mid $20’s as the price of silver soared.  Leverage works on both the upside and downside to magnify investment results and in this regard the ZSL was successful. During 2010, the ZSL had a 77% loss and has declined even further during 2011.

Whether or not the ZSL will be a profitable investment in the future is unknown but it is one investment strategy that can be used to hedge a potential drop in silver prices.

Demand For Silver Jewelry Soars As Silver Hits New Highs

Demand for silver jewelry hit new records in 2010 according to The Silver Institute. A survey of 340 retail jewelers conducted in February by Nielsen/National Jeweler shows that 87% of retail jewelers experienced sales increases. The retail jewelers surveyed operate 4,000 stores.
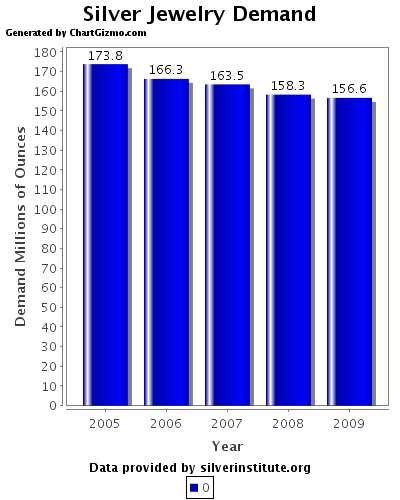
The survey reveals that of the jewelers reporting sales increases, 52% saw sales increases of between 11% and 25%. Sales increased by more than 25% at 28% of the jewelers surveyed.

Sales of gold and platinum jewelry saw increases in sales of 4%, far below the sales increase in silver jewelry. As the price of both gold and silver continue to surge, many smaller investors naturally gravitate to less expensive silver.

The fact that silver jewelry sales increased substantially despite the huge jump in silver prices last year indicates that the general public is recognizing the need to diversify their wealth into an asset that has held its value over the millenniums.  Paper currencies have come and gone over the centuries, leaving paper wealth holders impoverished while gold and silver have always been a store of permanent value.

As the economy hit the wall during 2008 and 2009, silver jewelry sales declined from previous record levels to under 160 million ounces.  A ten year high in silver jewelry demand was reached during 2003 at 179.2 million ounces.  The four other years of the past decade during which silver jewelry sales exceeded 170 million ounces were 2000, 2001, 2004 and 2005.

The silver institute has not yet released their World Silver Supply and Demand statistics for 2010, but based on the survey cited, it appears that silver jewelry demand for 2010 may have exceeded the previous demand record of 179.2 million ounces during 2003.  Assuming that total silver jewelry demand increased by 15% over 2009, total 2010 demand could have exceeded 180 million ounces – a very bullish indicator as silver continues to increase in price.

Historical Gold Silver Ratio Predicts $100 Silver Price

The gold silver ratio chart below shows the dramatic fashion in which silver has been outperforming gold since last August.  The gold silver ratio is calculated by dividing the price of gold by the price of silver.  A declining gold silver ratio indicates that silver has been outperforming gold.   The gold silver ratio has declined from 65 last summer to a current level of 41.
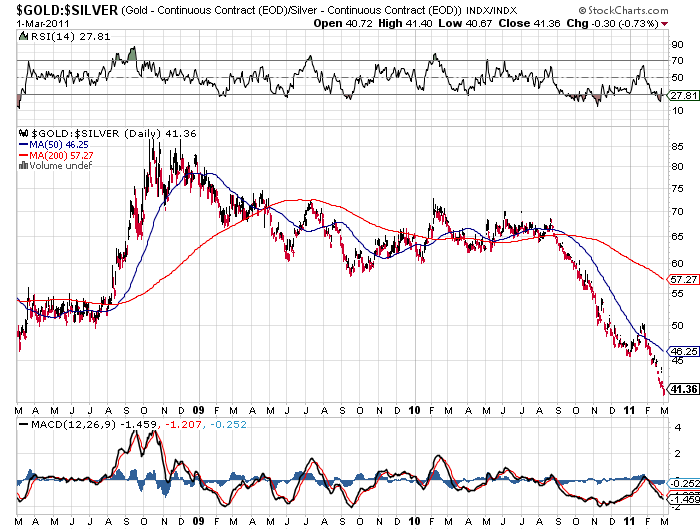
Since August 2010 gold has moved up 22% from the $1,175 level while silver has soared 92% from the $18 range.  Does the declining gold silver ratio indicate that silver prices are due for a correction or is this a fundamental change in the price relationship?

The gold silver ratio has averaged around 60 since the mid 1970’s.  In January 1980, as silver hit its peak price of $48.70, the gold silver ratio briefly hit 16, but rapidly rose as the Hunt brother’s attempt to corner the silver market came undone and silver prices collapsed.

Gold Silver Ratio - Courtesy Stockcharts.com

Will the current decline in the gold silver ratio continue?  From a very long term historical perspective, a gold silver ratio in the 16 range has been the norm.  Since ancient times, it has typically taken 16 ounces of silver to purchase one ounce of gold.  Interestingly, the earth’s  reserves of silver exceeds that of gold by roughly 16 times.  If this ultra long term relationship were to reassert itself, silver would sell for approximately $90 per ounce based on the current price of gold.  With gold at $2,500 per ounce, silver would have a value of $156 per ounce at the historical gold silver ratio of 16.

The fundamental reason that may drive the gold silver ratio back to the 16 range is growing demand by small investors.  Silver, known as the poor man’s gold has seen a huge surge of public demand, as evidenced by record sales of the Silver Eagles.

Increasing public recognition of the need to preserve wealth against paper currencies will continue to propel silver to historic highs.  Simply put, silver is more affordable to the average buyer who cannot afford the higher priced Gold Eagles.  Silver has a lot of catching up to do and we are probably in the early stages of a fundamental reversion to a lower gold silver ratio which will send silver prices soaring past $100 per ounce.

Silver ETF Holdings Soar as Gold ETF Holdings Decline

The SPDR Gold Shares Trust (GLD) holdings declined slightly on the week, while the iShares Silver Trust (SLV) increased its holdings by a substantial 164 metric tonnes

Holdings in the GLD declined by 5.77 tonnes compared to a decline of 2.43 tonnes in the previous week.  Total holdings have declined by 4.9% or 62.48 tonnes since the start of the year.  The GLD currently holds 1,218.24 tonnes or 39.17 million ounces of gold valued at $55.2 billion.

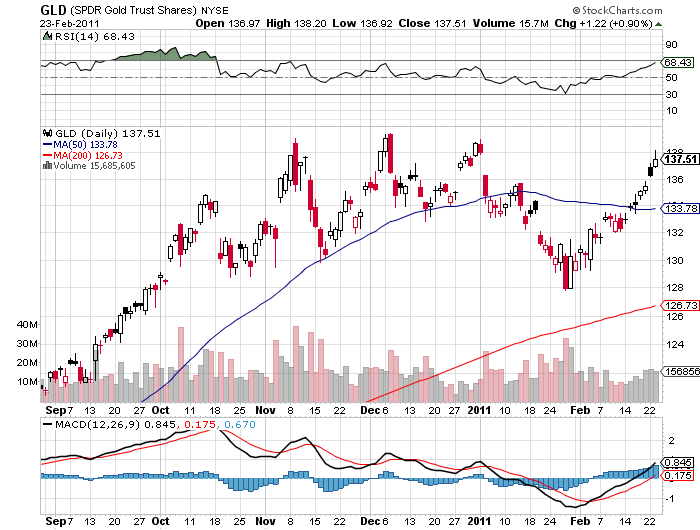
The price of the GLD has traded between $128 and $139 since last October after running up from approximately $110 from the start of 2010.   The GLD was originally launched in November 2004 when the price of gold was trading at $445 per ounce.

GLD - COURTESY STOCKCHARTS.COM

GLD and SLV Holdings (metric tonnes)

23-Feb-11 Weekly Change YTD Change
GLD 1,218.24 -5.77 -62.48
SLV 10,575.23 +164.00 -346.34

Silver holdings in the iShares Silver Trust (SLV) increased by 164 tonnes over the past week compared to an increase in the previous week of 41.01 tonnes.  The year to date decline of 346.34 tonnes represents a 3.2% drop in silver holdings since the beginning of the year.

The Trust is structured so that the value of the iShares will reflect the price of silver owned by the trust.  The price of an iShare should closely track the price of one ounce of silver, less the Trust’s expenses.  However, the price of the SLV will fluctuate during the day as traders buy and sell shares.  If there are many buyers purchasing SLV, the price can rise to a premium over the underlying value of silver as seen in the chart below comparing silver to the SLV.

The amount of silver held by the SLV will vary due to the mechanism by which shares are created or redeemed by the Trust via Authorized Participants.   Authorized Participants are typically large Wall Street Investment firms that will either deliver or take silver from the SLV as they arbitrage to take advantage of premiums or discounts of physical silver to the value of the SLV.  The GLD operates similarly to the SLV which is why an increase in the price of gold and the price of the GLD may not necessarily result in greater gold holdings by the GLD.

SILVER/SLV - COURTESY STOCKCHARTS.COM

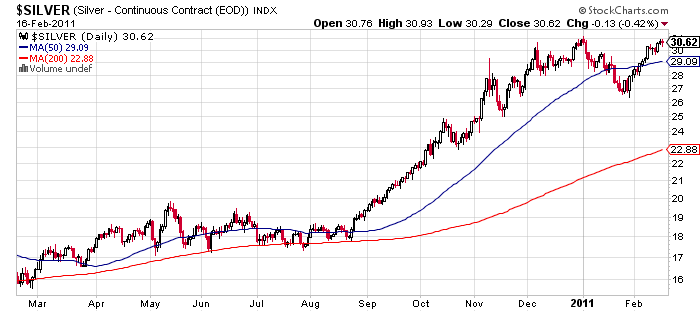
The SLV’s closing price of $32.71 on February 23th is 9.2% above last weeks closing price on February 16th and reflects silvers large price increase over the past week as prices broke out to new highs.  Since 2010, the price of silver has more than doubled from the $16 range to the current price of $33.70.

Silver Breaks Out of Triple Top for New Bull Move – Is Gold Next?

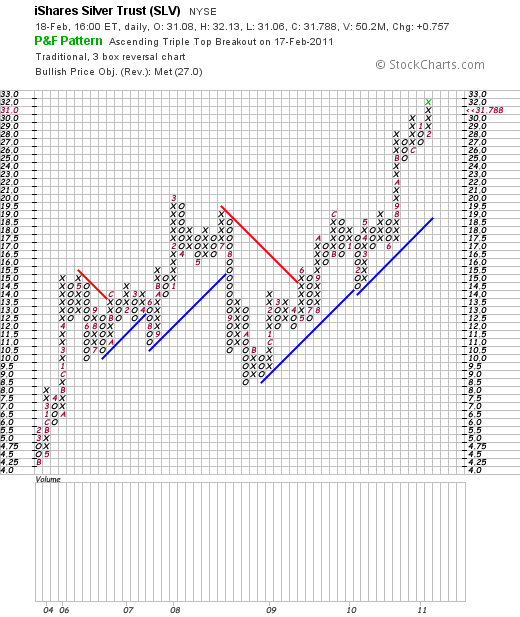
Triple tops are a well known chart formation that signal the potential for a price trend reversal.  A classic triple top occurs over a period of three to six months during which prices decline after hitting a series of multiple equal highs.  For the reversal pattern to register a definitive sell signal, the price must break below support levels.
A triple top has certain characteristics, each of which must be analyzed.

  • The three highs must be within reasonable price points of each other and spaced over equal time periods.
  • A previous long term uptrend must have occurred which established a definitive uptrend.
  • Volume levels tend to decrease during the formation of a triple top.  If volume increases on a pullback from the third top, more significance must be given to the potential for a significant trend reversal.
  • A triple top is not completed unless the price level breaks a key support level which would be the lowest price point on previous pullbacks from the intermittent tops.
  • A triple top chart pattern is not considered bearish unless support levels are decisively broken

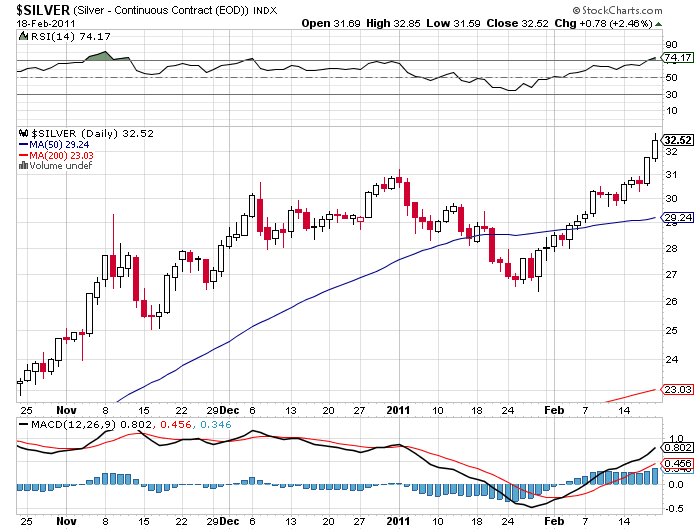
Examining the chart for silver before the recent move up, we could see a pattern developing with characteristics of a triple top.  The critical support level for silver was at  the $27  level.  Silver’s inability to break resistance at the $30 level would have been at best a neutral signal and a break below $27 would have forecast further price declines.   The strong upward price movement in silver last week as it soared past the $30 area is extremely bullish and tells us that the bull market in silver is intact.

Silver - courtesy stockcharts.com

TRIPLE TOP BREAKOUT - COURTESY STOCKCHARTS.COM

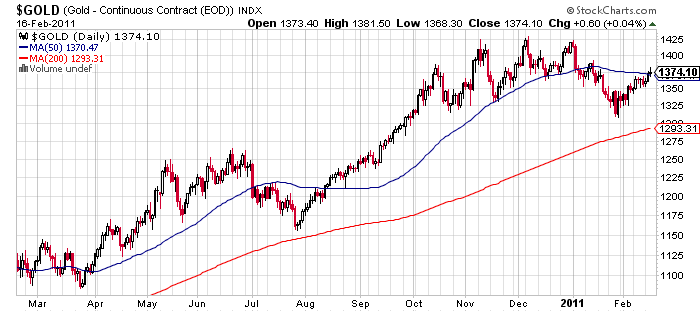
Viewing the chart of gold, we can see that the same potential for a triple top exists.

Gold - courtesy stockcharts.com

Gold has been turned back three times at the $1425 level, the tops are equally spaced over a period of almost 4 months and gold has been in an established uptrend for an extended period of time.  In the case of gold, a drop below support at $1320 would be a bearish signal and reason to take a defensive posture.

Considering the strong fundamentals supporting gold, we may soon see a breakout in the price of gold similar to what we have just witnessed with silver.

Silver Soars to 30 Year High as Precious Metals Resume Upwards Trends

After a brief consolidation below the 50 day moving average in late January, silver resumed its uptrend with a vengeance.  The London PM fix price for silver closed at $31.94 up from $30.00 the previous week.  Since late January, silver has rocketed $5.50  for over a 20% gain.

Silver - courtesy stockcharts.com

The fruitless budget reduction talks in Washington, a slide in the US Dollar Index and a new high on silver are certain to ignite the precious metal markets into another major move upwards.  Most investors under the age of 50 probably don’t remember the last time silver prices have soared past $30 in the early 1980’s.

Technically and fundamentally, silver is poised to make a major move.  Price movements coming out of long bases usually have a long duration.   Silver has broken out from an ultra long base of over 25 years.  The initial move from the $5 area to $30 is simply the first phase of what should turn out to be a major upward move.

Long term silver

Silver hit an all time high of $48.70 in January 1980.  The inflation adjusted historical high for silver is $130 per ounce.  Considering the horrendous manner in which sovereign states are conducting their financial affairs and the potential for another financial crisis, the inflation adjusted high of $130 will look like a bargain price at some future date.

The closing London Fix Prices showed gains across the board from the previous week.  Silver was the standout performer with a gain of 6.5%.

Precious Metals Prices
Fri PM Fix Since Last Recap
Gold $1,383.50 +19.50 (+1.43%)
Silver $31.94 +1.94 (+6.46%)
Platinum $1,836.00 +7.00 (+0.38%)
Palladium $847.00 +25.00 (+3.04%

GLD and SLV Holdings Decline as Investors Ponder Next Move in Gold and Silver

Both the SPDR Gold Share Trust (GLD) and the iShares Silver Trust (SLV) registered minor declines over the past week.

Holdings in the GLD declined by 2.43 tonnes compared to a decline of 21.85 tonnes in the previous week.  Since the start of the year, total holdings have declined by 4.2% or 53.57 tonnes.  The GLD currently holds 39.5 million ounces of gold.

The holdings of the GLD currently have a market value of $52.7 billion, making the GDL a very significant presence in the gold market.   The market cap of the GLD  far exceeds that of major gold producers such as Goldcorp (GG) at $30 billion, Newmont Mining (NEM) at $27.4 billion and Randgold (GOLD) at $7.1 billion.

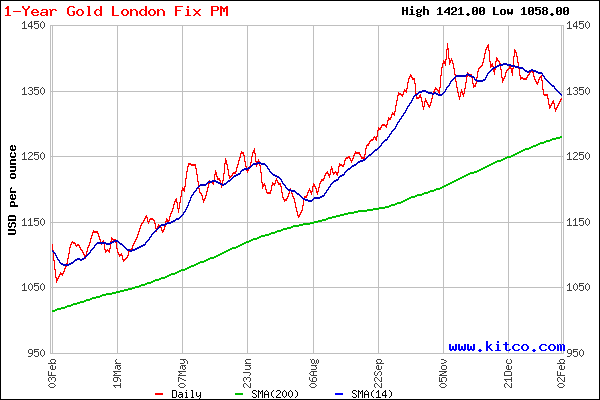
Gold has now made three failed attempts to decisively pierce the $1400 level since last November, forming a triple top in the process.  The failure to breakout to new highs and the large price gain of $250 per ounce since last July has motivated some nervous selling by gold investors.  A look at the one year chart shows that gold’s short term momentum has faltered as prices breached the 14 day moving average.  The next important test will be at the 200 day moving average which gold has traded above for the past two years.

1 YEAR GOLD PRICE - COURTESY KITCO.COM

Despite the recent minor setback in gold prices, the long term trend of gold remains intact technically and fundamentally.

GLD and SLV Holdings (metric tonnes)

2-Feb-2011

Weekly Change

YTD Change

GLD

1,227.15

-2.43

-53.57

SLV

10,400.60

-47.10

-520.97

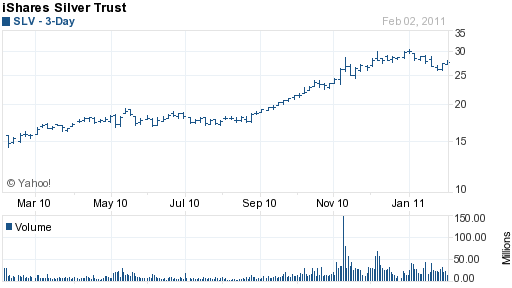
Silver holdings in the iShares Silver Trust (SLV) declined by 47.1 tonnes over the past week compared to a decline in the previous week of 127.6 tonnes.  The year to date decline of 520.97 tonnes represents a 4.7% drop in silver holdings which trails the 7.8% year to date decline in the price of silver.  The SLV has declined by 9% from its high of $30.40 at the beginning of the year.  After a huge gain of 67% in the price of silver since late last year, it is normal to see price consolidation before another advance.

In this writer’s opinion we have not seen a parabolic blow off type price move, nor have we seen the excited entry of first time silver buyers lured by stories of rising prices.  One of the sentiment gauges that I use involve noting how many of my friends and clients ask or offer unsolicited advice on a specific investment category.  Thus far, not even one person has mentioned silver.  Despite the huge advance in silver prices, public awareness seems minimal, implying long term bullishness.

SLV - courtesy yahoo finance

Gold and Silver ETF Holdings Decline As Precious Metals Continue Sideways Price Action

After major upward price movement during the later half of 2010, both the SLV and GLD continue their sideway price action.

As gold and silver prices continue to consolidate, gold holdings in the SPDR Gold Shares Trust (GLD) and silver holdings in the iShares Silver Trust (SLV)  both declined.

The iShares Silver Trust, the largest exchange traded fund back by silver, has a market value of $10.2 billion.  After a one year return of almost 80%, the SLV showed a weekly decline of 191.46 metric tonnes from the previous week.  The SLV now holds a total of 10,725.73 metric tonnes of silver or 344.840 million ounces.

The holdings in the GLD declined by 1.21 metric tonnes in the past week to 1,271.47.  The record high holdings of 1,320.47 tonnes in the GLD was reached last year on June 29 when gold bullion was trading in the $1250 range.

Despite the lack of correlation between gold prices and gold holdings of the GLD, investing in the GLD has produced approximately similar returns to owning bullion, disregarding transaction costs.  The price gain during 2010 was approximately 28% for both gold bullion and the GLD.   For those who choose to avoid holding the physical metal, the GLD was an excellent substitute choice for gold bullion in 2010.

GLD and SLV Holdings (metric tons)

Jan 12, 2011 Weekly Change YTD Change
GLD 1,271.47 -1.21 -9.25
SLV 10,725.73 -191.46 -195.84

GOLD - COURTESY STOCKCHARTS.COM

GLD - COURTESY STOCKCHARTS.COM

Gold and Silver Recap: Back to Work

Another Precious Week

So the holiday season, with decent job creation statistics, has seen some uncustomary cheer for the dollar, and on the face of it this seems to be the main driver for the weakness of gold and silver prices.  After all if you’re priced in dollars, and the dollar goes up then your price goes down.  The last week has been particularly bad for gold, with a 3.5% fall (the figures below cover the whole of the holiday period) which is the largest week on week fall for six months.

The long term trend still looks like it’s going to be up, as the Central Banks are starting to buy gold, apart from the Fed – although if Ron Paul gets his way then Uncle Sam may stop being a hold out as well.

Precious Metals Prices
Fri PM Fix Since Last Recap
Gold $1,367.00 -1.50 (-0.11%)
Silver $28.39 -0.39 (-1.36%)
Platinum $1,735.00 +39.00 (+2.30%)
Palladium $754.00 +16.00 (+2.17%)

Gold-Silver Ratio: 48.15 (was 47.55)

So far the Central Banks that are buying gold are the scary ones; Russia, China and Venezuela.  But one of the more interesting things is that they are doing this in secret.  If it was an attempt to finish off the dollar then this would be in the open.  No, they are seeing gold as an integral, and underweight part of the reserves that are going to underpin their currencies in the future.  In other words an unofficial, secretive return to the gold standard.  This sort of thing is not a long run dampener on the gold price.

Silver also did badly, which was shown in a rather big slip in the gold silver ratio.  If the idea is that silver is priced around a third of its long term price when compared to gold, well it shouldn’t be going in this direction.  Now I don’t fully buy the idea that silver has got to come to around fifteen ounces to an ounce of gold, or at least any time soon.  But it hard to deny that it is out of balance.

What is even odder is that platinum and palladium have seen a large rise over the holiday period.  While gold can have a life of its own, and it’s true that palladium can have more to do with what the Russian ministry of mines is up to, silver and platinum are quite similar.  While platinum and palladium have seemed to be riding the same industrial metal climb as copper, silver seems to have decoupled with the feeling that perhaps we’ve overestimated the inflationary potential for the dollar with the classic inflation hedge of silver taking the hit.

Gold and Silver: Investment Differences

Gold just had an amazing year, in which it reached a new all time high, rising about 25%. Silver provided an even more stellar performance, with a gain of about 75% and counting. It’s no wonder then, that more and more investors are becoming interested in the potential offered by silver.

One of the most pronounced differences between gold and silver is the price per ounce. Gold is currently around $1,400 per ounce, while silver is at $30. The difference has not always been so large.

The gold-silver ratio, or the number of ounces of silver it takes to buy one ounce of gold, is currently around 47:1. Historically, this ratio has been around 16:1, which closely corresponds to the ratio of gold to silver within the earth’s crust. Thus on an absolute basis, the difference in price is justified, but not to such a degree as current prices have suggest.

Another key difference between gold and silver is the price volatility. While gold has enjoyed a string of ten straight years of annual gains, silver’s price performance has not been as constant. Some years have been downright disastrous, such as the 27% drop silver experienced during 2008. From the start of the year to the low, silver had experienced a decline of nearly 40%. During 2008, gold had booked a 4.32% gain, with a maximum decline of 14.54% from the start of the year.

Finally, while gold and silver are both metals that store value, silver has been long served as an industrial metal. The recent case for gold demand has been as a hedge against inflation or a safe harbor from fiat currencies. Demand from these factors has offset declines in demand from gold jewelry, which has historically been the predominant source of demand. Silver, on the other hand, can serve in a dual capacity, with possible appreciation in value in times of both economic distress and prosperity.

Silver’s roles may be expanding once again, as it is starting to be utilized for its antibacterial qualities.

With an impressive year nearly in the books, the story for silver seems hardly over. Next year might be telling as to whether silver will continue to make progress in catching up with the historic ratios and start to challenge the label of “poor man’s gold.”