April 26, 2024

US Mint Gold and Silver Bullion Sales July 2009

During the month of July, sales of physical bullion at the United States Mint were somewhat split. In the case of silver, sales as measured by the number of ounces sold reached the second highest level of the year. In the case of gold, sales as measured in ounces marked the second lowest total for the year.

The table below displays the number of ounces of gold bullion sold by the United States Mint during the month of July. As the case has been all year, sales were limited to one ounce American Gold Eagles and one ounce American Silver Eagles. Platinum bullion and fractional gold bullion coins were not offered.

July 2009 US Mint Bullion Sales
1 oz. 1/2 oz. 1/4 oz. 1/10 oz. Total oz. YTD Total oz.
Gold Eagle 86,000 86,000 756,500
Silver Eagle 2,810,000 2,810,000 16,634,500
Platinum Eagle

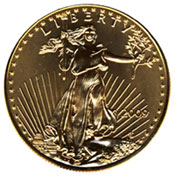
Sales of the Gold Eagle reached 86,000 ounces. As mentioned, this represented the second lowest monthly sales total this year. The low of 65,000 took place in May. It should be noted that the level of sales still remains above the monthly total reach one year ago in July 2008 when 50,000 ounces were sold. Although the furious pace of gold sales has slowed, it remains historically high.

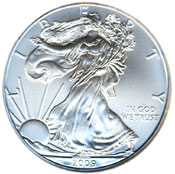
Sales of 2009 Silver Eagle bullion coins reached 2,810,000, marking the second highest monthly total of the year. The highest level was reached in March when 3,132,000 ounces were sold. This month’s total represents a hefty125% increase over the sales levels from the year ago period. Notably, the number of ounces of silver sold year to date is now approaching the total number of ounces sold during the entire year of 2008, which was 19,583,500. One more month of strong sales would push this year’s total above the mark.
Gold and Silver Eagle Bullion Sales June 2009

The US Mint’s sales of gold and silver bullion coins during June 2009 showed increases from both the prior month and year ago levels. The increases came amidst two interesting developments for the US Mint’s bullion coin programs.
In the middle of the month, the US Mint announced that their long standing rationing programs would be lifted. Authorized purchasers of bullion coins had been limited in the total number of coins that they could order. This had been cited by many as a sign of the high physical demand for precious metals which would eventually drive prices higher.

Later in the month, the US Mint made the seemingly contradictory announcement that the American Gold Buffalo bullion coin offering would be canceled for 2009. This had been the US Mint’s 24 karat gold bullion coin, launched in 2006 as a way of competing with other world mints that produced gold coins with greater fineness than the 22 karat Gold Eagle.

Here’s a look at the US Mint’s gold, silver, and platinum bullion sales during the month of June 2009. A year to date total appears in the last column.

June 2009 US Mint Bullion Sales
1 oz. 1/2 oz. 1/4 oz. 1/10 oz. Total oz. YTD Total oz.
Gold Eagle 116,000 116,000 670,000
Silver Eagle 2,245,000 2,245,000 13,824,500
Platinum Eagle

Sales of the Gold Eagle were still confined to only the one ounce bullion coin. A total of 116,000 ounces were sold, which was close to double the prior month’s sales of 65,000 ounces. This also marks a huge increase from the year ago period when only 15,500 ounces of gold were sold. It’s interesting to note that the sales increase comes amidst a down month for gold. Physical gold buyers have tended to increase purchases during period of price decline and curtail purchases during periods of price appreciation.

Sales of the Silver Eagle reached 2,245,000 ounces. This was an increase from the prior month when 1,904,500 ounces were sold and an increase from the year ago period when 1,735,500. With the year now half completed, the American Silver Eagle remains on pace to exceed last year’s record sales of 19,583,500 ounces.

Once again, the US Mint did not offer the Platinum Eagle bullion coin in any size.

Gold, Silver & Platinum 2009 Second Quarter Performance

With the second quarter behind us, let’s take a look at the performance of gold, silver, and platinum for the second quarter of 2009 and year to date.
All of the metals posted gains, but at single digit levels. The best performer for the second quarter was silver with a gain of 6.33%, followed by platinum with a gain of 5.52%, and then gold with a gain of 1.96%. The closing numbers don’t tell the full story. At the beginning of June, precious metals prices had spiked. At this recent peak, silver had been up as much as 22% for the quarter. Platinum and gold were also showing heftier gains at this time.

2009 Second Quarter Gold, Silver, and Platinum Performance
31-Mar-09 30-Jun-09 Change Percent
Gold 916.5 934.50 18.00 1.96%
Silver 13.11 13.94 0.83 6.33%
Platinum 1,124.00 1186.00 62.00 5.52%

On a year to date basis, the top precious metal performer remains as platinum with a gain of 32.07% on the year. This is followed by silver with a gain of 29.19% and gold with a gain of 7.44%. The performance of the metals had lined up in the same manner at the close of the first quarter.

2009 YTD Gold, Silver, and Platinum Performance
30-Dec-08 30-Jun-09 Change Percent
Gold 869.75 934.50 64.75 7.44%
Silver 10.79 13.94 3.15 29.19%
Platinum 898.00 1186.00 288 32.07%

US Mint Gold and Silver Bullion Sales Through May 2009

As in the past, I wanted to write another post examining the US Mint’s monthly gold, silver, and platinum bullion coin sales. Previously these figures were a flawed method of examining demand for physical precious metals due to the rationing program in place from the United States Mint. As long as authorized purchasers of US Mint bullion coins were restricted in the quantities they could purchase, it was difficult to ascertain how much unmet demand existed behind the rationing wall.

However, this month the figures might be closer to providing a useful measure. As I mentioned in several posts this month, a likely combination of decreasing demand and increasing supply has turned the Gold and Silver Eagle shortage to a surplus. For the first time since the rationing programs began, authorized purchasers did not purchase the maximum number of coins allotted by the US Mint.

Here’s a look at the US Mint gold, silver, and platinum bullion sales for the month of May 2009, along with a year to date total in the final column.

April 2009 US Mint Bullion Sales
1 oz. 1/2 oz. 1/4 oz. 1/10 oz. Total oz. YTD Total oz.
Gold Eagle 65,000 65,000 554,500
Gold Buffalo
Silver Eagle 1,904,500 1,904,500 11,579,500
Platinum Eagle

There were sales of 65,000 ounces of gold during May 2009. Once again this consisted entirely of one ounce 2009 Gold Eagles, as the US Mint did not offer fractional coins or the 24 karat Gold Buffalo. This was a big drop from the prior month when 147,500 ounces were sold, however it is more than double the number of coins sold in the year ago period of May 2008 when 31,500 ounces were sold.

There were sales of 1,904,500 ounces of silver during May 2009. This was a decline from the prior month when 2,518,000 ounces were sold and a decline, but still up from the year ago period of May 2008 when 1,516,000 ounces were sold. Sales of silver bullion still remain on pace for a record breaking year. The current record was set during 2008 when 19,583,500 ounces were sold for the entire year.

Platinum bullion coins were still not offered for sale by the US Mint. No platinum bullion coins have been offered since November 2008. The US Mint has not provided any additional statements on the status of platinum bullion coins. Notably, the Royal Canadian Mint has been able to produce and sell their Platinum Maple Leaf coins during 2008.

Based on the figures for the gold and silver bullion sales, demand for physical precious metals is apparently dropping significantly at a time when the market prices of the metals seemed to be gaining some momentum. This could be a seasonal impact since prior sales figures show the sales trailing off during the summer months. Or it could be a signal that some buyers are taking pause to see if the much ballyhooed “green shots” actually take root or whither up and die.

Disclosure: Long physical gold and silver

Gold and Silver Paper and Physical Markets Realign

Late last year and early this year, a continual observation of the gold and silver markets was the disconnect between the prices quoted on paper markets and the prices that you would actually need to pay to buy physical precious metals. In the past few weeks premiums for physical gold and silver have declined as the prices quoted on the paper market have risen, basically bringing the two markets back into alignment.

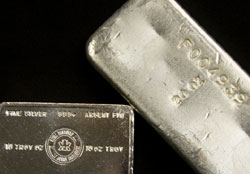
Back in October 2008, I had examined 100 ounce silver bars as an example of the excessive premiums being paid for physical precious metals. I collected some data from recently completed eBay auctions that showed the average price of the 100 ounce silver bar ranging from $1,329 to $1,557 while the market price of silver ranged from $8.88 to $10.89. This represented premiums ranging from $39.62% to 56.45%. This was particularly ridiculous since the 100 ounce silver bar has been traditionally viewed as a low premium method for silver investing.

Reviewing some data for eBay auctions completed yesterday now shows the prices paid for 100 ounce silver bars ranging from $1,450 to $1,500. At yesterday’s closing price of silver of $14.09, this represents a much more reasonable premium of about 3% to 6%.

Peculiarly, the decline in premium is a close match to the increase in price for spot silver. If you invested in silver by buying physical bars back in October, you might be showing zero profit even though the market price is up over 40%.

Future Gold and Silver Price Implications?

When the premiums for physical precious metals were high, it was viewed as a sign of heavy demand amidst a diminished supply that would eventually force market prices to move higher. Now that the disconnect between the paper and physical markets has seemingly resolved itself, is this a signal of slower demand that will lead to lower prices?

Despite the implication of slower demand, I think the realignment of the markets represents a long term positive for the price of gold and silver. Back when premiums were high, I am sure that many potential investors backed away from the market when they were faced with excessive premiums. Potential investors will now actually be able to buy physical gold and silver around the market prices. This is a much better environment for fostering mainstream demand to keep gold and silver moving higher.
[phpbay]100 ounce silver bar, 3, “”, “”[/phpbay]

US Mint Bullion Sales for April 2009

The US Mint’s bullion sales figures for April 2009 remained robust. The amount of gold bullion sold during the month was the highest of the year. Silver bullion sold was the second highest figure for the year. Once again, the US Mint did not sell any platinum bullion coins. This offering has been delayed with no indication of when sales might begin. Similarly, the 24 karat Gold Buffalo coins were not offered as they are also delayed.

The sales totals for all bullion coins offered by the United States Mint are presented below.

April 2009 US Mint Bullion Sales
1 oz. 1/2 oz. 1/4 oz. 1/10 oz. Total oz.
Gold Eagle 147,500 147,500
Gold Buffalo
Silver Eagle 2,518,000 2,518,000
Platinum Eagle

There were 147,500 ounces of gold sold during April 2009. This consisted entirely of one ounce gold coins, as fractional coins were still not offered.This represented the highest sales level of the year to date. The prior month had sales of 136,500. Sales for the year ago period of April 2008 were 47,500 ounces.

There were 2,518,000 ounces of silver sold during April 2009. Silver bullion sales continue to be at higher levels, on pace for a record year. Since the coins are subject to rationing, this might be an indication that the Silver Eagle shortage might be ending. The prior month silver bullion sales were 3,132,000. Sales for the year ago period of April 2008 were 1,584,000.

Is the Silver Eagle Shortage Ending?

World mints have struggled to keep up with the booming demand for precious metals. The situation has been ongoing for more than a year and frustrated physical silver investors with suspensions, rationing, and delays. There are finally some signs that the shortage may be coming to an end, in particular for the American Silver Eagle bullion coin.

The Silver Eagle shortage first began in February 2008. The US Mint became so overwhelmed with orders for the popular silver bullion coin that they were forced to suspend taking new orders. The suspension was only in place until March 2009, however, sales were resumed on a rationed basis. Authorized purchasers were limited in the number of coins that they could order. Early suggestions indicated that the rationed amounts covered only a fraction of the overall demand.

More than one year later, there are some indications that the situation may finally be abating. As I mentioned in my post on the US Mint’s March 2009 Bullion Sales, sales of silver and gold reached extremely high levels. Sales of silver coins were actually the highest monthly total since 1986. Since these are rationed sales, the high level was more of an indication of reduced supply constraints than increased demand.

Recently, there have been more indications at the dealer level that the shortage may be ending. One  dealer has reported that delays for delivery of Silver Eagles are shortening, and premiums for the coins is declining. At the height of the shortage premiums were as high as $4.50 over the spot price of silver. Premiums have now pulled back to around $3.00 over spot.

US Mint Reports Highest Monthly Silver Bullion Sales Since 1986

As I have in the past, I have compiled the total bullion sales from the US Mint’s bullion coin programs. The numbers for March 2009 bullion sales carry a bit of a surprise. The US Mint recorded the highest monthly silver bullion sales since December 1986, which was the second month the silver bullion coins were offered.

During March 2009, the US Mint only sold one ounce American Gold Eagles and one ounce American Silver Eagles. They continue to delay production of the 24 karat Gold Buffalo coins, all Platinum Eagle bullion coins, and fractional versions of the Gold Eagle. The sales totals for the two available bullion coins are presented below.

March 2009 US Mint Bullion Sales
1 oz. 1/2 oz. 1/4 oz. 1/10 oz. Total oz.
Gold Eagle 136,500 136,500
Gold Buffalo
Silver Eagle 3,132,000 3,132,000
Platinum Eagle

Total ounces of gold sold during March 2009 was 136,500 ounces. This is an increase from the prior month when 113,500 ounces were sold. It’s a big jump from the year ago period of March 2008 when 50,000 ounces were sold.

Total ounce of silver sold in March 2009 was a whopping 3,132,000. This is up from the prior month when 2,125,000 ounces were sold and the year ago period when 1,855,000 ounces were sold. This represents the second highest total since the bullion coins were first offered in 1986. The highest total was attained for the month of December 1986 at 3,696,000.

There are two ways to interpret last month’s surge Silver Eagle bullion coin sales. As readers of this blog will know, the US Mint has cut, delayed, or suspended nearly every gold and silver product except for the one ounce Gold Eagle and Silver Eagle coins, which continue to be subject to rationing. That being the case, the level of sales is not really an indicator of demand, but an indicator of how many precious metals blanks the US Mint was able to obtain and mint into coins.

On one hand, the increased amount of sales could suggest that the scarcity for precious metals blanks is finally abating. The US Mint was able to obtain more blanks to produce bullion coins than any other month since the rationing program began in February 2008.

On the other hand, the demand for precious metals has continued in full force even during the month when the stock market supposedly “bottomed” and the world economy supposedly “turned the corner.” Beyond the reported sales, there also remains a wall of unmet demand ready, willing, and able to buy more silver when and if the rationing programs are ever removed.

Gold, Silver & Platinum 2009 First Quarter Performance

With the first quarter at an end, let’s take a look at the performance of gold, silver, and platinum so far this year.

When putting the numbers together, I knew what to expect, but its still surprising to see where the final numbers landed. Gold, silver, and platinum’s performance relative to one another has basically been turned upside down from the 2008 annual performance.

2009 First Quarter Gold, Silver, and Platinum Performance
30-Dec-08 31-Mar-09 Change Percent
Gold 869.75 916.50 46.75 5.38%
Silver 10.79 13.11 2.32 21.50%
Platinum 898.00 1,124.00 226.00 25.17%

For 2008, gold had performed the best with a gain of 4.32%, followed by silver with a loss of 26.90%, with platinum in last place with a loss of 41.31%.

As you can see the performance for the first quarter of 2009 has been the opposite with platinum performing best with a gain of 25.17%, followed by silver with a gain of 21.50%, with gold in last place with a gain of 5.38%.

Platinum and silver were in some respects recovering from the beating they took last year. Over the past several years gold has emerged as more of a steady performer, as compared to the more volatile performance of the other metals, commodities, equities, real estate, etc. It’s ironic that whenever a mainstream publication discusses the possibility of investing in gold, they never fail to caution about gold’s “volatile” prices.

At any rate, precious metals outperformed stocks for the quarter, mostly by a wide margin. The Dow, S&P 500, and Nasdaq lost 14.29%, 12.81%, and 3.07% respectively.

February 2009 US Mint Gold, Silver, and Platinum Bullion Sales

Another month has gone by already, so let’s take a look at the US Mint’s bullion sales for the month of February.

As an indicator of demand the bullion sales are not as useful as they used to be. This is because the US Mint continues to ration sales of one ounce Silver Eagles and one ounce Gold Eagles due to heavy demand and low supplies of blanks. They still have not begun production or sales of fractional gold bullion coins, their 24 karat gold bullion coin, or platinum bullion coins.

February 2009 US Mint Bullion Sales
1 oz. 1/2 oz. 1/4 oz. 1/10 oz. Total oz.
Gold Eagle 113,500 113,000
Gold Buffalo
Silver Eagle 2,125,000 2,125,000
Platinum Eagle

The total ounces of gold sold during February 2009 was 113,500. That was up from the prior month when 92,000 ounces were sold and way up from the year ago period when 27,500 ounces were sold. If the current pace continues the US Mint will be on track to sell over one million ounces during 2009.

The total ounces of silver sold for February 2009 was 2,125,000. This is up from the prior month total of 1,900,000 ounces. In the year ago period only 200,000 ounces of silver were sold due to a lengthy sales suspension.

As mentioned, the suspension of platinum bullion coin production continued through February 2009.