April 24, 2024

Gold and Silver: Investment Similarities

Gold and silver just seem to go together. They’re two precious metals that we love to invest in, especially after the strong performance of the metals during 2011, and gold’s string of consecutive annual gains stretching back a decade.

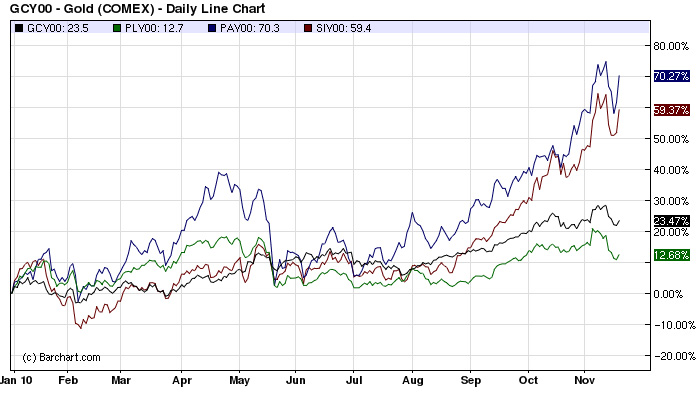
This year, gold futures have grown as much as 25% this year and silver futures as much as 75%. It’s this last figure that really interests us though. It is indicative of growing investor interest in a metal that is much more affordable than gold, but still offers many of the same benefits in the precious metals market.

Gold and Silver Investment Options

The major similarities that we can point to are related to the various ways that gold and silver are sold and traded among investors. In most cases, a potential investor has a few different options:

  • They can invest in bullion coins
  • They can invest in numismatic coins
  • They can invest in exchange traded funds or ETFs

Gold and silver bullion coins are produced by a number of different world mints. A few of the most widely traded options include the American Silver Eagle from the United States Mint, the Silver Maple Leaf from the Royal Canadian Mint, and the Silver Philharmonic from the Austrian Mint. These coins are issued each year and are generally sold based on the market price of silver plus a mark up. The mark ups might be $2.50 to $4.00 per coin, depending on the quantity purchased.

Numismatic gold and silver coins are those which are valued not only based on their intrinsic value, but also their rarity and condition. In some cases, a rise in the price of precious metals might not result in an increase in value for numismatic coins since other factors come into play. It takes some understanding of the coin market and grading scales to invest in numismatic coins.

For many beginning investors, Exchange Traded Funds provide a useful alternative. Precious metals ETFs are traded on stock exchanges in the same manner as stocks and generally track the price of the underlying metals. There are different types of ETFs, which use either physical metal or futures and contracts to track the price of the underlying metal. The largest and widely held precious metals ETFs are the SPDR Gold Shares ETF (GLD) and the iShares Silver Turst (SLV).

Did JP Morgan Jump or Were They Pushed?

JP Morgan has “quietly reduced” their short silver positions. So is this going to take off the block on the silver market?

In the short term then yes it will, but it is probably a good idea to be a bit wary, even while accepting that silver has a good way to go up.

So what was the issue with JP Morgan?  In essence JP Morgan had what was known as “naked shorts” which means that JP Morgan was essentially selling what it didn’t have.  JP Morgan would sell you forty pieces of silver, or whatever, in three months time in the hope that the silver price would go down from the price that was agreed. If the price went down then JP Morgan would make a small profit as you didn’t exercise the option that it sold you.  If the price went up, you’d make the profit and JP Morgan would make a loss.  This is fairly standard practice.

The problem that JP Morgan had was that they sold a significant market moving amount of silver options.  This was, so some more excitable silver followers claimed, lowering the price of futures which meant that the current price of silver could not help but be affected.  It also put JP Morgan into a tight spot as they were in beyond their means.  There were so much silver futures that JP Morgan would not be able to redeem it all meaning that it would have to scramble in the markets to buy the silver, meaning that it would be bankrupted.

Well that doesn’t seem to be happening.  This looks like part of a staged withdrawal, orchestrated by the major players.  The first step was a rise in the required margins on the options, which meant that all players had to have more silver on their balance sheets before playing with margins – and so cutting some of the frothiness out of the market.  This is stage two.

JP Morgan was sailing far too close to the wind, even if they were not going to go bankrupt, and this quiet withdrawal means that their losses are real but limited.  So there will not be that sudden spike as JP Morgan is held hostage by holders of physical silver that many silver bulls were expecting.

Silver is a really good inflation play, as well as being a reasonable industrial metal.  In the long term its fundamentals have improved thanks to the excitable statements being safely out of the way.

How Much Gold and Silver Will the Treasury Secretary Determine is Sufficient to Meet Public Demand?

A bill, which seeks to provide greater Congressional oversight for circulating coin compositions, may have implications for the quantity of United States Mint gold and silver bullion coins that are available to precious metals investors.

The bill H.R. 6162 Coin Modernization, Oversight, and Continuity Act of 2010 primarily establishes rules for the Secretary of the Treasury to provide biennial reports to specified committees on the costs related to circulating coins, and make recommendations for new metallic materials or procedures. A final section of the bill deals with “meeting the demand for gold and silver numismatic items”, although the implications seem to extend to bullion coins.

Following the cancellation of the 2009 Proof Silver Eagles, the United States Mint sought greater flexibility to produce numismatic versions of the coin. The Director of the United States Mint requested such authority be granted to the Secretary of the Treasury at a hearing of the Subcommittee on Domestic Monetary Policy and Technology on July 20, 2010. The chairman of the subcommittee Melvin Watt was the one who introduced the bill H.R. 6162.

The following is Sec. 4 of the bill:

Subsections (e) and (i) of section 5112 of title 31, United States Code are each amended by striking ‘quantities’ and inserting ‘qualities and quantities that the Secretary determines are’.

Here’s how the law authorizing American Silver Eagles currently reads (emphasis added):

(e) Notwithstanding any other provision of law, the Secretary shall mint and issue, in quantities sufficient to meet public demand, coins which— (1) are 40.6 millimeters in diameter and weigh 31.103 grams; (2) contain .999 fine silver; (3) have a design— (A) symbolic of Liberty on the obverse side; and (B) of an eagle on the reverse side…

And here’s now the law would read if the bill H.R. 6162 is enacted (emphasis added):

(e) Notwithstanding any other provision of law, the Secretary shall mint and issue, in quantities and qualities that the Secretary determines are sufficient to meet public demand, coins which— (1) are 40.6 millimeters in diameter and weigh 31.103 grams; (2) contain .999 fine silver; (3) have a design— (A) symbolic of Liberty on the obverse side; and (B) of an eagle on the reverse side…

A similar change occurs for subsection (i), which deals with American Gold Eagles.

The inclusion of the word “qualities” was necessary to accomplish the presumed goal of the legislation to allow the issuance of numismatic versions of the coins, but what about the added phrase “that the Secretary determines are sufficient”?

Is the amount of gold and silver bullion coins that the Secretary determines are sufficient to meet public demand different that than amount which will actually meet public demand?

Even under the strict existing standard, there have been extended periods of time when full public demand was clearly not being met. The sale of Gold and Silver Eagle bullion coins have been completely suspended for brief periods, and rationed for considerably longer periods. Most recently, Gold Eagles were subject to rationing from December 2009 until March 2010, and Silver Eagles were rationed from December 2009 until September 2010.

What will happen if the standard becomes less strict and more indefinite?

US Mint Bullion Programs at the Treasury Secretary’s Discretion

Besides the American Gold and Silver Eagles, no other US Mint bullion programs carry the requirement to be produced in quantities sufficient to meet public demand. The language varies, but each program is effectively left to the discretion of the Secretary of the Treasury.

The 24 karat American Gold Buffalo coins, carry the requirements, “Not later than 6 months after the date of enactment of the Presidential $1 Coin Act of 2005, the Secretary shall commence striking and issuing for sale such number of $50 gold bullion and proof coins as the Secretary may determine to be appropriate, in such quantities, as the Secretary, in the Secretary’s discretion, may prescribe.”

The subsection dealing with American Platinum Eagles reads: “The Secretary may mint and issue platinum bullion coins and proof platinum coins in accordance with such specifications, designs, varieties, quantities, denominations, and inscriptions as the Secretary, in the Secretary’s discretion, may prescribe from time to time.”

And, the recently issued 5 ounce America the Beautiful Silver bullion coins: “The Secretary shall strike and make available for sale such number of bullion coins as the Secretary determines to be appropriate that are exact duplicates of the quarter dollars issued under subsection (t)”

Granted that there is no public demand requirement, but how is the Treasury Secretary doing with these other gold and silver bullion programs?

Inventories of the American Gold Buffalo bullion coins were completely depleted by the end of September 2010. At that point, the US Mint indicated that no further inventory of 2010-dated bullion coins would be made available.

The American Platinum Eagle has not been available in bullion format for more than two years. After final inventories were exhausted in late 2008, the US Mint indicated that the 2009 release would be delayed. The 2009-dated bullion coins were eventually canceled. The US Mint has not provided any information on 2010-dated bullion coins, and none have been issued to date.

The America the Beautiful Silver Bullion Coins went on sale to authorized purchasers today. The supply was so limited that the US Mint urged primary distributors to keep prices reasonable. Market forces took precedence and the bullion coins have been selling for double the silver value, or more.

Conclusion

So what is the difference between “quantities sufficient to meet public demand” and “quantities that the Secretary determines are sufficient to meet public demand”?

In practice, we shall see if this represents a different standard, but at this point the change in wording makes me uncomfortable.  I want the supply of gold and silver bullion coins to be determined by demand in the marketplace, not determined by unspecified criteria established by the Secretary of the Treasury.

As the bill has already been passed in the House and Senate, and only requires the President’s signature to become law, it seems too late to do anything other than brace for the possible repercussions.

New US Mint Silver Bullion Coin Series Starts Next Week

The release date, mintages, and premiums for  the United States Mint’s America the Beautiful Silver Bullion Coins were finally revealed this week. Precious metals investors and collectors were in for a few surprises.

As covered in a previous post, the coins will feature the same designs as the America the Beautiful circulating commemorative quarter dollars. This will result in five different issues per year from 2010 to 2020, and a single issue in 2021. The bullion coins will be struck in 5 troy ounces of .999 fine silver with the curious legal tender face value of 25 cents. Specifications include a diameter of 3 inches and thickness of 0.16 inch.

The release date for the new series will be December 6, 2010. This is the first date that the United States Mint’s authorized purchaser network can place orders for the new series. As with other bullion coins, the US Mint uses a small network authorized dealers to handle distribution. They purchase the coins in bulk quantities directly from the Mint and then resell them to other dealers and/or the public. Individuals are not able to buy the America the Beautiful Silver Bullion Coins directly from the Mint, but must purchase them from a bullion dealer or other market source.

The US Mint will only be producing 33,000 units for each of the 2010 designs. This results in total production of 165,000 of the silver bullion coins. It had previously been reported that 500,000 would be struck, but for unspecified reasons this amount was reduced. In terms of bullion, 825,000 ounces (165,000 of the 5 ounce coins) is an incredibly small amount. In the last  month, the US Mint sold more than 4.2 million ounces of silver bullion.

Premiums charged to authorized purchasers for the America the Beautiful Silver Bullion Coins will be $9.75 per coin. This is a very reasonable amount, but the premiums that are paid on the secondary market might be another matter. At the primary distribution level, the US Mint has warned authorized purchasers to set premiums at a level “competitive with those charged for other bullion coins.” I think the primary dealers will do their best to follow this mandate, but at subsequent levels of distribution, market forces will take precedence and drive prices higher.

In the first quarter of 2011, the US Mint will offer numismatic versions of the 5 ounce silver coins. These will be limited to only 27,000 units each. This will be another adventure waiting to happen. However, in this case the US Mint will sell the coins directly to the public at fixed prices, and will likely impose household limits to ensure broad distribution.

Details Awaited for America the Beautiful 5 oz. Silver Coins

Silver investors and coin collectors have been awaiting the final details of the United States Mint’s new silver bullion coins. Some preliminary information such as the design, specifications, and production levels have been revealed, but the premiums and exact release dates remain unknown.

The America the Beautiful Silver bullion coins will feature the designs of the new circulating commemorative quarter series struck in 5 ounces of .999 fine silver. Under Public Law 110-456, the coins will be produced with an unusually large diameter of 3.0 inches. By comparison, the Perth Mint’s 5 oz Lunar silver bullion coins have a diameter of about 2.58 inches. The larger diameter makes the US Mint’s coins more difficult to produce and potentially bendable by hand, due to the thickness of only 0.16 inches.

Following the America the Beautiful Quarters Program, a total of 56 different designs will be released between 2010 and 2021. The releases will feature a National Park or National Site from each of the 50 States, 5 U.S. Territories, and Washington, D.C. The order of release has been established based on the dates the areas were federally designated.

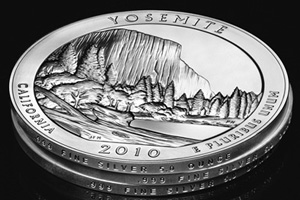
By law the US Mint may issue make the coins available for sale only during the calendar year that the corresponding quarter dollars are released. This means that the 2010 5 oz silver bullion coins featuring Hot Springs, Yellowstone, Yosemite, the Grand Canyon, and Mount Hood must be issued available for sale before the close of the year.

Overall production is left to the discretion of the Treasury Secretary. This is in contrast to the American Silver Eagle, which must be struck based on public demand. For 2010, the US Mint has planned production of 500,000 of the America the Beautiful Silver Bullion Coins, equally divided amongst the five designs.

The new silver bullion coins will be distributed through the US Mint’s authorized purchaser network, which currently distributes other bullion products. The premium that authorized purchasers will need to pay above the market value of the silver has not yet been announced. For the American Silver Eagle, the premium is currently $2.00 per coin. Premiums for American Gold Eagles range from 3% to 9% depending on the bullion weight.

Societe Generale Favors Gold and Silver Against Farm Commodities

At a recent media briefing, Societe Generale made their predictions for the next year’s commodities prices. Though gold has been in record territory and some are concerned that the price is peaking, they predict that it will continue to be a strong investment.

Fredric Lasserre, head of commodities research, commented “We might see some gold-price rally again because of the recent fears regarding sovereign debt, and also the impact it may have on the dollar-euro.” According to the bank’s predictions, gold could advance 11% in the next year. Palladium could advance 21% and silver could advance 19%.

Societe Generale contrasted these predictions with those of other commodities, particularly farm products. The bank cited supply shocks when it stated that most farm commodities don’t seem to have much upside potential at the moment. Their prices have recently rallied, but are not expected to do so again, unlike those of precious metals.

This year precious metals performance has been led by palladium, which has advanced 75%, followed by silver, up 64%, and gold, which has advanced 24%.

Soc Gen’s statements have been echoed by other banks who have also backing been gold and silver investment for the coming year. They recommend that consumers remain overweight in precious metals, stating that they are some of the safest long positions. This confidence appears to be supported by the recent behavior of the market.

Platinum Price Underperforms Gold, Silver, and Palladium

In what has been a strong year for precious metals, platinum is showing only a modest gain of 13.35% for the year to date. This is below the gains experienced for gold and silver, and far below the nearly 75% gain for palladium.

After peaking at $2,273 per ounce in March 2008, platinum dropped precipitously to a low of $763 per ounce by October of the same year. While other precious metals have reattained their 2008 high water marks and then some, platinum has lagged behind.

Gold, Silver, Platinum, and Palladium Performance (London Fix Prices)

Dec 31, 2009 Nov 18, 2010 Change Percent
Gold 1,087.50 1,350.25 262.75 24.16%
Silver 16.99 26.57 9.58 56.39%
Platinum 1,461.00 1,656.00 195.00 13.35%
Palladium 393.00 684.00 291.00 74.05%

The relative under performance of platinum compared to palladium can be explained by the supply and demand situation. While platinum is forecast to be in a surplus of 290,000 ounces for the year, palladium will be in a deficit of around 200,000 ounces. There has been more demand for palladium, which is used in catalytic converters for gas powered automobiles, than platinum, which is used in diesel devices. Palladium recently hit a nine year high above $700 per ounce.

The ratio between the price of platinum and palladium is 2.42, which is the lowest ratio is more than seven years.

Gold, Silver, Platinum, Palladium Chart (COMEX Prices)

Gold and silver prices have benefited from strong demand from investors. Global fiscal imbalances and currency tensions have brought attention to these metals’ historic status as stores of value and inflation hedges. Due to platinum’s predominantly industrial uses and the supply surplus noted, it has not been as significant a beneficiary.

The price difference between platinum and gold is currently $305.75. When platinum reached its peak price in March 2008, the difference had expanded to $1,289. The metals traded close to parity in mid-December 2008.

Gold, Silver, Platinum, Palladium 2010 Second Quarter Performance

Although gold and silver are experiencing a sharp decline today, they recorded strong performance during the second quarter of 2010. Platinum and palladium both posted declines for second quarter, but maintain gains for the year to date.

The table below shows the last London Fix Price of 2009 for each metal and the last price for June 30, 2010 followed by the percentage gain or loss for the 2010 Second Quarter and the Year to Date performance.

2009 Close June 30, 2010 Close 2nd Quarter YTD
Gold $ 1,087.50 $ 1,244.00 11.52% 14.39%
Silver $ 16.99 $ 18.74 7.09% 10.30%
Platinum $ 1,461.00 $ 1,532.00 -6.87% 4.86%
Palladium $ 393.00 $ 446.00 -6.89% 13.49%

Gold recorded the largest gain for the most recent quarter with an increase of 11.52%. It is also showing the strong performance out of the four metals for the year to date, up 14.39%. During 2009, the other three metals had outperformed gold by wide margins.

Silver posted a gain of 7.09% for the quarter and is up 10.30% for the year to date. Notably, silver has now posted a gain for the past six consecutive quarters. This represents the longest quarterly winning streak which took place through the beginning of 1980 when silver had eleven consecutive quarters of gains.

Platinum and palladium showed declines of 6.87% and 6.89% for the quarter. Year to date numbers remain positive at 4.86% and 13.49%.

Measuring Declines from the High- Gold, Silver, Platinum, Palladium

For the past few weeks, precious metals have undergone significant, rapid declines. This follows a year of banner performance during 2009. I wanted to take a post to briefly examine the extent of the declines for gold, silver, platinum, and palladium.

Roughly two months ago, gold had reached a new all time high and silver had reached its highest level going back about twenty months. Less than three weeks ago, platinum and palladium had reached their highest levels in about sixteen months.

The figures below show the recent high compared to the recent low and the extent of the decline. All figures are London PM Fix.

Gold

Recent High: $1,212.50 (December 2, 2009)
Recent Low: $1,058.00 (February 5, 2010)
Decline: -$154.50 (-12.74%)

Silver

Recent High: $19.18 (December 2, 2009)
Recent Low: $15.14 (February 8, 2010)
Decline: -$4.04 (-21.06%)

Platinum

Recent High: $1,627.00 (January 20, 2010)
Recent Low: $1,475.00 (February 5, 2010)
Decline: -$152.00 (-9.34%)

Palladium

Recent High: $462.00 (January 21, 2010)
Recent Low: $395.00 (February 5, 2010)
Decline: -$67.00 (-14.50%)

2009 Precious Metals Performance: Gold, Silver, Platinum, Palladium

Precious metals delivered a strong performance during 2009 with strong returns across the major categories of gold, silver, platinum, and palladium. Although gold seemed to dominate the attention of the mainstream press, the annual performance figures reveal that it was outperformed by other precious metals.

The table below displays the last price of 2008 from Kitco’s historical charts and the last price of 2009. The change and percentage change are computed below.

2009 Precious Metals Performance

Gold Silver Platinum Palladium
Last 2008 Price 869.75 10.79 898.00 183.00
Last 2009 Price 1,087.50 16.99 1,461.00 393.00
Change 217.75 6.20 563.00 210.00
Percentage Change 25.04% 57.46% 62.69% 114.75%

As seen above the surprising winner for the year was palladium, which delivered a return of 114.75%. This was followed by platinum with 62,69%, silver with a gain of 57.46%, and lastly gold with a gain of 25.04% recorded.

In some respects the out performance of palladium, platinum, and silver are simply making up for ground that was lost during 2008 (2008 Precious Metals Performance). Last year palladium had fallen by nearly 50%, platinum by about 40%, and silver by 26%. During the same period, gold recorded a small gain of 4.32%.

One of the recent characteristics of gold has been its steady upward march, defying panics in other asset classes, and general declines in commodities. This year marks gold’s ninth annual gain, which has brought the price of gold 291% higher from the end of 2000 until the end of 2009.