March 29, 2024

Perth Mint Introduces Australian Platypus Platinum Bullion Coins

On March 1, 2011, the Perth Mint of Australia introduced a new platinum investment coin to complement the gold and silver offerings of their official bullion program. The Perth Mint has not offered a platinum investment coin since the withdrawal of the Platinum Koala in 2000, however they do produce certain platinum numismatic coins.

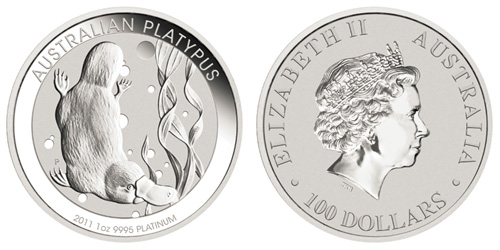
The Australian Platinum Platypus contains one troy ounce of 99.95% platinum. The design features the native aquatic mammal diving beneath the water. Above the scene is the inscription “Australian Platypus” with the date of issue, bullion weight, and purity indicated below. The other side of the coin features a portrait of Elizabeth II with the legal tender face value of “100 Dollars”.
The current market price of platinum is $1,835 per troy ounce. Last year the price of platinum rose by 18.08%, under performing gold, silver, and palladium. For the year to date, platinum has risen about 6%. This compares to gains of 1.24% for gold, 15.25% for silver, and 1.77% for palladium.

A maximum of 30,000 Platinum Playpus coins will be issued by the Perth Mint during 2011. All future annual releases will carry the same limit.

Other world mints that offer platinum bullion coins include the Royal Canadian Mint with their Platinum Maple Leaf offering. In the past, the United States Mint has American Platinum Eagle bullion coins, however these have not been issued since 2008. Initially, production was halted in an effort to deal with surging demand for gold and silver bullion coins.

2010 Gold, Silver, Platinum, and Palladium Price Performance

Precious metals delivered another year of strong performance, with double digit percentage gains for gold, silver, platinum, and palladium.
Palladium led the pack with an increase of 96.77% for the year. The metal is now at a nine year high, with gains attributed to the dwindling stockpiles in Russia amidst increased demand for use within catalytic converters in gasoline powered automobiles. As recently as December 2008, the price of palladium was $164 per ounce, compared to this year’s closing price of $791.

Silver had an impressive year with a gain of more than 80%, outperforming gold’s rise of 27.74%. With the price of silver moving up faster than gold, the gold-silver ratio continues to contract. This ratio indicates the number of ounces of silver necessary to purchase one ounce of gold. At the start of the year, the ratio was 64.98. At the close of the year, the ratio is 46.04.

The table below shows the last available London Fix prices from 2009, today’s London AM Fix price, the change, and percentage change.

2010 Precious Metals Price Performance


Dec 31, 2009 Dec 31, 2010 Change Percent
Gold $1,104.00 $1,410.25 $306.25 27.74%
Silver 16.99 30.63 13.64 80.28%
Platinum 1,466.00 1,731.00 265.00 18.08%
Palladium 402.00 791.00 389.00 96.77%

Although palladium and silver outshone gold this year, gold continues its impressive streak of consecutive annual gains. The price of gold has recorded an annual gain each year since 2001. During the ten year period, the price of gold has risen more than fourfold from $272 per ounce to $1,410.

Platinum Price Underperforms Gold, Silver, and Palladium

In what has been a strong year for precious metals, platinum is showing only a modest gain of 13.35% for the year to date. This is below the gains experienced for gold and silver, and far below the nearly 75% gain for palladium.

After peaking at $2,273 per ounce in March 2008, platinum dropped precipitously to a low of $763 per ounce by October of the same year. While other precious metals have reattained their 2008 high water marks and then some, platinum has lagged behind.

Gold, Silver, Platinum, and Palladium Performance (London Fix Prices)

Dec 31, 2009 Nov 18, 2010 Change Percent
Gold 1,087.50 1,350.25 262.75 24.16%
Silver 16.99 26.57 9.58 56.39%
Platinum 1,461.00 1,656.00 195.00 13.35%
Palladium 393.00 684.00 291.00 74.05%

The relative under performance of platinum compared to palladium can be explained by the supply and demand situation. While platinum is forecast to be in a surplus of 290,000 ounces for the year, palladium will be in a deficit of around 200,000 ounces. There has been more demand for palladium, which is used in catalytic converters for gas powered automobiles, than platinum, which is used in diesel devices. Palladium recently hit a nine year high above $700 per ounce.

The ratio between the price of platinum and palladium is 2.42, which is the lowest ratio is more than seven years.

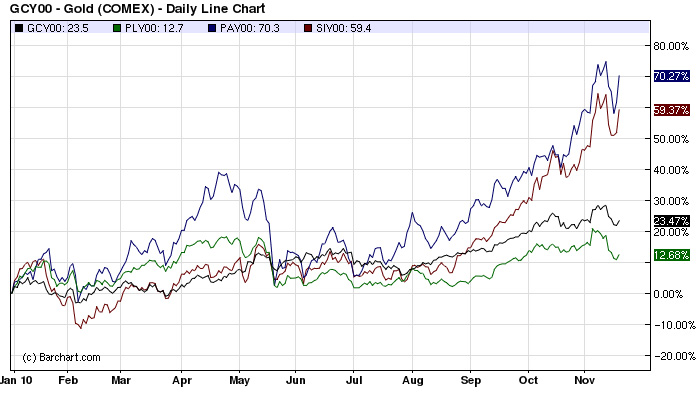
Gold, Silver, Platinum, Palladium Chart (COMEX Prices)

Gold and silver prices have benefited from strong demand from investors. Global fiscal imbalances and currency tensions have brought attention to these metals’ historic status as stores of value and inflation hedges. Due to platinum’s predominantly industrial uses and the supply surplus noted, it has not been as significant a beneficiary.

The price difference between platinum and gold is currently $305.75. When platinum reached its peak price in March 2008, the difference had expanded to $1,289. The metals traded close to parity in mid-December 2008.