April 20, 2024

Buying Your Gold at the ATM

In May of this year, the very first gold vending machine in the world was installed and used. That’s right, a vending machine where a customer can purchase gold bars was put into place. It’s located in Abu Dhabi’s Emirates Palace hotel—a luxurious place that is frequented by billionaires and even royalty—and apparently, it’s been a success. Gold to Go, the company that owns and operates the machine has recently announced that it has plans to consider a US installation.

Gold to Go

According to the company’s statements, “Gold to Go is a trading and sales concept which facilitates selling gold bars and coins independently from shop-based display and sales locations.”

Their vending machine in Abu Dhabi, sometimes referred to as a gold ATM, is actually covered in 24-carat gold. The machine works by dispensing gold in discrete black packaging. You can choose to purchase your gold in a number of different forms and weight. A small one-ounce bar is being offered as well as six different coins and 1, 5, and 10 gram bar options. Each is engraved to reflect the unique nature of the gold’s origin. The bars are stamped with the Emirates Palace logo while the coins bear the symbols of gold producing locales like Canada, Australia, and South Africa.

Where is it Headed?

Gold to Go intends their product to target two different audiences. The first is the potential investor. Buying gold this way demystifies the precious metal, they claim. The vending machine can facilitate a private investment for those who would like to take advantage of the metal’s recent market popularity. It also makes a good souvenir for those travelers who can afford it.

The gold vending machines may be available to the public in the United States as early as next year. Currently, it is slated to have locations in both Las Vegas and Florida.

Societe Generale Favors Gold and Silver Against Farm Commodities

At a recent media briefing, Societe Generale made their predictions for the next year’s commodities prices. Though gold has been in record territory and some are concerned that the price is peaking, they predict that it will continue to be a strong investment.

Fredric Lasserre, head of commodities research, commented “We might see some gold-price rally again because of the recent fears regarding sovereign debt, and also the impact it may have on the dollar-euro.” According to the bank’s predictions, gold could advance 11% in the next year. Palladium could advance 21% and silver could advance 19%.

Societe Generale contrasted these predictions with those of other commodities, particularly farm products. The bank cited supply shocks when it stated that most farm commodities don’t seem to have much upside potential at the moment. Their prices have recently rallied, but are not expected to do so again, unlike those of precious metals.

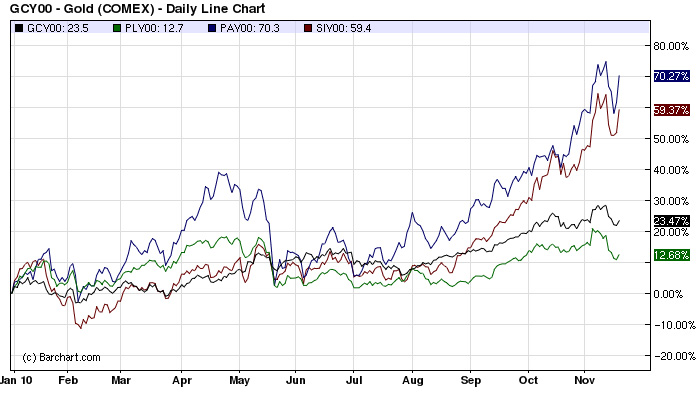
This year precious metals performance has been led by palladium, which has advanced 75%, followed by silver, up 64%, and gold, which has advanced 24%.

Soc Gen’s statements have been echoed by other banks who have also backing been gold and silver investment for the coming year. They recommend that consumers remain overweight in precious metals, stating that they are some of the safest long positions. This confidence appears to be supported by the recent behavior of the market.

Platinum Price Underperforms Gold, Silver, and Palladium

In what has been a strong year for precious metals, platinum is showing only a modest gain of 13.35% for the year to date. This is below the gains experienced for gold and silver, and far below the nearly 75% gain for palladium.

After peaking at $2,273 per ounce in March 2008, platinum dropped precipitously to a low of $763 per ounce by October of the same year. While other precious metals have reattained their 2008 high water marks and then some, platinum has lagged behind.

Gold, Silver, Platinum, and Palladium Performance (London Fix Prices)

Dec 31, 2009 Nov 18, 2010 Change Percent
Gold 1,087.50 1,350.25 262.75 24.16%
Silver 16.99 26.57 9.58 56.39%
Platinum 1,461.00 1,656.00 195.00 13.35%
Palladium 393.00 684.00 291.00 74.05%

The relative under performance of platinum compared to palladium can be explained by the supply and demand situation. While platinum is forecast to be in a surplus of 290,000 ounces for the year, palladium will be in a deficit of around 200,000 ounces. There has been more demand for palladium, which is used in catalytic converters for gas powered automobiles, than platinum, which is used in diesel devices. Palladium recently hit a nine year high above $700 per ounce.

The ratio between the price of platinum and palladium is 2.42, which is the lowest ratio is more than seven years.

Gold, Silver, Platinum, Palladium Chart (COMEX Prices)

Gold and silver prices have benefited from strong demand from investors. Global fiscal imbalances and currency tensions have brought attention to these metals’ historic status as stores of value and inflation hedges. Due to platinum’s predominantly industrial uses and the supply surplus noted, it has not been as significant a beneficiary.

The price difference between platinum and gold is currently $305.75. When platinum reached its peak price in March 2008, the difference had expanded to $1,289. The metals traded close to parity in mid-December 2008.

2010 Third Quarter Gold Demand

Total identifiable gold demand for the third quarter showed an increase of 12% above year ago levels at 921.8 tonnes. Increases in demand from jewelry consumption, industrial sectors, and net retail investment more than offset a decline in demand from electronically traded funds, according to information published by the World Gold Council.

Compared to the 2010 second quarter, gold demand showed a decline of 10%. This was the result of the exceptionally high levels of investment demand experienced in the previous quarter.

During the third quarter, jewelery demand totaled 529.8 tonnes, representing an increase of 8% from the year ago period. Buyers in key markets such as Indian, China, Russia, and Hong Kong were not deterred by record high prices. The highest growth in demand was experienced in India, with an increase of 36%. With the recent focus of the media on gold investors, it’s interesting to note that more than half of identifiable gold demand comes from the jewelry sector.

Industrial demand for gold was 110.2 tonnes, marking an increase of 13% from the year ago period. Demand was led by electronics, which accounted for 77.9 tonnes and measured a gain of 18%. A decline in demand was experienced from the dentistry sector, with a drop of 7% to 12.2 tonnes.

Identifiable investment demand was up 19% from the year ago period at 281.8 tonnes. However, this did represent a decline of 16% from the previous quarter. The largest increase in demand for this category came from bar hoarding, which increased 44% to 132.4 tonnes. This is an interesting contrast to demand from ETFs which dropped 7% to 38.7 tonnes.

The average price of gold during the quarter was $1,226.75, ranging from a low of $1,157.00 to a high of $1,307.50 per ounce.

Identifiable Gold Demand (Source:GFMS)

Paper Money Collapses in Value as Gold and Silver Soar

Most people under the age of 50 have probably never seen government currency backed by a tangible asset such as silver.  The $1 dollar Silver Certificates, last produced in 1963, were backed by silver on deposit in the US Treasury and payable in silver to “the bearer on demand”.

The promise to redeem  Silver Certificate dollars for silver was withdrawn by the US Government and holders of such dollars had to be satisfied that the value of their dollar was now backed by the “full faith and credit” of the US Government.  Redemption of Silver Certificates for silver coin ended in 1964 and redemption of Silver Certificates for silver bullion was ended in 1968.

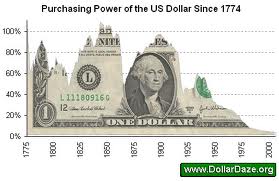
The era of currency backed by real money such as gold or silver ended and the dawn of a fiat currency system began.  The result for holders of currency backed by nothing more than promises has been disastrous as the value of paper dollars has seen its purchasing power virtually disappear.

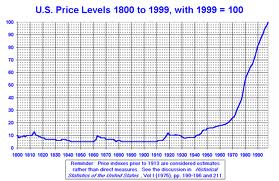
As the quantity of dollars has grown exponentially, their value has correspondingly diminished, leading to a large increase in general price levels.

Chart pbs.org

Despite the obvious increase in prices and the collapse of the value of the dollar, the Federal Reserve tells us they now need to engage in money printing quantitative easing in order to create inflation to help the economy.  Fed Chairman Bernanke ensures us that the Fed is committed to keeping inflation low.

“Although asset purchases are relatively unfamiliar as a tool of monetary policy, some concerns about this approach are overstated. Critics have, for example, worried that it will lead to excessive increases in the money supply and ultimately to significant increases in inflation. Our earlier use of this policy approach had little effect on the amount of currency in circulation or on other broad measures of the money supply, such as bank deposits. Nor did it result in higher inflation. We have made all necessary preparations, and we are confident that we have the tools to unwind these policies at the appropriate time. The Fed is committed to both parts of its dual mandate and will take all measures necessary to keep inflation low and stable.”

The Fed has not succeeded at keeping inflation low in the past and now seems obsessed with inflating asset values to prop up a weak economy.  It’s all about trust with fiat money, and the Fed Chairman seems to be losing credibility.

The price movements in gold and silver are strong indicators that no one is being fooled by the Fed Chairman’s words.  Investors are watching “what they do – not what they say”.   Expect gold and silver prices to be dramatically higher over time, with an initial objective of $5,000/oz for gold.

Which is Better to Own – Gold Bullion or Gold Stocks?

Gold investors have two basic choices – buying gold bullion or buying shares in companies that produce or own gold. As we examine the two basic investment vehicles available to gold investors, it becomes apparent that choosing the best investment option can be a complex decision. Some of the questions that a gold investor should consider include the following.
What has produced better investment results – owning gold bullion or a gold mutual fund?

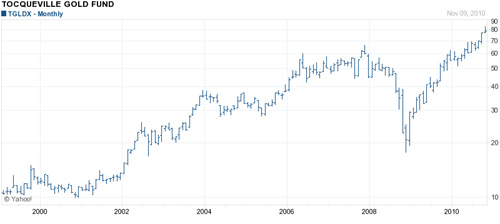
To gain insight into investment returns, let’s compare how an investment in gold bullion compared to investing in the Tocqueville Gold Fund (TGLDX).  I selected TGLDX since it is one of the best performing, actively managed gold funds with a long term track record.  An investment of $10,000 in the Tocqueville Gold Fund in 2000 would now be worth approximately $86,000 for a stunning return of 860%.   A $10,000 investment in gold bullion in 2000 would currently be worth approximately $46,400 or a 467% return.

Since gold mining companies are leveraged to the price movement of gold, it is not entirely surprising that the gold stocks would outperform the metal. Leverage, however, works both ways and in 2008, when gold experienced a price correction, TGLDX dropped from 65 to 19, a horrendous decline of 71%, whereas gold bullion experienced a normal bull market correction of only approximately 25%.   For those investors unwilling to tolerate huge price fluctuations, bullion seems a better way to go. When gold is moving up, expect the gold funds to outperform the metal.  In 2010, TGLDX has increased 42.7% compared to an increase in gold of 27%.

TGLDX Chart : Yahoo Finance

Gold 2000-Present: Kitco

If I decide to invest in gold stocks instead of the bullion, how many different stocks should I buy?

One of the primary tenets of sound investing is to always diversify.   Although selected gold stocks have vastly outperformed the price movement in bullion, many have not and some have dramatically underperformed.   Evaluating the prospects of an individual gold mining company is difficult, even for the experts.  An investor choosing to allocate a large percent of assets into gold stocks is probably better off (from a risk standpoint) investing in a well managed gold fund with a solid long term track record.  For an investor that does not want to hold physical gold nor own individual gold stocks, investment in a gold ETF such as GLD, that tracks the price movement of the bullion, would be an option.

I don’t trust paper assets and want to hold only gold bullion – what are my options?

For a conservative, risk averse investor looking to protect the value of his money,  investing only in gold bullion is a sound strategy.  Holding actual bullion, however raises security questions on how and where to store the physical gold.  Investors who wish to have their gold stored on their behalf can chose from a variety of firms that securely store gold in protected and insured vaults.  For an investor storing gold on his own in a safe deposit box, it would perhaps be wise to diversify storage geographically by using more than one bank.

Is the tax treatment different for gold bullion versus gold stocks?

The IRS considers gold to be a collectible.  Gains on gold bullion or coins and ETF’s backed by physical gold and held for more than a year have a maximum tax rate of 28%, while positions sold in less than a year are taxed at ordinary income rates.   Gold stocks are considered capital assets by the IRS and standard capital gain tax rates apply to profits.

As nations compete with each other to devalue their currencies and the Federal Reserve engages in outright money printing, gold investors should be expecting substantial profits regardless of what investment vehicle is chosen.

Gold, Silver, Platinum, Palladium 2010 Second Quarter Performance

Although gold and silver are experiencing a sharp decline today, they recorded strong performance during the second quarter of 2010. Platinum and palladium both posted declines for second quarter, but maintain gains for the year to date.
The table below shows the last London Fix Price of 2009 for each metal and the last price for June 30, 2010 followed by the percentage gain or loss for the 2010 Second Quarter and the Year to Date performance.

2009 Close June 30, 2010 Close 2nd Quarter YTD
Gold $ 1,087.50 $ 1,244.00 11.52% 14.39%
Silver $ 16.99 $ 18.74 7.09% 10.30%
Platinum $ 1,461.00 $ 1,532.00 -6.87% 4.86%
Palladium $ 393.00 $ 446.00 -6.89% 13.49%

Gold recorded the largest gain for the most recent quarter with an increase of 11.52%. It is also showing the strong performance out of the four metals for the year to date, up 14.39%. During 2009, the other three metals had outperformed gold by wide margins.

Silver posted a gain of 7.09% for the quarter and is up 10.30% for the year to date. Notably, silver has now posted a gain for the past six consecutive quarters. This represents the longest quarterly winning streak which took place through the beginning of 1980 when silver had eleven consecutive quarters of gains.

Platinum and palladium showed declines of 6.87% and 6.89% for the quarter. Year to date numbers remain positive at 4.86% and 13.49%.

US Mint Gold and Silver Bullion Sales Highest in More Than a Decade

During May 2010, the United States Mint’s gold and silver bullion sales levels reached their highest level in a decade or more for the two most popular offerings. This heavy demand for physical gold was experienced by several world mints last month, driven by concerns and uncertainty about Greece and the Euro.
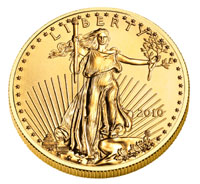
The United States Mint sold 190,000 of their 1 oz. American Gold Eagle coins. This ranked as the highest monthly sales total for the bullion option since January 1999 when 208,500 coins were sold. The all time record high for sales in a single month took place in October 1986 when 609,500 of the one ounce coins were sold.

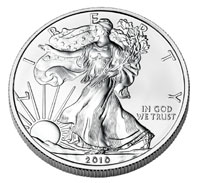
There were 3,636,500 of the 1 oz. American Silver Eagle coins sold during May 2010. This was just shy of the all time monthly sales record of 3,696,000 coins sold in December 1986. The month of May ended with a three day weekend, if one more day of sales had taken place, the record may have been broken. It’s worth noting that Silver Eagle bullion coins are also subject to the US Mint’s allocation (rationing) program, meaning these impressive sales still do not reflect full public demand.

Recent articles report similar surges in bullion coin demand. Production of Gold Krugerrands by the Rand Refinery reached their highest weekly production levels in 25 years. The treasurer of the refinery cited Germany as a large source of demand. The Perth Mint of Australia which did not provide production levels, has doubled their capacity over the past 18 months. As soon as the European Commission announced that they would bail out Greece their stock of gold “all went.”

2010 First Quarter Gold Demand

The World Gold Council has released Gold Demand Trends for the First Quarter of 2010. The report indicates a drop in gold demand for the covered period, but suggests that demand will be strong for the rest of the year.

Identifiable gold demand during the first quarter of 2010 was 760.2 tonnes, representing a drop of 25% compared to levels seen for the first quarter of 2009. The change was driven by a 69% decline in investment demand, offset by a 43% increase in jewelry demand and 31% increase in demand from industrial sectors.

The drop in investment demand was driven by a sharp decline in demand from ETFs and similar products. Total demand was only 3.8 tonnes for the quarter compared to 465.1 tonnes for the year ago period. Comparisons are also influenced by an unusually strong year ago period.

Investment demand did pick up right after the close of the first quarter, when concerns about Greece and debt contagion fears led to a significant pick up in demand for physical gold. In a previous post, I explored how physical gold demand had surged compared to the muted levels of the first quarter. More significantly, there has also been a resurgence in demand from the GLD ETF in the past month.

In their forecast for strong demand for the remainder of 2010, the WGC cites jewelry demand in India and China, as well as investment demand for the United States and Europe as the drivers.

Demand for Physical Gold Surging

There have been numerous recent reports about the surging demand for physical gold. It has been mostly concentrated in Europe, but there have also been signs of new waves of demand hitting the U.S.

This is a big shift from earlier this year. For the first two months of 2010, the Austrian Mint had reported that Gold Philharmonic sales had dropped 80% from the year ago levels. Similarly, the Royal British Mint had reported a drop in demand of about 50% through the end of the first quarter.

What a difference a crisis makes.

Recently, the Austrian Mint reported that they had sold more coins in two weeks than the entire first quarter, citing demand “exclusively from Europe.” Swiss refiner Argor-Heraeus has estimated that demand for small gold bars and refined products has jumped tenfold compared to the start of the year.

On the US front, sales have strengthened in recent weeks, but there hasn’t been the surging demand seen in 2008, which prompted repeated suspensions and bullion rationing programs.

For the month to date, the US Mint has sold 81,000 of their one ounce Gold Eagle bullion coins. This already tops the prior month total of 60,500. One ounce Silver Eagle bullion coins have sold 2,381,000 coins for the month to date, nearing last months total of 2,507,500. The newly released one ounce 24 karat Gold Buffalo has sold 54,000 coins for the month. The coins debuted on April 29, 2010, making prior month comparisons less meaningful.