March 28, 2024

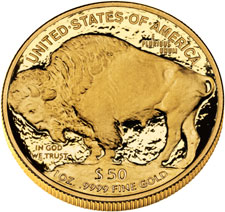
2010 Proof Gold Buffalo and 2010 Fractional Gold Eagles

Closely behind the release of the 2010 Gold Buffalo bullion coins, the United States Mint has two more gold products on the way. This includes the collectible proof version of the Gold Buffalo and fractional weight American Gold Eagles.

The 2010 Proof Gold Buffalo is now scheduled for release on June 3, 2010. Since this is a collector coin, it will be available for sale directly from the US Mint via their website. Each coin will contain one ounce of 24 karat gold and feature the design from James Earle Fraser’s Buffalo Nickel. Pricing for the coins won’t be known until the week of release, since it will be based on the average weekly price of gold. At the current gold price, the coins would be $1,510.

Last year, the 2009 Proof Gold Buffalo wasn’t available for sale until October 29, 2009, amidst delays and cancellations across many of the US Mint’s precious metals products. The coins remained available for sale until March 29, 2010 and sold 49,388 coins.

The US Mint has reportedly begun production of the fractional weight versions of the 2010 American Gold Eagle bullion coins. I’ve always felt that these smaller weight coins were an important part of the bullion program, as they allow for different investment levels. The US Mint has historically offered one-half ounce, one-quarter ounce, and one-tenth ounce size coins.

A release date for these coins has not been established. Once available, they will be sold via the US Mint’s network of authorized purchasers, like other bullion offerings.
US Mint Adjusts First Spouse Gold Coin Maximum Mintages

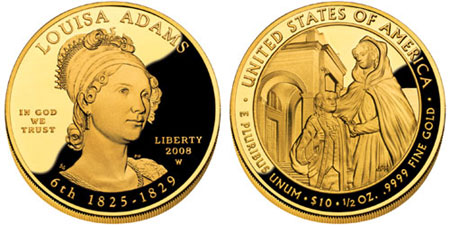
The United States Mint recently lowered the maximum mintages for their First Spouse Gold Coins. This series of gold coins features the spouses of each President with the coins struck in one-half ounce of 24 karat gold.

For the first three years of the series, each coin carried a maximum mintage of 40,000 coins. For 2010, three of the coins will have the maximum set at 15,000, and the Mary Todd Lincoln Coin, which is expected to be more popular, has the mintage set at 20,000.

The lowered maximum levels is somewhat of an admission that the popularity of the series has fizzled. After the first three coins of the series sold out in one day, buyers moved on as secondary market prices for the sold out coins peaked and declined. Recent issues have been selling less than 10,000 coins per issue.

Under law, the First Spouse Gold Coins are actually bullion coins. However, since the beginning of the series, the US Mint has sold them in the same way that they sell numismatic products. (Other bullion coins are distributed through the US Mint’s network of authorized dealers at small mark ups to the spot price of gold. Numismatic products are sold directly by the US Mint at much higher premiums.)

The First Spouse Gold Coins are currently priced at $729.00 for the proof versions and $716.00 for the uncirculated versions. The price of the uncirculated coins represents a premium of about $162.00 above gold value or 14.6%. These amounts fluctuate with the price of gold and adjustments to the prices of the coins.

Some of the prior releases have held onto these premiums (or have risen in price). The low mintages have added to numismatic premium to the coins which some collectors are willing to pay for.


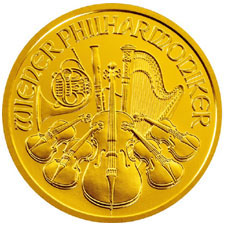
Gold Philharmonic Sales Drop 80%

Recent reports indicate that sales of gold bullion coins from the Austrian Mint have dropped a shocking 80% from year ago levels. The Austrian Mint produces the Gold Philharmonic, which has for some quarters been the world’s best selling gold bullion coin.

According to the article, the Marketing Director of the Austrian Mint indicating that they had returned to “business as usual” rather than “hectic, panic demand” experienced over the past few years.

Gold Philharmonic sales fell to 53,930 ounces for January and February 2010 compared to 267,091 ounces for the same period in the prior year.

For comparison, I checked the sales figures for the American Gold Eagle bullion coins, which I follow more closely. According to the US Mint provided figures, there were sales of 169,000 ounces of gold in January and February 2010, compared to 205,500. While this does represent a drop of about 18%, its not of the magnitude shown at the Austrian Mint.

While demand for physical gold does seem to have pulled back from the extreme levels of recent years, the magnitude is not as huge as suggested by the Gold Philharmonic numbers.


Measuring Declines from the High- Gold, Silver, Platinum, Palladium

For the past few weeks, precious metals have undergone significant, rapid declines. This follows a year of banner performance during 2009. I wanted to take a post to briefly examine the extent of the declines for gold, silver, platinum, and palladium.
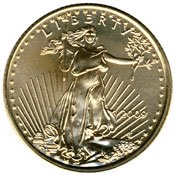
Roughly two months ago, gold had reached a new all time high and silver had reached its highest level going back about twenty months. Less than three weeks ago, platinum and palladium had reached their highest levels in about sixteen months.

The figures below show the recent high compared to the recent low and the extent of the decline. All figures are London PM Fix.

Gold

Recent High: $1,212.50 (December 2, 2009)
Recent Low: $1,058.00 (February 5, 2010)
Decline: -$154.50 (-12.74%)

Silver

Recent High: $19.18 (December 2, 2009)
Recent Low: $15.14 (February 8, 2010)
Decline: -$4.04 (-21.06%)

Platinum

Recent High: $1,627.00 (January 20, 2010)
Recent Low: $1,475.00 (February 5, 2010)
Decline: -$152.00 (-9.34%)

Palladium

Recent High: $462.00 (January 21, 2010)
Recent Low: $395.00 (February 5, 2010)
Decline: -$67.00 (-14.50%)

2009 Precious Metals Performance: Gold, Silver, Platinum, Palladium

Precious metals delivered a strong performance during 2009 with strong returns across the major categories of gold, silver, platinum, and palladium. Although gold seemed to dominate the attention of the mainstream press, the annual performance figures reveal that it was outperformed by other precious metals.

The table below displays the last price of 2008 from Kitco’s historical charts and the last price of 2009. The change and percentage change are computed below.

2009 Precious Metals Performance

Gold Silver Platinum Palladium
Last 2008 Price 869.75 10.79 898.00 183.00
Last 2009 Price 1,087.50 16.99 1,461.00 393.00
Change 217.75 6.20 563.00 210.00
Percentage Change 25.04% 57.46% 62.69% 114.75%

As seen above the surprising winner for the year was palladium, which delivered a return of 114.75%. This was followed by platinum with 62,69%, silver with a gain of 57.46%, and lastly gold with a gain of 25.04% recorded.

In some respects the out performance of palladium, platinum, and silver are simply making up for ground that was lost during 2008 (2008 Precious Metals Performance). Last year palladium had fallen by nearly 50%, platinum by about 40%, and silver by 26%. During the same period, gold recorded a small gain of 4.32%.

One of the recent characteristics of gold has been its steady upward march, defying panics in other asset classes, and general declines in commodities. This year marks gold’s ninth annual gain, which has brought the price of gold 291% higher from the end of 2000 until the end of 2009.

Fractional Gold Eagles Make Brief Appearance

During December, the United States Mint briefly offered 2009 American Gold Eagle bullion coins in fractional weights. This included one-half ounce coins, one-quarter ounce coins, and one-tenth ounce coins.

This was the first time that the US Mint had offered anything other one ounce gold bullion coins for more than a year. Back in October 2008, the Mint had announced that production of fractional weight coins would be halted following the depletion of the remaining blank supplies. A few months later they announced that the release of 2009-dated fractional weight bullion coins would be delayed citing the “very limited” supply of blanks. This delay continued until the fractional weight 2009 Gold Eagles were eventually offered to authorized purchasers on December 3, 2009.

An immediate rush of orders, depleted the entire inventory of one-tenth ounce coins and reduced the supplies of one-quarter and one-half ounce coins to limited status. After these remaining coins were sold, a second batch went on sale December 14. These sold out by December 21.

At the conclusion of sales, 270,000 one-tenth ounce coins, 110,000 one-quarter ounce coins, and 110,000 one-half ounce coins had been sold. Last year, sales had been 270,000, 58,000, and 50,000 during the ten months of availability.

The fast and heavy sales for the fractional Gold Eagles shows the pent up demand for such offerings. Lower weight gold bullion coins present an entry point for newer investors and an easier way for existing investors to build up a position in gold over time. This especially holds true with gold priced above $1,000 per ounce.

Back in 1999, when Y2K fears brought gold demand mainstream, there was tremendous demand for fractional weight coins. That year the US Mint recorded sales of 2,765,000 of the one-tenth ounce coins, which was nearly double the 1,511,000 one ounce coins sold.

Lower weight gold coins provide a useful entry level for precious metals investors. These options need to be available throughout the entire year, not for just a few days in December.


US Mint Gold and Silver Bullion Sales July 2009

During the month of July, sales of physical bullion at the United States Mint were somewhat split. In the case of silver, sales as measured by the number of ounces sold reached the second highest level of the year. In the case of gold, sales as measured in ounces marked the second lowest total for the year.
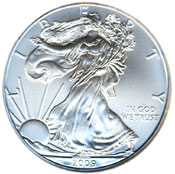
The table below displays the number of ounces of gold bullion sold by the United States Mint during the month of July. As the case has been all year, sales were limited to one ounce American Gold Eagles and one ounce American Silver Eagles. Platinum bullion and fractional gold bullion coins were not offered.

July 2009 US Mint Bullion Sales
1 oz. 1/2 oz. 1/4 oz. 1/10 oz. Total oz. YTD Total oz.
Gold Eagle 86,000 86,000 756,500
Silver Eagle 2,810,000 2,810,000 16,634,500
Platinum Eagle

Sales of the Gold Eagle reached 86,000 ounces. As mentioned, this represented the second lowest monthly sales total this year. The low of 65,000 took place in May. It should be noted that the level of sales still remains above the monthly total reach one year ago in July 2008 when 50,000 ounces were sold. Although the furious pace of gold sales has slowed, it remains historically high.

Sales of 2009 Silver Eagle bullion coins reached 2,810,000, marking the second highest monthly total of the year. The highest level was reached in March when 3,132,000 ounces were sold. This month’s total represents a hefty125% increase over the sales levels from the year ago period. Notably, the number of ounces of silver sold year to date is now approaching the total number of ounces sold during the entire year of 2008, which was 19,583,500. One more month of strong sales would push this year’s total above the mark.

Gold and Silver Eagle Bullion Sales June 2009

The US Mint’s sales of gold and silver bullion coins during June 2009 showed increases from both the prior month and year ago levels. The increases came amidst two interesting developments for the US Mint’s bullion coin programs.

In the middle of the month, the US Mint announced that their long standing rationing programs would be lifted. Authorized purchasers of bullion coins had been limited in the total number of coins that they could order. This had been cited by many as a sign of the high physical demand for precious metals which would eventually drive prices higher.

Later in the month, the US Mint made the seemingly contradictory announcement that the American Gold Buffalo bullion coin offering would be canceled for 2009. This had been the US Mint’s 24 karat gold bullion coin, launched in 2006 as a way of competing with other world mints that produced gold coins with greater fineness than the 22 karat Gold Eagle.

Here’s a look at the US Mint’s gold, silver, and platinum bullion sales during the month of June 2009. A year to date total appears in the last column.

June 2009 US Mint Bullion Sales
1 oz. 1/2 oz. 1/4 oz. 1/10 oz. Total oz. YTD Total oz.
Gold Eagle 116,000 116,000 670,000
Silver Eagle 2,245,000 2,245,000 13,824,500
Platinum Eagle

Sales of the Gold Eagle were still confined to only the one ounce bullion coin. A total of 116,000 ounces were sold, which was close to double the prior month’s sales of 65,000 ounces. This also marks a huge increase from the year ago period when only 15,500 ounces of gold were sold. It’s interesting to note that the sales increase comes amidst a down month for gold. Physical gold buyers have tended to increase purchases during period of price decline and curtail purchases during periods of price appreciation.

Sales of the Silver Eagle reached 2,245,000 ounces. This was an increase from the prior month when 1,904,500 ounces were sold and an increase from the year ago period when 1,735,500. With the year now half completed, the American Silver Eagle remains on pace to exceed last year’s record sales of 19,583,500 ounces.

Once again, the US Mint did not offer the Platinum Eagle bullion coin in any size.

Gold, Silver & Platinum 2009 Second Quarter Performance

With the second quarter behind us, let’s take a look at the performance of gold, silver, and platinum for the second quarter of 2009 and year to date.

All of the metals posted gains, but at single digit levels. The best performer for the second quarter was silver with a gain of 6.33%, followed by platinum with a gain of 5.52%, and then gold with a gain of 1.96%. The closing numbers don’t tell the full story. At the beginning of June, precious metals prices had spiked. At this recent peak, silver had been up as much as 22% for the quarter. Platinum and gold were also showing heftier gains at this time.

2009 Second Quarter Gold, Silver, and Platinum Performance
31-Mar-09 30-Jun-09 Change Percent
Gold 916.5 934.50 18.00 1.96%
Silver 13.11 13.94 0.83 6.33%
Platinum 1,124.00 1186.00 62.00 5.52%

On a year to date basis, the top precious metal performer remains as platinum with a gain of 32.07% on the year. This is followed by silver with a gain of 29.19% and gold with a gain of 7.44%. The performance of the metals had lined up in the same manner at the close of the first quarter.

2009 YTD Gold, Silver, and Platinum Performance
30-Dec-08 30-Jun-09 Change Percent
Gold 869.75 934.50 64.75 7.44%
Silver 10.79 13.94 3.15 29.19%
Platinum 898.00 1186.00 288 32.07%

US Mint Gold and Silver Bullion Sales Through May 2009

As in the past, I wanted to write another post examining the US Mint’s monthly gold, silver, and platinum bullion coin sales. Previously these figures were a flawed method of examining demand for physical precious metals due to the rationing program in place from the United States Mint. As long as authorized purchasers of US Mint bullion coins were restricted in the quantities they could purchase, it was difficult to ascertain how much unmet demand existed behind the rationing wall.

However, this month the figures might be closer to providing a useful measure. As I mentioned in several posts this month, a likely combination of decreasing demand and increasing supply has turned the Gold and Silver Eagle shortage to a surplus. For the first time since the rationing programs began, authorized purchasers did not purchase the maximum number of coins allotted by the US Mint.

Here’s a look at the US Mint gold, silver, and platinum bullion sales for the month of May 2009, along with a year to date total in the final column.

April 2009 US Mint Bullion Sales
1 oz. 1/2 oz. 1/4 oz. 1/10 oz. Total oz. YTD Total oz.
Gold Eagle 65,000 65,000 554,500
Gold Buffalo
Silver Eagle 1,904,500 1,904,500 11,579,500
Platinum Eagle

There were sales of 65,000 ounces of gold during May 2009. Once again this consisted entirely of one ounce 2009 Gold Eagles, as the US Mint did not offer fractional coins or the 24 karat Gold Buffalo. This was a big drop from the prior month when 147,500 ounces were sold, however it is more than double the number of coins sold in the year ago period of May 2008 when 31,500 ounces were sold.

There were sales of 1,904,500 ounces of silver during May 2009. This was a decline from the prior month when 2,518,000 ounces were sold and a decline, but still up from the year ago period of May 2008 when 1,516,000 ounces were sold. Sales of silver bullion still remain on pace for a record breaking year. The current record was set during 2008 when 19,583,500 ounces were sold for the entire year.

Platinum bullion coins were still not offered for sale by the US Mint. No platinum bullion coins have been offered since November 2008. The US Mint has not provided any additional statements on the status of platinum bullion coins. Notably, the Royal Canadian Mint has been able to produce and sell their Platinum Maple Leaf coins during 2008.

Based on the figures for the gold and silver bullion sales, demand for physical precious metals is apparently dropping significantly at a time when the market prices of the metals seemed to be gaining some momentum. This could be a seasonal impact since prior sales figures show the sales trailing off during the summer months. Or it could be a signal that some buyers are taking pause to see if the much ballyhooed “green shots” actually take root or whither up and die.

Disclosure: Long physical gold and silver