April 26, 2024

Are Gold Investors Nuts?

How many of the countries best financial advisors are telling their customers to invest in gold?  Despite the fact that gold has gone up for the past eleven years, a Barron’s survey shows that gold remains distinctly out of favor by mainstream investment advisors.

Barron’s interviewed 51 of the countries most successful investment advisors from each of the fifty states plus the District of Columbia.  Although investment returns were not disclosed, Barron’s selected the best investment pros based on the amount of assets managed, revenues generated, gain in the number of clients and the quality of their practices.

The 51 pros selected by Barron’s are the best in the business, work hard, serve wealthy sophisticated clients and manage hundreds of billions of dollars of wealth.  According to the survey, the most common investment strategy of the top financial advisors was to generate income flows and potential capital gains by owing high quality blue chip stocks.  Most of the advisors were optimistic, predicting that dividend paying stocks would outperform government securities on which yields have plunged to all time lows.

Of the 51 advisors interviewed, only two specifically recommended a small portfolio allocation into gold.  The investment advisor from Iowa recommended that clients make “sure 3% to 5% of their portfolios are in gold” and the investment pro from Nebraska suggested a 10% position in gold mining stocks.

The number of investment pros recommending gold was surprising low, especially after considering the potential for another financial meltdown precipitated by sovereign debt crises, rampant money printing by central banks and towering levels of debt that threaten to crush the world economy.

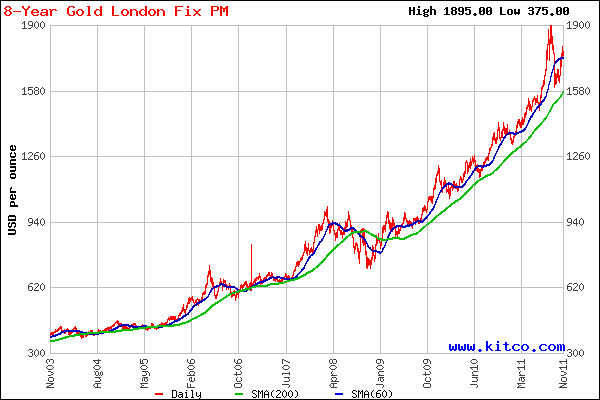
Gold - courtesy kitco.com

Gold has proven to be a vehicle for wealth preservation over thousands of years and is insurance against financial disaster.  Has the increase in gold since 2000 already fully discounted the worst possible economic and financial scenarios?

Barron’s smart money pros apparently think that gold’s run is over.  Are gold investors nuts to argue with the world’s best money managers, especially after an almost 7 fold increase in the price of gold since 2000?  What do you think?

More on this topic: Gold Bull Market Could Last Another 20 Years With $12,000 Price Target

Investor Gold Demand Hits All Time Record – China and India Grab 61% Of Total Gold Mine Production

Investor demand for gold during 2011 hit an all time high, fueled by soaring demand in China and India.  Total gold demand by China and India during 2011 amounted to a staggering 61% of all gold mine production last year.

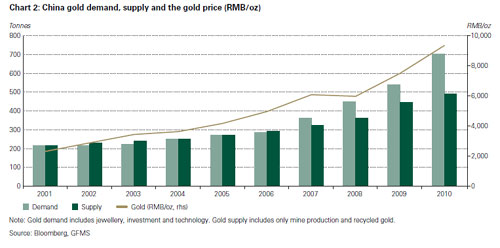
The 2011 Gold Demand Trends report issued by the World Gold Council show a huge increase in gold demand and a small increase in global gold mine production.  This continues a trend that has been in place since 2001.  Despite an almost 600% increase in the price of gold since 2001, global gold mine production has increased by only 7.7%.

Typically, a large increase in price will bring forth additional supplies as producers rush to take advantage of higher prices.   This has not happened with gold due to the depletion of existing gold reserves and the inability of miners to discover and develop new gold deposits.  The continuing increase in gold demand and the lack of new supply will eventually result in gold prices higher than most people can imagine today.

Highlights of the Gold Demand Trends report are summarized below.

  1. For the first time ever, on a dollar basis, gold demand hit all time record highs at $205.5 billion, representing 4,067.1 tonnes of gold.
  2. Investor demand for gold hit all time record of 1,640.7 tonnes, up 5% from the previous year.
  3. Demand for gold by China soared 20% last year to 769.8 tonnes and demand by India, despite currency weakness, was 933.4 tonnes.  It is expected that China will become the largest gold market in the world during 2012 based on continued record setting demand.
  4. Global gold production increased by only 4% last year to 2,809.5 tonnes.  The combined gold demand of 1,703.2 tonnes by China and India consumed 60.6% of all new gold mine production.  It is projected that the supply of new gold will remained “restrained” for the foreseeable future.
  5. The desire to protect wealth accounted for surging gold demand in Europe as the European Central Bank engages in a massive money printing campaign to prop up the insolvent banking system.
  6. Central banks continued to buy gold during 2011, increasing total purchases to 440 tonnes, up by 77 tonnes from last year.
  7. The amount of gold available to meet demand is being restrained not only by low mine production but also by reduced supplies of gold from recycling.   Despite a 28% increase in gold prices last year, the supply of recycled gold declined by 2% to 1,611.9 tonnes.  According to the Gold Council, this implies that “market supplies are drying up and that consumers may be holding on to their gold in the expectation of higher prices.”
  8. Investors are showing a strong preference for physical gold as seen by the investment flows into bar and coin compared to ETF demand.   Demand for gold bar and coin during 2011 totaled 1,486.7 tonnes compared to ETF demand of only 154.0 tonnes.
  9. Gold demand by ETFs increased in the 2011 fourth quarter over the comparable period last year, but total demand during 2011 of 154.0 tonnes was far below ETF gold demand of 367.7 tonnes during 2010.

The Gold Council bullishly notes that the gold market is unique in that it is driven by a “diverse set of factors” and multiple sources of demand.

Gold Bullion Coin Sales Plunge 63% In November and 20% YTD – Have Americans Given Up On Gold?

Total sales of American Gold Eagle bullion coins plunged in November according to production figures from the U.S. Mint.

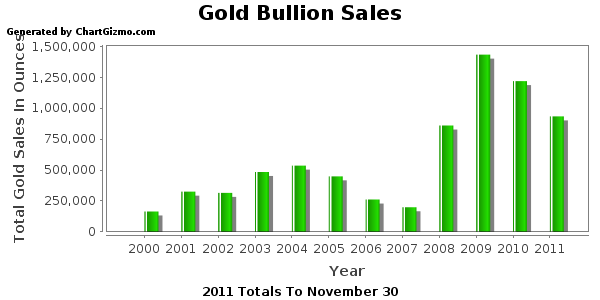
Total sales of gold U.S. Mint bullion coins declined by 63.4% in November from the previous year.  Sales of U.S. Mint gold bullion coins declined by 19.5% on a year to date basis through the end of November.  A total of 41,000 ounces were sold in November 2011 compared to sales of 112,000 ounces in November 2010.  Year to date sales through November totaled 934,500 ounces compared to the previous year to date totals of 1,160,500 ounces.

The reduction in the purchase of U.S. Mint gold bullion coins continues a trend of reduced sales since the record breaking year of 2009 when a total of 1,435,000 ounces were sold.  Total gold bullion sales  for 2011 will probably slip below one million ounces for the first time since 2009.  If sales decline in December by the same percentage amount as in November, total 2011 sales of gold bullion coins will come in at 956,500 ounces.

A summary of gold mint bullion coin sales since 2000 is shown below.

Gold Bullion Sales Since 2000

Gold Bullion U.S. Mint Sales Since 2000
Year Total Ounces Sold
2000 164,500
2001 325,000
2002 315,000
2003 484,500
2004 536,000
2005 449,000
2006 261,000
2007 198,500
2008 860,500
2009 1,435,000
2010 1,220,500
2011 934,500
Total 7,184,000

Why would gold bullion coin sales be plunging when gold has been steadily rising?  Have Americans given up on gold?  Let’s look at various trends in gold sales to get some perspective.

-Annual sales of gold bullion exceeded a half million ounces only once before 2008.  The financial crash of 2008 precipitated concerns about the integrity of both the banking system and the U.S. dollar, causing a huge increase in demand for physical gold.  Gold bullion sales exploded higher in 2008 and sales for 2011 remain far above levels seen prior to 2008 despite the recent drop in sales.

-Based on the current price of gold, the total value of all gold bullion purchased from the U.S. Mint since 2000 is $12.6 billion.  This amount represents only a fraction of the amount of investment dollars that have flowed into gold over the past decade.  In addition to purchasing physical gold, investors now have the option to purchase gold through gold trust ETFs.  The amount of money poured into the gold trust ETFs is many multitudes greater than the investment in physical gold bullion coins.  For example, since their inception in 2005, the combined gold holdings of the SPDR Gold Shares Trust (GLD) and the iShares Gold Trust (IAU) have grown to 47.2 million ounces valued at $82.5 billion.

-Gold ETFs have grown exponentially from their inception a short six years ago but the largest gold ETF, the SPDR Gold Shares Trust (GLD), has not been able to exceed its record gold holdings of 1,320.47 tonnes reached on June 29, 2010.  In addition, billionaire John Paulson recently liquidated a substantial portion of his GLD holdings, although much of the selling may have been forced due to severe losses in his hedge funds.

-Gold trader sentiment is either bullish or bearish, depending on who you talk to.

-Central banks, which have been increasing their purchases of gold since 2000, have sharply accelerated their purchases of gold bullion over the past several years.  Central banks from Asia and Latin America have accounted for most of the increased purchases.

-According to the World Gold Council, global gold investment demand increased by 33% in the 2011 third quarter compared to the prior year.  Investment demand for gold bars and coins increased by 29% and global gold holdings by gold trust ETFs increased by almost 78 tonnes.  Demand for gold increased notably during the third quarter in Europe and China.

While it is indisputable that global gold demand has increased, the appetite for gold by U.S. investors seems to be diminishing.  What do you think?


Gold Demand Soars On Fears Of European Debt Defaults

After a sharp September price correction, gold is on track to hit all time highs.  According to a Bloomberg survey, 80% of the forecasters with the most accurate track records are predicting that gold will reach $1,950 by the end of the first quarter.   Investors world wide are fleeing paper currencies as the threat of debt defaults spread across Europe.

Ironically, central bank attempts to stimulate debt burdened economies by lowering interest rates to zero has contributed to the worldwide rush to gold.  Why would investors hold return free government debt with the added risk of principal loss?

As financial turmoil spreads across the globe, gold traders are the most bullish since 2004.

Gold traders and analysts are the most bullish in at least seven years as investors accumulate metal at the fastest pace since August to protect their wealth from a widening European debt crisis.

Gold exceeded $1,800 an ounce for the first time in seven weeks on Nov. 8 and hedge funds are holding their biggest bet on higher prices since mid-September, Commodity Futures Trading Commission data show. The metal is rebounding after tumbling as much as 20 percent in three weeks in September on demand for what are perceived as the safest assets. Almost $9 trillion was wiped off the value of global equities since May and yields on Italian and Greek bonds rose to euro-era records this week.

“Throughout history gold has protected people from the sort of turmoil that we’re seeing,” said Mark O’Byrne, the Dublin-based executive director of GoldCore Ltd., a brokerage that sells everything from quarter-ounce British Sovereigns to 400-ounce bars. It’s “an important thing to own when there is this sort of volatility in stock markets and concern about currency devaluations.”

Gold climbed 24 percent to $1,766.72 this year, heading for an 11th consecutive annual advance. It’s the second-best performer behind gas oil in the Standard & Poor’s GSCI Index of 24 commodities, which rose 5 percent.

Technical indicators suggest the rally that began in September has further to go. While gold jumped 14 percent since reaching an 11-week low Sept. 26, its 14-day relative-strength index is at 58, below the level of 70 that indicates to some who study technical charts that the metal is poised to drop.


Gold - courtesy kitco.com

As discussed previously in this blog, proclamations by the mainstream press after the September gold price correction that the “gold bubble had burst” constituted a contrarian buy signal for gold and silver.  The September correction was simply another opportunity for long term gold investors to add to positions at bargain prices.

The fundamental reasons for owning gold and silver have not changed and are not likely to anytime soon.


Precious Metals Little Changed On Week While Investors Ponder Government Defaults

Precious metal prices traded in a narrow range this week.  As measured by the closing London Fix Price, gold, platinum and silver declined slightly while palladium gained $16 per ounce.

After the London close, prices of precious metals rose across the board in New York afternoon trading.  Gold closed at $1,514.50 up $19.70, silver at $35.26 up $.12, platinum at $1,775 up $8 and palladium at $739 up $8.   Buying in the precious metals may have been prompted by late day worries over the downgrade of Greek debt by Fitch Ratings as well as concerns over the worsening state of public finances in Spain, Portugal and Italy.

Yields of 25% on short term debt Greek debt imply that the markets are are pricing in a very high probability of default by Greece.  What markets do not seem to have priced in is the contagion risk of Greek default and what impact that would have on investor confidence, world financial markets and the global banking system.

Meanwhile the U.S. debt crisis continues to brew as the debt ceiling limit was reached with no indication of a resolution by Congress.  If the past is any guide, Congress will let the debt bomb/deficit crisis simmer until the last minute when the debt ceiling will be raised yet again under the guise of “future fiscal restraint” and the deficit spending and borrowing will continue as usual.

Ignoring the eroding financial condition of the U.S. today only ensures that the inevitable financial crisis will be more devastating than one might chose to contemplate.  The timing may be uncertain but the outcome is not.

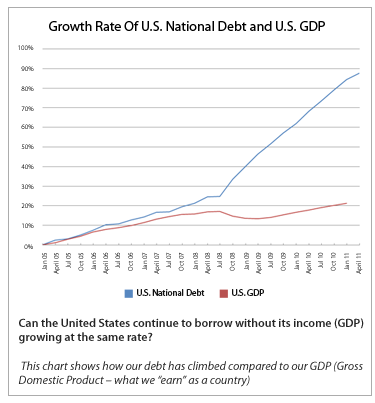
The American Precious Metals Exchange (APMEX) included a chart in one of its latest email newsletters that depicts the gap between the growth of  U.S. GDP and debt.  The chart graphically illustrates the extent to which the U.S. has been living beyond its means and using trillions in deficit financing to do so.

DEBT VS GDP - COURTESY APMEX

APMEX also notes that  “If there is no resolution (of the budget ceiling) by August 2nd, there could be disastrous ramifications for the U.S. and the global economy. The U.S. will be in default on its promises to pay. The value of the dollar could drop dramatically.”


Precious Metals Prices
PM Fix Since Last Recap
Gold $1,490.75 -15.00 (-1.00%)
Silver $34.80 -1.40(-3.87%)
Platinum $1,767.00 -7.00 (-0.39%)
Palladium $734.00 +16.00 (+2.23%)

Precious metals, silver in particular, have been undergoing corrective price action during May, but the fundamental reasons for owning precious metals grows stronger by the day.   Demand for precious metals remains strong.  The World Gold Council’s latest report shows that global demand for gold increased by 11% in the first quarter, while buying by Chinese investors reached all time highs.  The trend is still your friend in the precious metals markets and price weakness should be viewed as an opportunity to increase long term positions.

Gold Demand Soars As Chinese Buying Surges To Record Levels

According to the World Gold Council, total global demand for gold in the first quarter of 2011 jumped by 11% to 981.3 tonnes.   Gold demand was driven by increased investor purchases, especially in China where surging demand for gold reached record highs.

The World Gold Council foresees increased 2011 gold demand based on fundamental factors that include unrest in the Middle East, the sovereign debt crisis in Europe, global inflationary worries, weakness in the U.S. dollar, concern over a slowing U.S. economy and continued strong physical demand for gold by China and India.  Increased purchases of gold by central banks is also likely to increase to protect reserves against paper currencies issued by over indebted sovereign nations.

The World Gold Council noted that gold hit its eight consecutive record high price during the first quarter of 2011 after a brief pullback in prices early in the year.   Due to higher prices the value of gold purchased during the first quarter rose by almost 40% from $31.4 billion to $43.7 billion.

Investment demand surged by 26% during the first quarter to 310.5 tonnes and represented 31.6% of total first quarter gold demand.  The investment demand category includes physical bars, official coins, medals and ETF products.  Investors showed a strong preference for holding physical gold as bar demand increased by 62%, official bullion coins by 39% and medals by 3%.  Bullion holdings by ETFs declined by 55.9 tonnes during the quarter as investors decided to hold more physical gold due to worries about counterparty and credit risk.  Despite the reduction in first quarter ETF holdings, total global holdings of ETFs amount to 2,100 tonnes valued at approximately $95 billion.

Jewelry demand of 556.9 tonnes accounted for 56.8% of total gold demand during the first quarter.  Total jewelry demand grew by 7% during the first quarter with India and China accounting for 63% of total demand.  China, which has seen explosive demand for gold over the past decade, registered a 21% increase in jewelry sales to 142.9 tonnes.

Technology demand for gold, which includes electronics, industrial and dental use declined slightly to 113.8 tonnes.  Gold demand by the electronics industry remains strong and during 2010, the industry consumed a record 326.8 tonnes.

Despite the surging global demand for gold, supply is not increasing and actually dropped by 39.9 tonnes or 4.4% during the 2011 first quarter compared to last year’s first quarter.  The decline was primarily due to large central bank purchases which the World Gold Council deducts from available supplies.  Central Banks have been rapidly increasing their purchases of gold reserves and during the 2011 first quarter purchased 129 tonnes of gold  which exceeded the total amount purchased during the first nine months of 2010.

Surging gold prices should be a natural incentive for the mining industry to increase production but this has not been the case.  Mine production increased by only 7% to 663.9 tonnes during the first quarter, trailing total demand of 981.3 tonnes.  During 2010 gold mine production provided  62% of total supply with recycled gold accounting for the bulk of other supply.

The big picture in the gold market remains focused on China.  The World Gold Council report notes that “The past 10 years have witnessed exponential growth in China investment demand for gold, which entered a new era with the opening of the Shanghai Gold Exchange.   By the end of 2010, annual gold demand totalled 187.4 tonnes, an increase of 71.1% over the previous year.”

Chinese gold demand has been increasing by 14% per year since 2001 with jewelry accounted for 64% of total demand.  During 2010 gold jewelry demand in China was 451.8 tonnes, up 100% since 2004.  Chinese gold investors are also huge buyers and in the first quarter of this year were the largest buyers in the world of physical bullion coins and bars.

The World Gold Council expects Chinese gold demand to double within less than ten years due to gold demand based on Chinese culture, inflationary fears, buying by the Chinese Central Bank, a desire to diversify wealth holdings, advise from prominent Chinese economists to increase gold reserves, increased institutional demand and increased demand by a growing middle class.

Courtesy World Gold Council


APMEX CEO Says No Bullion Shortage

Despite recent volatility, gold and silver prices continue to push to new highs.  After a brief pullback on earlier this week, silver rebounded strong and once again approaches the $50 level. Gold, which has lagged the price gains in silver, recently rose to a fresh all time high and remains solidly above the $1,500 level.
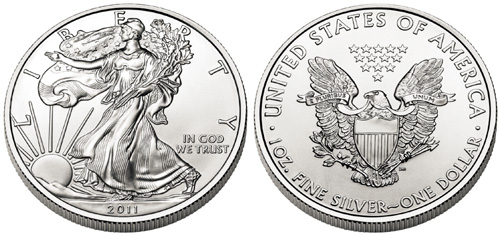
The rapid rise in silver prices has resulted in the Chicago Mercantile Exchange increasing the margin requirements on silver futures for the third time.  The press provided numerous accounts of traders taking huge positions in bearish silver puts.  Silver also faces the psychologically important barrier of $50 per ounce.   During the last great silver bull move of the early 1980’s silver rapidly collapsed from the $50 range and subdued for decades.

Despite the calls for a major correction by silver bears, the metal remains near all time highs and there have been numerous press reports of a physical shortage of silver based on intense investor demand.

Indications of a supply/demand imbalance in the bullion markets can be seen in many areas.   The US Mint has been rationing Silver Eagle bullion coins to its authorized purchasers and earlier this year the Royal Canadian Mint admitted that it was having major problems in sourcing adequate supplies of silver due to high demand.  The spot price of physical silver is trading above the price of futures contracts (known as backwardation) and this is an indication of huge physical demand.  In addition, earlier this week, APMEX, a major precious metals dealer, offered to buy bullion at a generous premium from its customers and cited “incredible demand” for gold and silver bullion products.

Although APMEX says there is no supply/demand imbalance, they recently increased their buy price for some US Mint bullion products. In particular, they are offering $3 over spot silver for one ounce American Silver Eagles. This is higher than the company’s cost of acquisition directly from the United States Mint, which sells the coins at $2 over spot to authorized purchasers.

In order to get a better assessment of the precious metal markets and supply/demand situation in bullion products, Gold and Silver Blog interviewed Michael Haynes, the CEO of American Precious Metals Exchange (APMEX).

When asked about the high prices APMEX is offering for Silver Eagles, Haynes said, “APMEX had not made a general offer to the customer base in quite some time and it seemed logical to remind the customers that APMEX has a need to buy. With respect to prices on Silver Eagles, you rightly describe that APMEX is offering more than the Mint sell price and you also rightly observe that the Mint is allocating product. As previously discussed, APMEX supplements its buying needs from the secondary market. Therefore, APMEX is buying at the bid offered to the customers and as mentioned above, APMEX would rather buy from its customers than a commercial dealer”.

Thus, despite the challenges experienced in other sectors of the market, from APMEX’s perspective they are able to obtain adequate supplies to meet customer demand.   Michael Haynes noted that APMEX is “currently able to buy the products needed to maintain adequate inventories for customers”.

Michael Haynes also provided insights into current customer buying trends.  According to Mr. Haynes, “average order sizes are increasing slightly, but that may be attributed to higher prices of the underlying product.  Recently, the purchases have shifted slightly toward silver”.  There has been no dramatic changes in customer buying patterns related to product size or premium according to Mr. Haynes.

Addressing  the appreciation in precious metals prices, Mr. Haynes noted that “APMEX sales seem to rise in either a rising market or a declining market.  The customers that purchase under those different scenarios are different, in that new customers tend to purchase on increases and mature customers tend to purchase on pullbacks”.

APMEX has apparently met the challenges of meeting surging customer demand for physical bullion products and, in addition, maintains a liquid market for those investors who chose to sell.  Mr. Haynes calls APMEX “one of the great business stories of the internet age”. APMEX was founded by Scott Thomas who has built the company into one of the largest dealers in coins and precious metals based on “a great passion to satisfy customers”.   Mr. Haynes stated that one of his goals is to “reach more of the population with the opportunity to own precious metals”.

How Much Gold and Silver Will the Treasury Secretary Determine is Sufficient to Meet Public Demand?

A bill, which seeks to provide greater Congressional oversight for circulating coin compositions, may have implications for the quantity of United States Mint gold and silver bullion coins that are available to precious metals investors.

The bill H.R. 6162 Coin Modernization, Oversight, and Continuity Act of 2010 primarily establishes rules for the Secretary of the Treasury to provide biennial reports to specified committees on the costs related to circulating coins, and make recommendations for new metallic materials or procedures. A final section of the bill deals with “meeting the demand for gold and silver numismatic items”, although the implications seem to extend to bullion coins.

Following the cancellation of the 2009 Proof Silver Eagles, the United States Mint sought greater flexibility to produce numismatic versions of the coin. The Director of the United States Mint requested such authority be granted to the Secretary of the Treasury at a hearing of the Subcommittee on Domestic Monetary Policy and Technology on July 20, 2010. The chairman of the subcommittee Melvin Watt was the one who introduced the bill H.R. 6162.

The following is Sec. 4 of the bill:

Subsections (e) and (i) of section 5112 of title 31, United States Code are each amended by striking ‘quantities’ and inserting ‘qualities and quantities that the Secretary determines are’.

Here’s how the law authorizing American Silver Eagles currently reads (emphasis added):

(e) Notwithstanding any other provision of law, the Secretary shall mint and issue, in quantities sufficient to meet public demand, coins which— (1) are 40.6 millimeters in diameter and weigh 31.103 grams; (2) contain .999 fine silver; (3) have a design— (A) symbolic of Liberty on the obverse side; and (B) of an eagle on the reverse side…

And here’s now the law would read if the bill H.R. 6162 is enacted (emphasis added):

(e) Notwithstanding any other provision of law, the Secretary shall mint and issue, in quantities and qualities that the Secretary determines are sufficient to meet public demand, coins which— (1) are 40.6 millimeters in diameter and weigh 31.103 grams; (2) contain .999 fine silver; (3) have a design— (A) symbolic of Liberty on the obverse side; and (B) of an eagle on the reverse side…

A similar change occurs for subsection (i), which deals with American Gold Eagles.

The inclusion of the word “qualities” was necessary to accomplish the presumed goal of the legislation to allow the issuance of numismatic versions of the coins, but what about the added phrase “that the Secretary determines are sufficient”?

Is the amount of gold and silver bullion coins that the Secretary determines are sufficient to meet public demand different that than amount which will actually meet public demand?

Even under the strict existing standard, there have been extended periods of time when full public demand was clearly not being met. The sale of Gold and Silver Eagle bullion coins have been completely suspended for brief periods, and rationed for considerably longer periods. Most recently, Gold Eagles were subject to rationing from December 2009 until March 2010, and Silver Eagles were rationed from December 2009 until September 2010.

What will happen if the standard becomes less strict and more indefinite?

US Mint Bullion Programs at the Treasury Secretary’s Discretion

Besides the American Gold and Silver Eagles, no other US Mint bullion programs carry the requirement to be produced in quantities sufficient to meet public demand. The language varies, but each program is effectively left to the discretion of the Secretary of the Treasury.

The 24 karat American Gold Buffalo coins, carry the requirements, “Not later than 6 months after the date of enactment of the Presidential $1 Coin Act of 2005, the Secretary shall commence striking and issuing for sale such number of $50 gold bullion and proof coins as the Secretary may determine to be appropriate, in such quantities, as the Secretary, in the Secretary’s discretion, may prescribe.”

The subsection dealing with American Platinum Eagles reads: “The Secretary may mint and issue platinum bullion coins and proof platinum coins in accordance with such specifications, designs, varieties, quantities, denominations, and inscriptions as the Secretary, in the Secretary’s discretion, may prescribe from time to time.”

And, the recently issued 5 ounce America the Beautiful Silver bullion coins: “The Secretary shall strike and make available for sale such number of bullion coins as the Secretary determines to be appropriate that are exact duplicates of the quarter dollars issued under subsection (t)”

Granted that there is no public demand requirement, but how is the Treasury Secretary doing with these other gold and silver bullion programs?

Inventories of the American Gold Buffalo bullion coins were completely depleted by the end of September 2010. At that point, the US Mint indicated that no further inventory of 2010-dated bullion coins would be made available.

The American Platinum Eagle has not been available in bullion format for more than two years. After final inventories were exhausted in late 2008, the US Mint indicated that the 2009 release would be delayed. The 2009-dated bullion coins were eventually canceled. The US Mint has not provided any information on 2010-dated bullion coins, and none have been issued to date.

The America the Beautiful Silver Bullion Coins went on sale to authorized purchasers today. The supply was so limited that the US Mint urged primary distributors to keep prices reasonable. Market forces took precedence and the bullion coins have been selling for double the silver value, or more.

Conclusion

So what is the difference between “quantities sufficient to meet public demand” and “quantities that the Secretary determines are sufficient to meet public demand”?

In practice, we shall see if this represents a different standard, but at this point the change in wording makes me uncomfortable.  I want the supply of gold and silver bullion coins to be determined by demand in the marketplace, not determined by unspecified criteria established by the Secretary of the Treasury.

As the bill has already been passed in the House and Senate, and only requires the President’s signature to become law, it seems too late to do anything other than brace for the possible repercussions.

2010 Third Quarter Gold Demand

Total identifiable gold demand for the third quarter showed an increase of 12% above year ago levels at 921.8 tonnes. Increases in demand from jewelry consumption, industrial sectors, and net retail investment more than offset a decline in demand from electronically traded funds, according to information published by the World Gold Council.

Compared to the 2010 second quarter, gold demand showed a decline of 10%. This was the result of the exceptionally high levels of investment demand experienced in the previous quarter.

During the third quarter, jewelery demand totaled 529.8 tonnes, representing an increase of 8% from the year ago period. Buyers in key markets such as Indian, China, Russia, and Hong Kong were not deterred by record high prices. The highest growth in demand was experienced in India, with an increase of 36%. With the recent focus of the media on gold investors, it’s interesting to note that more than half of identifiable gold demand comes from the jewelry sector.

Industrial demand for gold was 110.2 tonnes, marking an increase of 13% from the year ago period. Demand was led by electronics, which accounted for 77.9 tonnes and measured a gain of 18%. A decline in demand was experienced from the dentistry sector, with a drop of 7% to 12.2 tonnes.

Identifiable investment demand was up 19% from the year ago period at 281.8 tonnes. However, this did represent a decline of 16% from the previous quarter. The largest increase in demand for this category came from bar hoarding, which increased 44% to 132.4 tonnes. This is an interesting contrast to demand from ETFs which dropped 7% to 38.7 tonnes.

The average price of gold during the quarter was $1,226.75, ranging from a low of $1,157.00 to a high of $1,307.50 per ounce.

Identifiable Gold Demand (Source:GFMS)

2010 Second Quarter Gold Demand

Not surprisingly, gold demand for the second quarter of 2010 was up significantly compared to the year ago period, according to the recently released Gold Demand Trends report from the World Gold Council.

Total identifiable gold demand for the quarter was 1,050.3 tonnes. This represents an increase of 36% over the level for the year ago period and an increase of more than 38% over the level for the first quarter of 2010. Demand was led by increases in identifiable investment (+118%) and industrial demand (+14%), which more than offset a small decrease in jewelry demand (-5%).

Behind the increase in investment demand were the concerns about sovereign debt of European countries. This sparked strong demand in German speaking countries, with demand in Germany increasing by 59% year over year. The U.S. was another source of strong demand with an increase of 32% year over year.

The average gold price for the second quarter was $1,196.74 per ounce, or 30% above the average for the year ago period. During the quarter, gold also reached a fresh all time high in dollar terms when it reached $1,261.00 per ounce on June 28, 2010.

The World Gold Council continues to expect robust demand for gold throughout the remainder of 2010, citing growth in demand from India and China, and increasing global investment demand driven by uncertainty about public debt and the economic recovery.