April 29, 2024

Barclays Sees Gold At $1,500 By Year End

gold buffaloIs there any hope for a recovery in gold and silver prices by year end?

Precious metals analyst Suki Coper discuses the prospects for the gold and silver markets in an interview with Bloomberg Television.

Ms. Coper notes that silver tends to follow the gold market but should show more price weakness relative to gold.  In order for the price of silver to stabilize, the precious metal needs investment support from both the industrial and investment side.   Economic weakness in both China and Europe currently portend weak industrial demand for silver.

Despite the current weakness in both gold and silver, Ms. Coper sees the price of gold approaching $1,500 by the end of the year.

Since the beginning of the year, the price of gold has dropped by $303 per ounce or 18%, to a closing price of $1,378.50 at the close of Tuesday’s trading in London.
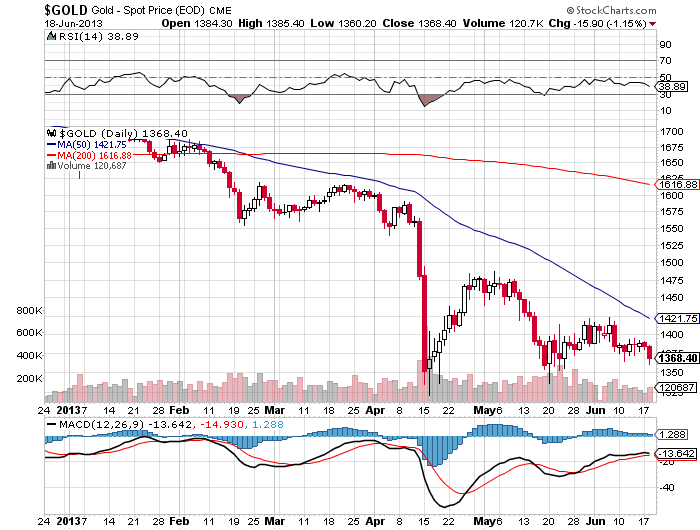
courtesy: kitco.com

courtesy: kitco.com

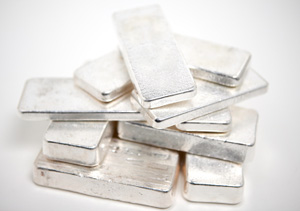
Silver’s price decline has been even steeper than gold with a drop of $9.07 per ounce or 29.4% since the beginning of the year.
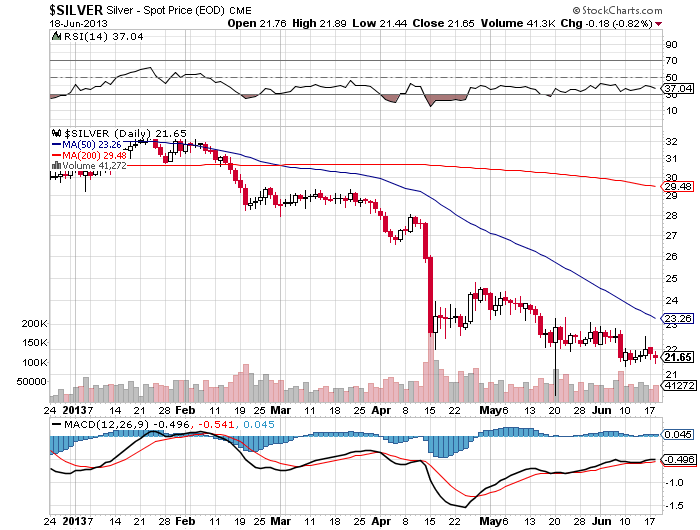
courtesy: kitco.com

courtesy: kitco.com

Will Silver Plunge Below $15 or Rally Back Over $50?

1881-CC-Morgan-DollarBy: GE Christenson

Silver prices peaked in April 2011 and dropped about 60% over the next 25 months. Sentiment by almost any measure is currently terrible. Few are interested in silver; most have lost money (on paper) if they bought in the last two and one half years, and the emotional pain seems considerable. It reminds me of the years after the NASDAQ crash in 2000.

So will silver drop under $15 or rally back above $50?

To help answer that question, I examined the chart of silver for the last 25 years and identified several long-term cycles. Then I constructed a spreadsheet that attempted to model the price of weekly silver based on those cycles and a few assumptions.

Assumptions

  • Use only long-term cycles – a year or longer.
  • The weight assigned to each cycle is approximately proportional to its length. A 200-week cycle should be approximately twice as heavily weighted as a 100-week cycle.
  • This is NOT a trading vehicle but a long-term indication of reasonable price projections based on past relationships. Those past relationships may or may not continue, even if they have been valid for over 20 years.
  • Keep it simple. Do not over-complicate the model or aggressively “curve-fit” it.
  • Prices are assumed to rise more slowly than they fall, so 62% of the cycle is related to the rising portion of the cycle, and 38% of the cycle is related to the falling portion of the cycle.

Data

Low-to-Low cycles: 65 weeks, 72 weeks, and 234 weeks
High-to-High cycles: 102 weeks
Exponential growth: 1/1/1990 – 6/30/2002: no growth – 0.0%/year
6/30/2002 – present: 21% per year, calculated weekly

Process

Find the beginning dates (lows) for the 65, 72, and 234 week cycles, and assign those beginning dates an index value of -1.0. Proportionally increase those index values from -1.0 to +1.0, and then reduce those index values from +1.0 to – 1.0, and repeat for each low-to-low cycle. Use the beginning index value on the 102-week high to high cycle as + 1.0. Extend the proportional increases on all time cycles from -1.0 to + 1.0 so that period takes 62% of the cycle length.

Assign each cycle a weight approximately proportional to the cycle length. Use a beginning value and calculate the exponential increase (0% or 21% per year) for each week, and then add or subtract the percentage changes for each weekly time cycle. Adjust the cycle index weights to obtain the best visual fit on a graph of actual silver prices versus the calculated price of silver.

What Could Go Wrong?

  • The exponential increase might not continue from 2013 forward. I doubt it, but it is possible.
  • The cycles, although relevant for over 20 years, might be less relevant from 2013 forward.
  • The calculated price was “curve-fit” to the actual prices, and that “curve-fit” result might be less accurate from 2013 forward.

Results

Statistical correlation over the last 20 years is about 0.95. The calculated silver price is generally consistent with the actual silver price, even though occasional large variations are clearly evident.

Click on image to enlarge.

Highlights

Calculated low: 2/4/05 at $4.96
Actual low: 5/7/04 at $5.60

Calculated high: 3/17/06 at $13.33
Actual high: 5/12/06 at $14.24

Calculated high: 5/4/07 at $18.13
Actual high: 3/14/08 at $20.66

Calculated low: 12/12/08 at $8.15
Actual low: 10/24/08 at $9.30

Calculated high: 3/2/12 at $42.98
Actual high: 4/29/11 at $48.59

Calculated low: 5/10/13 at $23.32
Actual low: 5/17/13 at $22.25 (actual weekly low, so far)

The Future

This simple model, which uses only four cycles and an exponential increase, indicates that a low in the silver price was expected approximately February – July 2013 and that the next high is expected approximately Mar – October 2014 in the $50 – $60 range. Further, the model suggests that a silver price of $90 – $110 is possible in the September 2015 – March 2016 time period.

Caveats!

There are many. This is not a prediction, it is simply a projection based on the entirely reasonable, but possibly incorrect, assumption that silver prices will continue to rise about 20% per year, on average, and that these four cycles will push actual prices well above and below that exponential growth trend.

Why will silver prices continue to increase? Our current monetary system depends upon an exponentially increasing debt and money supply. It seems likely that the US government will continue to run massive budget deficits and thereby increase total debt. In addition, the central banks of Japan, the EU, and the US will continue to monetize debt and increase the money supply to promote asset inflation and to overwhelm the deflationary forces in their respective economies. Silver supply increases slowly, the demand increases much more rapidly, while each Dollar, Euro, & Yen purchase less, on average, each year. It seems quite reasonable to expect that silver (and gold) prices will increase substantially from their current low level. Read: Silver – A Bipolar Roller Coaster.

Timing

The model was basically correct (over the last decade) on timing and price with some large variations. Clearly there are more factors driving the price of silver than four simple cycles. Those political, emotional, and economic factors will push the price higher or lower, sooner or later, than the model indicates. Regardless, it has some value indicating the approximate price and timing for long-term highs and lows in the price of silver.

Use it while appreciating its limitations. Read: Back To Basics: Gold, Silver, and the Economy.

GE Christenson
aka Deviant Investor

Gold and Silver Investors Need to Ask Themselves 10 Basic Questions

1933-double-eagle1Rick Rule listed 10 key questions regarding today’s economy. They are:

10 Questions for Precious Metals Investors

  • Is the financial crisis in the Western world over?
  • Have the G20 countries balanced their budget?
  • Did the commercial banks manage to become solvent?
  • Are (real) interest rates positive or negative?
  • Is a global competitive devaluation to increase exports still ongoing?
  • Is the European periphery still financially challenged?
  • Do the Asian countries still have a cultural affinity with precious metals?
  • Which are the US budgetary issues and solutions?
  • Are the derivatives from large banks still a problem for economies and client portfolios?
  • Can liquidity solve the issue of insolvency?

If these are the questions, then gold and silver are two good answers.

But, let’s approach these questions from a different direction.

  • Have gold or silver ever defaulted?
  • Do gold or silver have counter-party risk like EVERY paper investment?
  • On January 1, 2000 the Dow was about 11,500, gold was priced at $289, and silver was priced at $5.41. As of May 24, 2013, those numbers were: Dow: 15,303, gold $1,386, silver $22.49. Which was the best investment?
  • Gold fell (in 21 months) from over $1,900 to about $1,320. Does that mean the gold bull market is over? The Dow crashed from 14,100 (October 2007) to about 6,500 (March 2009), and then rallied back to new highs. Don’t exclude the possibility of new highs for gold and silver in the coming months.
  • Why are Chinese businesses, individuals, and their central bank buying gold as rapidly as possible? Why does the Chinese government refuse to allow any gold to be exported? Why does China (world’s largest gold producer) additionally import a massive amount of gold every year?
  • Ask the same for Russia, India, and much of Asia. What do they know about the VALUE of gold that the EU and the USA (who are selling gold) don’t understand?

Further:

  • Gold and silver have gone up and down, when priced in unbacked paper currencies. The same is true for trucks, diamonds, the Dow Index, laundry detergent, gasoline, cigarettes, and wheat. Price increases and volatility will continue.
  • Gold, silver, and the national debt have increased exponentially since Nixon severed the link between the dollar and gold in 1971. All three will continue to rise. Gold and silver will occasionally rally too far and crash, while the national debt will increase until politicians no longer enjoy spending other people’s money.
  • Goldman Sachs (and many others) have said gold is in a bubble. The same individuals and groups probably did not see the bubble in Internet stocks and housing. Do you trust them or the 3,000 years of history during which gold and silver have been real money and a store of value?
  • If JP Morgan (and others) can make huge profits using computers, complex mathematical algorithms, and High-Frequency-Trading, then they will. Often their trading temporarily drives the prices for gold and silver down. After the markets have been driven far enough down, the same trading process is used to drive the prices higher. Expect it!
  • Silver has dropped from about $49 (April 2011) to just above $20 (May 2013) – almost a 60% drop in price. Does that mean it will continue to drop more – perhaps to $10? Silver has retained its value, on average, for 3,000 years but has fallen in price for two years. On the basis of price action in those two years, most individuals (based on sentiment measures) have chosen to trust unbacked paper currencies issued by an insolvent central bank and an insolvent sovereign government instead of silver. This is typical of market bottoms, even if it is not sensible.
  • About 4.5 years ago (October 2008) silver crashed to a price bottom where “everybody felt” like it was hopeless to expect silver to rally again. About 4.5 years before that (May 2004), silver also crashed to a price bottom where “everybody felt” like it was hopeless to expect silver to rally again. But, in fact, the silver rally off the low in 2008 was over 450%, and the rally off the 2004 low was over 175%. Silver will rally again.
  • We may not trust bankers and politicians to effectively run the country, but we can trust them to “print money” and to spend in excess of their revenues. Consequently, we should trust them to drive the prices, as measured in unbacked paper currencies, for gold and silver – MUCH higher.

GE Christenson
aka Deviant Investor

How To Buy Physical Silver With A Zero Chance Of Loss

silver
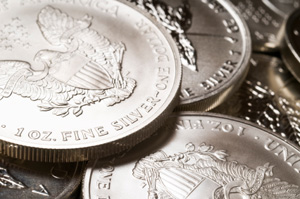
Anything that sound too good to be true, well, you know how that ends.

But there actually is a way to purchase physical silver with a zero chance of loss, courtesy of the Royal Canadian Mint (RCM).

For the first time ever, the RCM is offering a coin with a face value of $100 at a price of $100.  Here are the details courtesy of the mintnewsblog.

Following the success of their “$20 for $20″ silver coin program, the Royal Canadian Mint has launched a new series which uses the same concept for a larger face value.

Orders are now being accepted for the first “$100 for $100″ silver coin, which is the initial release for the Wildlife in Motion series. The RCM indicates this is the first time in history that $100 can buy a coin worth $100.

Buffalo $100 Silver Coin

The reverse of the coin designed by Claudio D’Angelo features three members of a herd of stampeding bison racing across the grassy prairie. The bison are pictured in profile, illustrating the movement and momentum of the massive creatures. The background shows foothills which are backed by a jagged mountain with clouds above. The inscriptions read “Canada 2013″ and the legal tender face value of “$100 Dollars”.

The obverse of the coin features the portrait of Queen Elizabeth II designed by Susanna Blunt.

The 2013 $100 for $100 Bison Silver Coin is struck in 99.99% pure silver with a weight of 31.6 grams (1.016 troy ounces) and diameter of 40 mm. The maximum mintage is limited to 50,000 pieces with a limit of three coins per household.

These coins are available for sale priced at their face value of $100 CAD. The product page can be found here.

This is about as close to a sure thing as you can find in life.  The coin will always have a value of $100. If silver prices increase to $200 per ounce, the coin would be worth about $200 based on the silver content of 1.016 troy ounce.

The Bull Market In Gold Is Dead

Gold coins
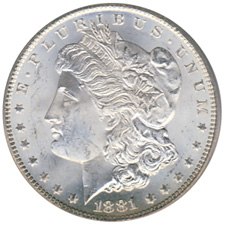
April was a brutal month for precious metal investors.  Gold ended the month down almost 8% and silver prices tumbled almost 13%.   The sell off continued in May with gold down another $60 per ounce to $1,412 and silver down $1.55 to $22.87 per ounce at mid month.
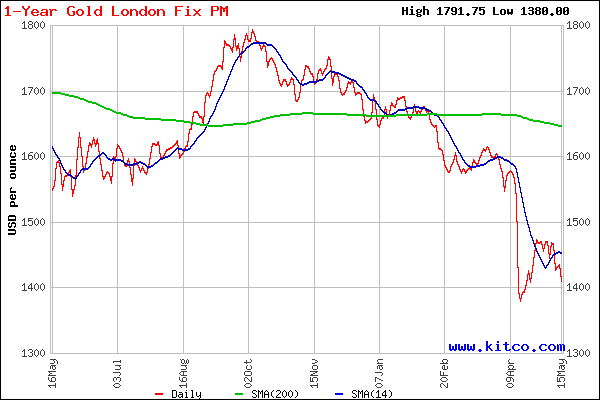
With investors already nervous, two mainstream news organizations today did the equivalent of yelling fire in a theater crowded with gold and silver investors.

Both Bloomberg and The Wall Street Journal published extremely bearish articles on gold which essentially proclaimed the death of the gold bull market.

“Gold is going to get crushed”

Gold will trade at $1,100 an ounce in a year and below $1,000 in five years, according to Ric Deverell, head of commodities research at the bank. Lower prices are unlikely to lure more central-bank buying, said Deverell, who worked at the Reserve Bank of Australia for 10 years before joining Credit Suisse in 2010.

“Gold is going to get crushed,” Deverell told reporters in London today. “The need to buy gold for wealth preservation fell down and the probability of inflation on a one- to three-year horizon is significantly diminished.”

Investors are losing faith in the world’s traditional store of value even as central banks continue to print money on an unprecedented scale. Bullion slumped into the bear market last month after a 12-year bull market that saw prices rise as much as sevenfold. Gold is a “wounded bull,” Credit Suisse said in a Jan. 3 report.

“When gold is going up, it looks like a great idea to buy more gold,” Deverell said. “And when it’s going down, do you really think risk-averse central bankers are going to try and catch the knife? No.”

A surge in demand for bars, coins and jewelry following gold’s drop to a two-year low in April is temporary, Deverell said. The U.S. Mint said April 23 it ran out of its smallest gold coins and Australia’s Perth Mint said volumes jumped to a five-year high. India’s bullion imports may surge 47 percent to 225 tons in the second quarter to meet consumer buying, according to the All India Gems & Jewelery Trade Federation.

“This is bargain-buying,” Deverell said. “It’s like when you have cash for clunkers in autos, you bring forward activity, but it’s not a massive addition to buying.’

Courtesy: kitco.com

Courtesy: kitco.com

“The bears are mauling gold”

The metal fell for a sixth consecutive trading session on Thursday, as investors continue to flee toward assets that promise higher returns.

The characteristics beloved of “gold bugs,” the sizable army of large and small investors who swear by the metal, are precisely what bears are feasting on. Unlike most other assets, gold doesn’t offer a steady return, or yield, and it is often seen as protection against inflation or currency devaluations.

At present, however, global economic growth is sluggish, interest rates in many developed countries are at or near record lows, and investors of all stripes are scrambling to find higher-yielding assets.

“There’s basically no inflation, equities are taking off, and we’ve got a strong dollar,” said Fain Shaffer, president of Infinity Trading Corp. in Medford, Ore. “All of those are just eroding away the investment value of precious metals.” Mr. Shaffer this week recommended his clients bet on lower gold prices.

On Thursday, bears seized on a World Gold Council report showing that total demand for gold fell 13% in the first quarter, to a three-year low of 963 tons in the period.

Other investors are taking the opposite view. John Workman, chief investment strategist with Convergent Wealth Advisors, said the firm late last year recommended that clients trim their gold holdings by about 25%. He cited gold prices that have stagnated despite more stimulus from the Federal Reserve in the form of asset purchases, the same money printing that galvanized gold bugs after the financial crisis. Falling prices were a signal that many investors just weren’t concerned anymore that the stimulus measures would stoke inflation and weaken the dollar.

To sum things up –

  • it no longer matters that central banks everywhere are printing money on an unimaginable scale,
  • the world economy is doing fine and will continue to improve,
  • gold, used as a currency and safe haven for 5,000 years, is inferior to fiat paper currency,
  • returns are better in stocks and bonds,
  • monetary stimulus via central bank asset purchases will propel the world into sustained economic growth,
  • there is no inflation and
  • investors want assets with yields.

Price fluctuations may not make much sense in the short term, but long term precious metal investors know where things are headed – see Why I Will Always Own Gold.

Why I Will Always Own Gold and Silver

What I Know for Certain –  By:  GE Christenson

gold-dollar

      • Death and taxes!
      • Fear and greed are powerful motivators.
      • Individuals, businesses, and governments do what they think is beneficial for them.
      • Businesses and governments protect their products and territory and resist competition and enemies.
      • Concentrated wealth creates power and corruption. The greater the concentration of wealth, the larger and more pervasive the power and corruption.
      • Gold and silver have been money for over 3,000 years.
      • Unbacked paper money systems have always failed.

What I Think is True

      • The basic product of a central bank is the unbacked paper currency it prints in ever-increasing quantities.
      • Central banks will fight all competitors to their currencies. The oldest competitor to unbacked paper currencies is gold, ancient money.
      • Politicians want to spend money and increase their power.
      • Bankers want to create money, lend it to governments, and thereby secure a permanent and increasing revenue stream.

What I Think the Consequences Are

      • Bankers use their wealth to “influence” politicians. Politicians respond with favorable legislation. It has worked for centuries.
      • Central banks want an expanding money supply and ever-increasing debt. The consequence is that consumer prices inevitably increase.
      • A currency collapse is like a bank run – everyone scrambles to remove his/her wealth from the currency (or the bank) due to a loss of confidence. In fractional reserve banking systems, bank runs are inevitable. Even though they may last for many decades, unbacked paper currencies inevitably devalue and eventually collapse.
      • Bank runs and currency collapses are feared by bankers and politicians; they do what they can to support confidence in their products and to squash their competitors.

In the United States

      • Debt and government spending seem likely to increase until a crash-reset occurs.
      • The crash-reset will involve a dollar collapse.
      • Gold and silver will eventually reach much higher prices due to the loss of value and confidence in the dollar, the banking system, and the sustainability of the current financial system.
      • “Paper gold” will be seen for what it is – a promise that might not be paid.
      • Physical gold will be seen for what it is – real wealth.
      • The USA and Europe are sending their real wealth – gold – to China, India, Russia, and the Middle East. China, India, and Russia are buying aggressively and know that exchanging paper dollars and euros for gold will strengthen their economies and governments tomorrow.
      • It is openly speculated that much of the sovereign government and central bank gold supposedly owned by the USA and Europe is either gone, leased, or otherwise committed.

Read: The Crash Before the Climb

Accept what you cannot change and act based on facts, not our current financial and economic fictions. Protect your financial well-being with physical gold and silver safely stored in a secure location.

GE Christenson
aka Deviant Investor

Should Silver Investors Go “All In”?

Silver BarsBy:  GE Christenson

Unfortunately, there is not, that I can see, a simple pattern that predicts the next high or low in the price of silver. Markets seldom make it that easy. However, there are patterns that provide valuable information to help illuminate the “big picture” perspective of where the current price of silver lies in the up-down-up-down cycle of prices.

Process

  • Examine monthly prices since 1972 – over 40 years. Use monthly prices to see only the “big picture” with important lows and highs.
  • List the dates for important lows, and determine the number of months between adjacent lows.
  • Look for simple patterns.
  • Group One Lows: 8/77, 6/82, 5/86, 2/91, 3/95, 8/98, 5/04, 10/08, 4/13. They are separated by the following number of months: 58, 47, 57, 49, 41, 69, 53, 54. (average 53.5)
  • Group Two Lows: 2/93, 7/97, 11/01, and they are separated by 53 and 52 months.

Significant lows are separated by approximately 4.5 years, with rather wide variations. I doubt you can trade this; but, if you are investing for the long term, this indicates that buying aggressively approximately every four to five years should work out fairly well. April 2013 looks like it is at or near a multi-year low.

Big Picture Summary

    • Governments spend in excess of their revenues and create ever-increasing debts.
    • Central banks create the digital to keep the debt machines running, thereby increasing the supply and inevitably increasing prices.
    • Do you remember gasoline at $0.15 along with other goods and services at similarly “unbelievable” prices? Those days disappeared with the huge increase in the number of dollars in circulation, particularly after Nixon severed the link between gold and the dollar in August 1971.
    • Silver prices fall until there are few sellers left, rise until there are few buyers remaining, and repeat the cycle.
    • Each low to high to low cycle takes roughly 4.5 years. At price peaks, the silver bulls are euphoric, while they are depressed and worried at the lows.
  • Ask yourself, “Does now feel like a low or a high in the silver price?”
  • About 4.5 years ago there was an important low in the silver price – October 2008.
  • About 4.5 years before that, there was another important low in the silver price – May 2004.
  • Highs follow lows.

For additional information, read Silver – Keep it Simple! and Silver – A Bipolar Roller Coaster.

GE Christenson
aka Deviant Investor

Gold and Silver Bearish Sentiment Is At Extreme Levels

By:  John Townsend at The TSI Trader.

The usefulness of sentiment’s stealth crystal ball is about to be revealed to the litany of unsuspecting precious metal bears and skeptics who have convinced themselves that gold’s bull market is either over or, at the minimum, in need of lengthy ongoing retesting, restructuring and consolidation.

This article will bring us up to date as to the degree of current bearish sentiment regarding both gold and silver using no fewer than 5 sentiment indicators (with 9 illustrative charts), as well as provide the reader with an opportunity to observe the price outcome of previous bearish extremes using these sentiment indicators.

But first, let’s briefly consider the concept of investor sentiment.

Sentiment extremes, simply put, tell us that there are too many traders at one end of the boat and therefore the boat is about to tip over. Sentiment can strongly suggest that the trade, as some say, has become “crowded”. When someone finally yells “fire” in the “crowded” room there are so many of the market’s participants motivated to get out the same door and in the same direction that most get trampled – unable to reverse their trade fast enough.

Another way of characterizing a sentiment extreme is to say that the trade simply runs out of buyers or sellers, as the case may be. The extreme price momentum in one direction “exhausts” itself of all available ammunition to continue the trend and is sometimes signaled when someone yells “fire” in the “crowded” room, but often comes to a conclusion unrecognized by most traders as price reverses direction in an unassuming manner.

You may have heard comments when a particular market bottoms and then begins to trade higher and then continues to trade even higher yet, despite “bad” news, the assertion that the bullish price movement seems to make no sense – that it cannot possibly be sustained. At this time it appears to nearly everyone the common sense question to ask is how “bad” news that used to cause a market to go into free fall now seems to have absolutely no negative effect? And to observe that as this market continues higher, it always leaves behind those traders stuck in pessimism to declare that the market is “climbing a wall of worry”. That is, the “bad” news continues in the media, yet this particular market’s price reversal continues upwards.

We will begin with the put / call volume ratio of the options trade of the Silver Trust ETF (SLV) and the SPDR Gold Trust (GLD). Charts courtesy of Schaeffer’s Investment Research.

Click on image to enlarge.

The red line in the charts are the ETF’s price movement over the recent 2 years (GLD above, SLV below). The blue line is the put / call volume ratio. This considers the trading day’s volume of puts traded and is divided by the volume of calls traded. Generally, the higher the put / call ratio, the more bearish traders are about the ETF’s likely price movement, while the lower the put / call ratio, the more traders believe the ETF is bullish and going to rally higher.

Click on image to enlarge.

Undoubtedly you have noticed that both charts reveal that the put / call ratio is at the highs of the past two years; meanwhile price is at the lows of the past two years. I will leave it to you to observe the repetitively flip flop relationship between this sentiment indicator and price movement. For me, anyway, this indicator leaves little doubt as to the upcoming direction of GLD and SLV.

Next up is the Hulbert Gold Sentiment Index. This chart courtesy of Mark Hulbert’s Newsletters.

Click on image to enlarge.

This first Hulbert Gold Sentiment Index chart shows us that gold sentiment at present is even more depressed than at gold’s infamous 2008 low.

So there you have it. Sentiment on GLD and SLV options is crazy extreme, Hulbert’s Gold Sentiment Index reveals sentiment is not only more bearish than the 2008 bottom – it’s more bearish than anytime in the past 17 years (at least).

Read complete article here.

Is The Decline In Gold Predicting Deflation?

bernanke's paperBy GE Christenson

We all know that our cost of living in increasing, but how much?

The official government statistics assure us that inflation is running around 2% per year. It reminds me of the line attributed to Groucho Marx, “Who are you going to believe, me or your own eyes?”

But, your cost of living increase – your personal inflation rate – may be much larger or smaller than that of the person next door. Your spending choices matter a great deal in determining your personal inflation rate.

  • I think we can all agree that some items are increasing much faster than others. A few that come to mind are college tuition, medical care, hospital costs, and health insurance. Several that increase more slowly are postage and milk. If you spend more on medical care and health insurance than on postage, your cost of living increase will be much larger than the person who buys more stamps than health care.
  • If the official CPI goes up, then social security payments increase and total government expenses increase. Hence, government has an incentive to want low CPI inflation statistics. The US government has changed the process and the formula several times since the 1980s. The result, of course, is that the official CPI is low. Maybe it is fair, maybe not, but it is the official story, and it helps keep social security payments low.
  • The various statistical measures used to calculate the CPI have been discussed and criticized in detail in many other publications. In the opinion of many people, they don’t reflect economic reality for most people.
  • Other writers disagree and assure us the inflation rate is low.
  • John Williams, a competent economist and statistician, computes the annual inflation rate at about 9%. He uses the statistical calculation process that was used by the government in 1980.
  • Dennis Miller did an inflation rate survey. It was not intended to be statistically robust – just practical. His readers responded with an average inflation rate of 8%, but 23% of the respondents thought their personal rate of inflation was over 11% per year.
  • The Deviant Investor did a similar survey and received a large number of responses. Our readers thought their average inflation rate was nearly 8% per year, while 39% thought it was higher than 9% per year.
  • Rex Nutting thinks it is close to 3% per year and that most of us are “CPI Deniers.” Mainstream media mostly agrees – but I can’t find anyone (in casual conversation) in a grocery store who thinks food prices are only increasing 2 – 3% per year.

I estimate my personal inflation rate at about the average found in the surveys – around 8% per year. I am one of those “CPI Deniers.” Most people I know are “CPI Deniers.”

So How Important is a Few Percent Per Year?

A few percent seems unimportant, but over a decade it becomes very important. Let’s assume in this very simple example that your expenses increase 8% per year, and your income increases 3% per year. In year one your income was much larger than your expenses, and you saved the difference.

Sample Inflation Calculation

Year Income Expenses Net to
Savings
1 80,000 60,000 20,000
2 82,400 64,800 17,600
3 84,872 69,984 14,888
4 87,418 75,583 11,835
5 90,041 81,629 8,411
6 92,742 88,160 4,582
7 95,524 95,212 312
8 98,390 102,829 (4,440)
9 101,342 111,056 (9,714)
10 104,382 119,940 (15,558)

By year 8, in this simple example, the cost increases overwhelmed your income, and you were forced to withdraw from savings. Of course, in the real world, there are more variables and adjustments. We cut back on expenses, increase credit card debt, take a second job, win the lotto, file for bankruptcy – whatever. But the critical point is that your personal inflation rate is important, and a few percent over a decade can make a huge difference.

What to Do?

      • Cut back on expenses.
      • Get out of debt, and stop paying interest.
      • Increase your income.
      • Start a business, or take a second job.
      • Make investments that pay more than the minimal interest provided by savings accounts and certificates of deposit.
      • Invest in real things – gold, silver, diamonds, land, rental property.
      • Invest in “ABCD,” which for David Stockman is “Anything Bernanke Can’t Destroy.” We Have Been Warned!

According to the surveys, real people think their personal inflation rate is around 8% per year with a significant percent of the responders claiming 9 – 11% or more per year. Are you going to believe what the government is telling you or your own experience?

GE Christenson, aka Deviant Investor

US Mint Gold and Silver Bullion Sales Soar In April

ge
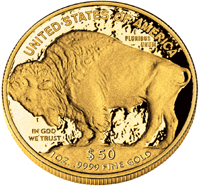
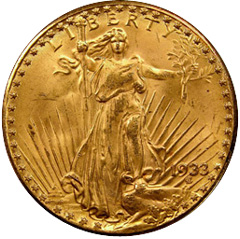
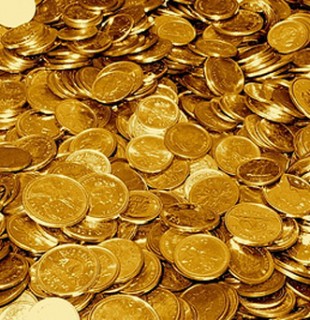
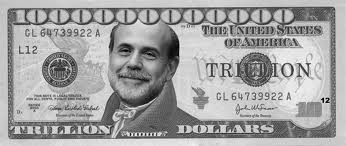
The exploding demand for physical gold and silver has become a worldwide phenomenon.  Shortly after the price plunge of early April buyers rushed in to take advantage of bargain prices.  Dealers and mints worldwide have reported off the charts demand for physical gold and silver.

Intense demand across Asia has resulted in shortages of gold and silver in both India and China as dealers struggle to keep up.  Singapore’s largest supplier of coins and bars reports depleted stocks of silver and long delivery delays.

The surge in physical demand is also rapidly depleting U.S. gold inventories according to Reuters.

Physical gold held at CME Group’s Comex warehouses in New York have dropped to a near-five year low in a further sign that gold’s price crash unleashed a frenzy of demand as investors scramble to buy bars and coins.

U.S. gold stocks, comprised of 100-troy ounce COMEX gold bars, have fallen almost 30 percent since February, as dealers have switched to selling into the burgeoning Asian market, where prices and demand are higher than in New York.

But the pace of the outflows from vaults has accelerated since bullion’s historic sell-off, falling more than 7 percent last week for its biggest weekly drop since 2005.

The latest sales figures from the U.S. Mint for April are further confirmation of  the voracious demand for physical gold and silver.  Sales of both the America Eagle gold and silver bullion coins skyrocketed in April.

According to the US Mint, sales of the American Eagle gold bullion coin totaled 209,500 ounces in April, up a stunning 948% from the previous year and up 22% from the previous month.  The gold bullion coins had the largest amount of sales since December 2009 when 231,500 ounces were sold.

Gold and silver bullion coin sales have soared since the financial crash of 2008 and the subsequent repetitive use of the print button by the world’s central banks.  In order to get a perspective on the flight to precious metals, consider that over the entire year of 2007, the US Mint sold a total of only 198,500 ounces of gold bullion coins – less than montly sales during April 2013.

Sales of the American Eagle silver bullion coins were also very strong.  During April 2013, the US Mint sold 4,087,000 silver bullion coins, up 169% over April of last year and up 22% from the previous month’s sales.  The US Mint has struggled to keep up with demand even before the April surge.  Sales of the American silver eagles was recently suspended twice and in late April the US Mint suspended sales of the one-tenth ounce American eagle gold bullion coin due to inventory depletion.

Based on sales to date, it would not be surprising to see an all time record high amount of the American Eagle silver bullion coins sold in 2013.