May 15, 2024

How To Buy, Store and Sell Gold and Silver

By: GE Christenson

You want to buy silver and gold. There is much to consider!

safe

  • Physical metal or paper promises?
  • From which supplier will you buy it? Price is not the only consideration.
  • Where do you store it? Your sock drawer, a safe, insured and secure vault, or in another country?
  • How do you sell it and when?
  • IRS Rules


Physical, ETF, or Paper?

Do you want actual physical silver and gold that you can hold in your hand? If you do, then buy coins or bars and skip ahead.

If you want to buy and sell easily without taking delivery of actual metal, then perhaps you should invest in an ETF (Exchange Traded Fund) for gold and silver. The fees are minimal; ETFs are convenient and good for frequent trading. The two most popular are GLD and SLV. They are also criticized by many analysts, so I encourage you to also consider PHYS, PSLV, GTU, and others.

If you want paper, then buy options or futures contracts and be careful. When elephants fight, the grass gets trampled – and most of us are merely grass in the world of futures trading.

You Want to Buy Physical Gold and Silver Coins and Bars. Good! Where?

There are many dealers who will sell over the internet and ship to your home or to a secure storage vault. Their prices will vary slightly and so will their terms for payment and delivery. See the partial list and brief comments at the end of this article to get started. There are many other fine dealers in addition to the few examples I have listed.

Storage

More important than where you buy is whether you will buy for delivery to your home, delivery to a secure domestic storage facility, or for delivery to a vault outside of the United States.

Your home – Convenient and close but vulnerable to fire and theft. Your sock drawer is not recommended – buy a safe, hide it, and tell very few.

Safe deposit box at local bank – Secure, less convenient, probably not insured, and vulnerable to a search warrant, court order, and banking shutdown. Use a local bank, not a branch of a huge mega-bank.

Secure storage in the USA – Very secure and safe but may not be close or convenient. Are you comfortable with such storage? If so, then this is an excellent choice. Choose a vault OUTSIDE the banking system.

International Storage – You can store in commercial vaults in London, Canada, Switzerland, Hong Kong, Singapore, Australia, and other locations. The IRS MAY want to be told what you are storing and its value if you are an American citizen and storing internationally. See IRS Rules.

How Do you Sell Your Gold and Silver?

If you are buying for insurance against devaluing paper currencies, perhaps you intend to hold it for a long time or expect to will it to your family. In either case, don’t sell it.

If your gold and silver coins are in your possession, then you can sell via the internet or take them to a local coin store. Most companies that will sell to you via the Internet or a phone call will also buy back at a slight discount to sales price (they have to sell at a mark-up to stay in business). You can also sell on eBay or to private individuals. There probably will be tax implications, so consult with your tax advisor.

When to Sell Gold and Silver?

Again, there is no right answer for everyone. Some will argue that gold and silver are essential insurance against unbacked paper currencies and so should never be sold. Investors may want to hold until they see some large price, say $150 silver and $4,000 gold. Others wish to trade in and out, buying low and selling high. Your choice will help determine if you want paper silver, an ETF, coins, or bars, stored domestically or offshore. It is easy to sell paper or an ETF. It may be less convenient to sell coins and bars that you have stored in a safe deposit box. It probably will be easy to sell gold stored in Switzerland.

Jim Sinclair, legendary gold trader and investor, says buy “fish lines” and sell “rhino horns.” What he means is that markets, especially gold and silver markets, often move too far, too fast, both up and down. The down moves – the fish lines – scare out leveraged speculators and “weak hands” and usually indicate good buy points for long-term investors. When leveraged speculators, hot money, and the public drive the market higher in a parabolic spike upward, the chart looks like a rhino horn, and that often indicates a good time to sell. There will be many more signals, but most of us are overwhelmed by greed and fear, especially panic, and we often miss the signals. In 1929 the “signal” was to sell when shoeshine boys were giving stock tips. Something similar will happen at the next panic high in gold and silver, but that may be years away.

IRS Rules

The IRS has instituted new rules for United States taxpayers. We are now required to report holdings of foreign assets on form 8938 (Statement of Specified Foreign Financial Assets) and form TD F 90-22.1. Consult with your tax attorney and financial advisor, but the simple interpretation is this:

If you own financial assets in another country worth more than certain amounts, usually you must report these assets on form 8938 with your federal tax return and on form TD F 90-22.1 due June 30 of each year. It is wise to comply with IRS requirements as the penalties can be severe. There may be exceptions that your professional advisor can discuss, but these relatively new requirements may influence your choice of investments and their storage locations.

Alphabetical (partial) list of gold and silver vendors with brief comments on each.

Please do your own research before making a purchase.

APMEX – Large gold and silver bullion and coins dealer operating out of Oklahoma. They maintain a sizeable inventory and will buy and sell online in several currencies with reasonable commissions. Apmex will “lock-in” a purchase price online and accept a personal check in payment (with delayed delivery). If you wish, they will also arrange for secure storage with a subsidiary company and ship directly to that insured storage facility. Apmex will assist with the purchase of silver and gold for investment in your qualified IRA.

Bullion Vault – Secure insured vault storage in London, Zurich, and New York for both gold and silver. Purchases can be arranged quickly and online in different currencies with low costs for storage and insurance. It is easy to sell or take delivery of your metals.

Global Gold – Secure insured vault storage in Switzerland, Hong Kong, and Singapore for both gold, silver, platinum, and palladium. Purchases can be arranged quickly and online with low costs for storage and insurance. It is easy to sell or take delivery of your metals. Ownership is physical and fully allocated.

GoldMoney – Secure insured storage in the UK, Switzerland, Hong Kong, Canada, and Singapore for both gold and silver. Purchases can be arranged quickly and online in different currencies with low costs for storage and insurance. It is easy to sell or take delivery of your metals.

GoldSilver.com – Large gold and silver coin and bullion dealer operating out of California. They maintain a sizeable inventory and will buy and sell online with reasonable commissions. GoldSilver.com will arrange storage in Singapore, Hong Kong, Canada, or the USA. You can easily sell your gold and silver holdings or take delivery. They also will assist with purchasing gold and silver coins and bullion for your retirement accounts. If you have time, watch their instructional videos.

Hard Assets Alliance – This is a relatively new company that attempts to meet many needs including convenient gold and silver purchases with secure insured and allocated storage for gold and silver. Silver can be stored in the US but currently only gold can be stored offshore in several countries. Their downloadable information booklet states:

Exempt from US reporting requirements. As a domestic institution, GBI’s US customers are exempt from both the FBAR and Form 8938 filing requirements if offshore metal storage is elected.”

In some circumstances, this exemption from US reporting requirements may be important in your decision-making process.

Lear Capital – Large gold and silver coin and bullion dealer operating out of California. They maintain a sizeable inventory and will buy and sell online with reasonable commissions. Lear Capital will assist with purchasing gold and silver coins and bullion for IRA and 401k retirement accounts.

Liberty Gold and Silver – A smaller gold, silver, and platinum coin and bullion dealer operating out of Oregon. Liberty Gold and Silver will assist with purchasing gold and silver coins and bullion for IRA accounts and can arrange secure allocated storage in the USA, Canada, Germany, Switzerland, and Singapore.

Perth Mint – Located in Australia, the Perth Mint has been in business for over 100 years and is owned by the Government of Western Australia. The mint refines and produces a variety of products, special coins, and commemoratives in gold, silver, and platinum. The Mint receives over 70,000 visitors each year. You can purchase coins and bullion for delivery and arrange for allocated or pooled storage of your metals.

SilverSaver – Secure insured storage in the USA for gold and silver. You can make convenient periodic purchases by direct withdrawal from your checking account. This allows for a signup and forget “dollar-cost averaging” purchase plan. You can also take delivery of your gold and silver or easily sell it back to SilverSaver.

The Ultimate Gold Trust – Gold can be purchased and held in Switzerland. This storage solution is recommended by Julian D. W. Phillips, a frequent commentator on gold and gold storage options. Read his latest article on the safety of offshore storage.

GE Christenson
aka Deviant Investor
COMEX Price Manipulation Forces Silver Price Down Despite Demand Increase

By: Mike McGill of Liberty Gold and Silver

Let’s begin with a definition. Investopedia.com defines the Law of Supply and Demand as follows:

The effect that the availability of a particular product and the desire (or demand) for that product has on price. Generally, if there is a low supply and a high demand, the price will be high. In contrast, the greater the supply and the lower the demand, the lower the price will be.

A solid definition, agreed? The Law of Supply and Demand should be the core premise of all economic studies as it has proved itself to be historically true.

How can we explain what has happened recently with the price of silver? In about three months, silver has declined from its late-November price of about $34 per ounce to its current price of about $28.50 as of today’s close (February 28, 2013). That’s a drop of about $5.50, which equates to a decline of over 16% in about 90 days. An economist with a solid grounding in the supply and demand theory, when viewing this decline, would have to conclude one of two things. Either the supply of silver had recently rapidly expanded or the demand for the precious metal had substantially decreased over the same period. These would appear to be the only logical explanations for this situation.

However, in the alternate universe of manipulated markets, insane derivatives, massive criminal fraud in both the banking and commodities markets, central bank machinations with currency handouts, and complete dereliction of duty on the part of regulatory bodies, it seems that the basic laws of economic price discovery no longer apply.

We need to ask ourselves how is it possible for the price of silver to undergo a substantial drop in price while simultaneously experiencing extremely tight supplies and burgeoning demand. In order to make a professional inquiry regarding this conundrum, we will dispel all the blather from the CNBC crowd that precious metals are in a bubble (they are NOT; both gold and silver remain firmly in a ten year upward channel of growth) and adopt an attitude like Dragnet’s Sergeant Friday, “Just the facts, ma’am, just the facts.”

Here are those facts:

In 2012, silver sales soared. The US Mint reported that the sale of American Silver Eagle bullion coins topped off at the third highest annual total in the twenty-seven year history of the series. Just past mid-December, the US Mint told its distributors that it had “sold all remaining inventories of 2012 American Eagle Bullion Coins,” adding that “no additional coins will be struck.” Until the sell-out, Silver Eagles were on pace to eclipse the second best annual sales in history. Even more amazing was the ratio of sales of Silver versus Gold Eagles – over fifty to one. In total dollars, the sale of Silver Eagles almost matched that of Gold Eagles – nearly 98%.

In January of this year, the sale of Silver Eagles was tremendous. So strong was the demand that the US Mint notified all its distributors shortly past mid-month that it had halted all new orders because it had run out of bullion supply. Despite two production shutdowns in January, the US Mint sold a record breaking 7.13 million Silver Eagles in ONLY TEN BUSINESS DAYS, shattering the previous monthly record set in 2011. Currently, the US Mint is on allocation rationing to its distributors – and we’re into this year only eight weeks!

Another instance of extreme silver shortage that has seen little to no reporting is the near total annihilation in the availability of “junk silver” (pre-1965 US silver coins). As of the beginning of this week, almost none could be found anywhere in the country except in extremely tiny amounts. Nearly every wholesaler and retailer in the nation was completely sold out. Waiting time for orders is at least a month with six weeks being quoted as a reliable delivery date.

Just a week ago, it was reported that Apple will be delaying its new 21.5 iMacs because of a shortage of silver in China. Silver is used extensively in iMacs. The production delays are already three months and counting.

On the demand side of this equation, wholesale premiums over the silver spot price have risen as much as six-fold in the past two months. Retail mark-ups for these coins have never been greater since the 1980 high when silver topped $50.

What is one to conclude with this incredible contradiction of drum-tight silver supply and record breaking demand weighed against a silver price decline of nearly 16% in the last three months? It is difficult not to conclude that there has been market intervention and/or price manipulation occurring.

As we’ve reported several times over the last few years, the spot price of precious metals is set almost entirely by the bid-ask trading action in the world’s commodity pits, principally the COMEX in New York and the London Bullion Market Association. These exchanges have been notorious for allowing massive naked short selling by large investment banks such as JPMorgan Chase and Goldman Sachs without these firms having to post either the normally required margin deposits or having adequate silver on deposit with these exchanges to satisfy delivery requirements for those traders who might wish to take physical delivery of the silver upon contract expiration. Both of these activities are violations of the rules of the futures exchanges involved as well as federal requirements that are supposed to be enforced in the US by the Commodities Futures Trading Commission (CFTC). The CFTC itself has been repeatedly accused by the Gold Anti-Trust Action Committee (GATA) and many others of being derelict, if not outright complicit, in allowing these trading violations to continue. Link is here.

What we’re seeing is a big disconnect between silver’s paper price and its actual physical availability. It is not inconceivable that what is occurring is similar to what happened to markets in the old Soviet Union. The communist ruled markets quoted cheap prices for products that were chronically in short supply. The real market, the “black market,” was where you could purchase real goods with fair price discovery. When this dichotomy completely broke down, so did the Soviet Union. It is not difficult to foresee that a breakdown and growing distrust of the paper silver markets could well cause a price explosion in physical silver.

We have been warning for years that paper markets in general and precious metals markets specifically, should be viewed with suspicion, as they all contain counter party risk, which cannot be honored. The only sure way to fully protect oneself is to own physical coins and bullion. Do it today while the “paper price” is still low.

Gold and Silver Bullion Coin Sales Soar In February

Sales of both the American Eagle gold and silver bullion coins soared in February compared to the previous year.
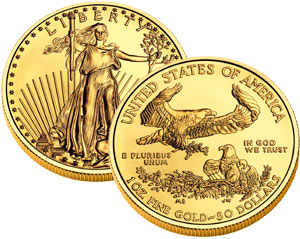
According to the U.S. Mint, sales of the American Eagle gold bullion coin totaled 80,500 ounces in February, up 283% from comparable sales of 21,000 ounces during February 2012.  During January, the Mint sold 150,000 ounces of the gold bullion coins compared to 127,000 ounces during January 2012.  January gold bullion sales were the six largest on record and the most since July 2010 when the Mint sold 151,500 ounces.

Total 2013 sales of the American Eagle gold bullion coin through February are up 56% over the comparable period for last year.  Year to date, the U.S. Mint has sold 230,500 ounces of gold bullion coins compared to a total of 148,000 ounces during the first two months of 2012.

The American Eagle gold bullion coin is available in one ounce, one-half ounce, one quarter ounce and one-tenth ounce versions.   The vast majority of gold bullion coins are purchased as one ounce coins as can be seen from the February sales breakdown listed below.

FEB 2013 GOLD BULLION SALES
OUNCES # COINS
ONE 68,000 68,000
HALF 2,500 5,000
QUARTER 3,000 12,000
TENTH 7,000 70,000
80,500 155,000

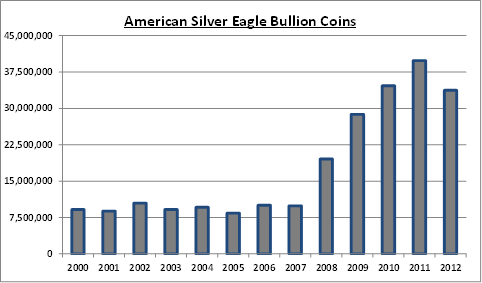
Sales of the American Eagle silver bullion coin also remained robust after last month’s record shattering sales total.  During January, the U.S. Mint sold 7,498,000 silver bullion coins as public demand for physical silver coin soared.  The huge demand for the American Eagle silver coins forced the U.S. Mint to suspend sales twice as they sought to ramp up production to meet demand.  Ever since the financial crisis and the subsequent open ended money printing operations by the Federal Reserve, demand for physical silver has continued strong.   Prior to 2008, total annual sales of the silver bullion coins averaged only around 9.5 million coins.  During 2012, the U.S. Mint sold 33,742,500 silver bullion coins.

During February, the U.S. Mint reported that 3,368,500 American Eagle silver bullion coins were sold, an increase of 126% over sales of 1,490,000 ounces during February 2012.  Year to date sales of the silver bullion coins through February total 10,866,500, up by 43% over the comparable two month period during 2012 when 7,597,000 silver bullion coins were sold.

Long term investors are taking advantage of temporary price weakness in precious metals to add to positions (see APMEX Reports Sales Spike).   Virtually every major central bank in the world is now engaged in open ended money printing operations and blatant attempts to competitively devalue their currencies.  The public is not stupid and continued demand for physical gold and silver proves that gold and silver are becoming the default store of value.

Both the American Eagle gold and silver bullion coins are sold to the Mint’s network of authorized purchasers who buy the coins in bulk based on the market value of the precious metals and a markup by the Mint.  The public is not allowed to purchase bullion coins directly from the Mint but are allowed to buy numismatic versions of the coins.  The gold and silver bullion coins are sold by the authorized purchasers to the public, other bullion dealers and coin dealers.  The rationale for the Mint’s use of authorized purchasers is that this method makes the coins widely available to the public with reasonable transaction costs.

The Fundamental Reasons For Owning Gold and Silver Are Stronger Than Ever

One of the best methods for protecting wealth against a constantly depreciating paper currency is to own precious metals.
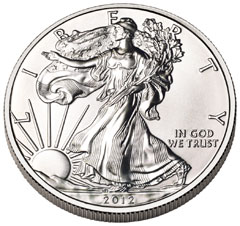
The bull case for precious metals remains intact as central bankers worldwide have become the lenders of last resort for nations that have exhausted their borrowing capacities.  Very little has changed since 2008 when the world financial system stood at the abyss of collapse.  Unsustainable debt levels continue to increase even as the capacity to service the debt diminishes.

As discussed in Why There is No Upside Limit For Gold and Silver Prices, the U.S. has reached a tipping point on the road to insolvency. Despite trillions in stimulus spending, both job creation and economic growth have been extremely weak and are likely to remain so.

Economists Kenneth Rogoff and Carmen Reinhart, authors of This Time Is Different: Eight Centuries of Financial Folly, offer comprehensive statistical evidence of the dangers of excessive public debt.  As documented in their book, once public sector debt reaches 90% (which the U.S. is very close to) a country has only three options, all of them bad.

According to Rogoff and Reinhart, the only way out for overleveraged nations is a restructuring through default, austerity or allowing inflation to increase while repressing interest rates at a very low level.

Default is the most drastic and least likely remedy to be used by a country such as the United States which issues its own currency and can create an unlimited number of dollars to service debt payments.

Austerity, the second option, is a highly unlikely scenario under our current democratic system.  Any politician voting for austerity measures would quickly be voted out of office and replaced by another politician promising continued funding of the social welfare state.  Since over half the country’s population currently depends on entitlement programs to survive, the power of the majority vote guarantees that austerity will not  become a policy for putting the country back on a fiscally sound economic path.  The inability to reduce unsustainable spending  or impose confiscatory rates of taxation leaves the government with one bad option – print more money.

The United States is currently locked into policy options that guarantee a long term rise in gold and silver prices.  The current weakness in precious metals represents a buying opportunity for those seeking to accumulate and protect their wealth over the long term.

APMEX Reports Sales Spike on eBay Bullion Center

Last  Wednesday, with New York gold down over $40 per ounce, even long time gold bulls were advising caution before committing to further investment.  Some precious metals dealers reported a flood of panic selling by anxious investors who were unloading physical coin and bar.

With everyone fearful of lower prices, exactly who was buying all that gold and silver from panicked investors?

Michael Haynes, CEO of APMEX, one of the countries largest precious metals dealers, said “As gold and silver prices continue to drop, long-term investors immediately reacted to the market movement. Recognizing that the precious metals were on sale and at a discount relative to the expected future values, buyers of physical bullion increased purchasing at the APMEX Bullion Center on eBay.”

Michael Haynes explained further.

“This was the second largest selling day for the APMEX Bullion Center on eBay since inception about five months ago, beating the next highest selling day by more than 30%. As Gold and Silver prices fell, heavily influenced by the reaction of day traders to the minutes from the recent Federal Reserve Open Market Committee meeting, physical sales of both metals skyrocketed. Buyers of physical Gold and Silver have a moderate to long term view and concluded that with the price movements, the precious metals were on sale and at a discount relative to the expected future values. These investors in physical Gold and Silver apparently see the long term issues faced by the U.S. economy and seek some asset allocation into the non-correlated asset class of precious metals to protect and hedge their investments in paper assets like Stocks and Bonds.”

According to APMEX, the top sellers on the Bullion Center are the 1 oz Silver American Eagle, the 1 oz Gold American Eagle, the 5 gram Statue of Liberty Credit Suisse Gold Bar and the 100 oz Royal Canadian Mint Silver Bar.

Every bull market has corrections which offer long term investors the opportunity to add to positions at bargain prices.  The high volume of gold and silver purchases on the eBay Bullion Center indicates that mainstream buyers remain committed to precious metals as a method of wealth preservation.

Expect $200 Silver As The Shift To Real Assets Accelerates

By: Deviant Investor

silver-coin-sm

    • Silver has no counter-party risk. It is not someone else’s liability. Silver Eagles or Canadian Silver Maple Leaf coins are recognized around the world and have intrinsic value everywhere. The same is NOT true for hundreds of paper currencies that have become worthless, usually because the government or central bank printed them to excess to pay the debts of governments that did not control spending.
    • The price of silver in US dollars since the year 2001 has been strongly correlated with the ever-increasing official national debt of the United States. Read $100 Silver! Yes, But When? I doubt that anyone believes the national debt will decrease or even remain constant over the next four years. We have every reason to believe that it will increase by well over $1,000,000,000,000 per year for many years. If the national debt is rapidly increasing and it correlates, on average, with the price of silver, then we can be reasonably certain that the HIGHLY VOLATILE price of silver will increase substantially over the next few years.

Click on image to enlarge.
    • Silver has been used as money (medium of exchange and a store of value) for over 3,000 years. In most cultures, silver has been used for daily transactions far more often than gold. I have read that the word for “money” is the same as the word for “silver” in many languages.
    • In the United States silver was used as money – coins – until the 1960s when inflation in the paper money supply caused the price of silver to rise sufficiently that silver coins were removed from circulation. Do you remember silver dollars? They contained approximately 0.77 ounces of silver. Currently the US Mint produces silver eagles which contain 1.0 ounce of silver – and cost approximately $35.

silver-coin

  • Argentina has devalued their currency several times and has dropped eight zeros off their unbacked paper money in the past 30 years. The United States has not dropped any zeros from dollars, but it took approximately one-half of one dollar to buy an ounce of silver 100 years ago, while it takes over 30 in today’s reduced value dollars. It took about 20 dollars to buy an ounce of gold 100 years ago and it takes over 1,600 dollars to buy that same ounce of gold today. There are many more dollars (paper and electronic) in circulation today compared to 100 years ago. Hence the prices, measured in declining value dollars, for silver, gold, wheat, crude oil, bread, coffee, and ammunition is MUCH larger.


  • Throughout history the prices of gold and silver have increased and decreased together, usually with gold costing 10 to 20 times as much as silver. A historical ratio of 15 or 16 is often quoted and that places the current ratio, which is in excess of 50, as relatively high. Since Nixon “closed the gold window” on August 15, 1971 and allowed the dollar to become an unbacked paper currency that could be created in nearly unlimited quantities, the gold to silver ratio has ranged from a high of approximately 100 to a low of approximately 17. There is room for silver prices to explode higher, narrowing the ratio to perhaps 20 to 1. When gold reaches $3,500 (Jim Sinclair) and subsequently much higher in the next few years, and assuming the ratio drops to approximately 20 to 1, the price of silver could approach $200 per ounce, on its way to a much higher number, depending on the extent of the QE-Infinity “money printing,” panic, hyperinflation, and investor demand.


  • If you think a silver price of $200 per ounce is outrageous, I suspect you would find near universal agreement among most Americans. But is a national debt in excess of $16,000,000,000,000 less outrageous? If unfunded liabilities are included the “fiscal gap” is, depending on who is calculating it, approximately $100,000,000,000,000 to $220,000,000,000,000. For perspective, that places the unfunded liabilities of the US government at approximately $700,000 per person in the United States. Is $700,000 unfunded liability (debt) per man, woman, and child more believable than a price for silver of $200?

It seems likely that the populace will eventually realize that:

  • Government spending is out of control and will not be voluntarily reduced.
  • “Printing money” or debt monetization (QE) is necessary and inevitable in order to continue funding the excess spending of the US government. More money in circulation means a declining purchasing power for the dollar. The decline is likely to accelerate at some time in the future.
  • The real value of our savings and retirement diminishes as the dollar declines in value.
  • People will panic and shift into real assets to preserve their purchasing power. (There is no fever like gold fever!)
  • That panic will cause gold, silver, and many other real assets to drastically increase in price, as measured in devalued dollars.
  • It is better to be early than late if a panic-moment is about to arrive.
  • Silver is less expensive per ounce than gold and more available for purchase than gold, particularly for middle-class westerners. An investment into silver is likely to appreciate more than a similar investment in gold.

What Do You Believe?

  • Do you believe that excessive spending and debt will be reduced?
  • Do you believe that the decline in purchasing power of the dollar over the last 100 years will suddenly
  • Do you believe that congressional promises for Social Security, Medicare, Medicaid, and government pensions will be broken?
  • Do you believe the Federal Reserve will continue to print the money to pay for those promises?
  • Do you believe your savings and retirement are totally safe in paper investments denominated in dollars?
  • Do you believe, as history indicates, that paper money eventually devalues to zero while gold and silver retain their value?
  • Do you believe that the world will suddenly stop using silver, instead of finding new uses for it every year?
  • Would you rather trust silver coins in a safe place or paper money and political promises?
    Most people will do nothing to protect their financial future. Will you?
    GE Christenson
    aka Deviant Investor

American Eagle Gold Bullion Coin Sales Soar In January To Multi-Year High

Sales of the American Eagle gold bullion coin soared during the first month of the year.  According to the US Mint, gold bullion coin sales totaled 150,000 ounces, up 97.4% from December 2012 when 76,000 ounces were sold.  Sales for the month were up 18.1% from comparable sales of 127,000 ounces a year ago during January 2012.
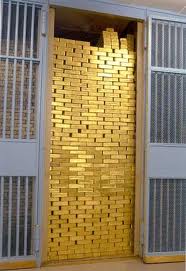
There has been a surge in demand for both gold and silver bullion coins during the first month of 2013.  Sales of the American Silver Eagle bullion coins hit an all time record high during January as public demand for physical silver soared.  The U.S. Mint has been forced to suspend sales of the silver bullion coins twice since last December since their entire stock was sold out.  In addition, opening day sales for the 2013 American Silver Eagle bullion coins were the largest on record with total sales of 3,937,000 coins.  To put this huge sales figure into perspective, prior to 2008, total annual sales of the silver bullion coins was only about 9.5 million coins.

January sales of 150,000  ounces of American Eagle gold bullion coins was the sixth largest on record and represents a multi-year high in sales since July 2010 when 152,000 ounces were sold.  The previous record months were June 2010 with 151,500 ounces, December 2009 with 231,500 ounces, April 2009 with 157,500 ounces and December 2008 with 176,000 ounces.

The gold bullion coins are available in one ounce, one-half ounce, one quarter ounce and one-tenth ounce.  The total number of coins sold during January 2013 was 275,500 as shown below.

JAN 2013 GOLD BULLION SALES
OUNCES # COINS
ONE 124,500 124,500
HALF 8,500 17,000
QUARTER 6,000 24,000
TENTH 11,000 110,000
150,000 275,500

The American Eagle gold bullion coins are not sold directly to the public but rather to the Mint’s network of authorized purchasers who buy the coins in bulk based upon the market value of gold and a Mint markup.  The authorized purchasers then resell the coins to the public, coin dealers and other bullion dealers.  The U.S. Mint utilizes this distribution channel in order to make the coins widely available to the public with reasonable transaction costs and premiums in line with other bullion programs.

GATA Finally Gets The Recognition It Deserves

Every gold and silver investor owes a debt of gratitude to the Gold Anti-Trust Action Committee (GATA).  Long fluffed off by the mainstream media, GATA has been a voice in the wilderness in exposing the manipulative schemes of governments and central banks to suppress gold prices.

With printing presses running wild world wide, the issue of gold price suppression will become ever more critical as the public eventually realizes that the only viable alternative to paper money backed by nothing is a gold backed currency system.

The tireless efforts of GATA, spearheaded by Secretary/Treasurer Chris Powell,  in documenting surreptitious gold price suppression schemes by central banks has finally been recognized by a major mainstream financial publication.

The Financial Times, in an article regarding the repatriation of gold from the Fed by the Bundesbank, talks about the lack of transparency by central banks in the gold market.  (Read the full article here.)

The gold market barely shrugged when the Bundesbank announced it would move 674 tonnes of the stuff from Paris and New York to Frankfurt.

But the move is important: not for what it says about Germany’s faith in French or American vaults; nor for the cost of shifting 674 tonnes of gold; but because it is a major victory for transparency in the gold market.

Central banks are notoriously secretive about their gold-trading activities.

Most report, on a monthly basis, their gold reserves to the International Monetary Fund. But these data fall a long way short of full transparency. They tell us nothing about derivative positions in the gold market — for example, gold loans, agreements for future sales, or options transactions.

The historical lack of transparency among central banks is somewhat understandable.

With 29,500 tonnes between them (a decade of global mine supply) they have the ability to disrupt the market significantly if their trades are too public. See, for example, the reaction to the UK’s announcement that it would sell a large part of its reserves in 1999.

Maybe at some point, the rest of the mainstream media will finally decide to take a critical look at the dealings of central banks in the gold market.

American Silver Eagle Bullion Coin Sales Soar To All Time Record High

With two days remaining in the month of January, U.S. Mint sales of the American Silver Eagle bullion coins have already established an all time record high.   The latest numbers from the Mint show total sales of 7,420,000 silver bullion coins as January 29, 2013.  Total sales during January 2012 amounted to 6,107,000 coins.  During January 2011 (the previous monthly record high for silver bullion coin sales) the Mint sold 6,422,000 coins.
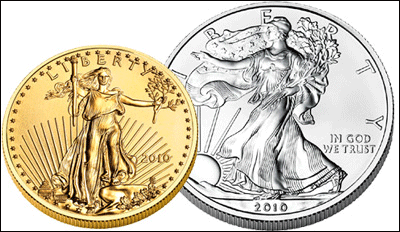
The public demand for silver seems insatiable.  To put the unprecedented demand for silver into perspective, prior to the financial crisis of  2008, total yearly sales of the silver bullion coin averaged only about 9.5 million coins per year.  With the Federal Reserve furiously printing money to keep the financial system glued together, investor demand for both physical silver and gold bullion is likely to increase dramatically.

The US Mint has been unable to keep up with the demand for American Silver Eagles for the past two months (see U.S. Mint Sold Out).  During December, unexpectedly strong demand resulted in the suspension of silver bullion coin sales during mid December after the entire stock of 2012 coins was sold out.  At the time the Mint announced that the 2013 American Silver Eagles would be available on January 7, 2013.

Opening day sales on January 7th for the 2013 American Silver Eagle bullion coins turned out to be the largest on record with sales of 3,937,000 coins.  Demand for silver bullion continued to climb and by January 17th, the Mint once again announced that sales of the silver bullion coins would be suspended until the last week of January.  When sales resumed this week, demand was again much higher than anticipated.  Due to record demand, the Mint previously announced that they may have to institute rationing of the coins.  Since the US Mint’s production schedule has been blown right out the window for two months running, it would not be surprising if rationing of the coins was implemented.

Sales of the American Eagle Gold bullion coins has also soared during the first month of the year.  January sales to date of 140,000 ounces of gold bullion coins is the highest monthly sales since June 2010 when the Mint sold 151,500 ounces.

Gold At $10,000 – Silver At $400 – Here’s How It Will Happen

By GE Christenson:

This is not a prediction of future prices of gold and silver; it is an indication of what could happen in a speculative bubble environment based on the history of previous bubbles.

I’ll summarize a simple analysis of past bubbles.

Definitions

    • Bubble: A speculative mania in a market that is priced well beyond what the fundamentals and intrinsic value indicate.
    • Phase 1: The first phase of the bubble begins with the price bottoming and initiating a long rally. It is often indicated by a triggering event such as Nixon closing the “gold window” on August 15, 1971 – the beginning of the gold and silver bubbles that terminated in 1980. The market rallies for some years, hits a new “all-time” high, and then corrects.

When the market proceeds into a bubble phase, it rallies beyond that new high and continues much higher. The end of phase 1 and the beginning of phase 2 are the point at which the market rallies from its correction low and exceeds its previous high. See the graph of the silver market with the indicated beginning and end points for phase 1 and phase 2.

  • Phase 2: The final phase of the bubble starts when the price exceeds the “new high” and then rallies to a much higher and unsustainable level.

Click on image to enlarge.

I looked at the time and price data for the South Sea Bubble in England from 1719 -1720, the silver bubble from August 1971 to January 1980, the NASDAQ bubble from August 1982 to March 2000, the Japanese Real Estate bubble from 1965 to 1991, the gold bubble from August 1971 to January 1980, and the S&P mini-bubble from August 1982 to March of 2000. A spreadsheet will not display well, so I’ll list my results. Please realize that all prices and dates are approximate – this is “big picture” analysis.

The conclusion is that bubbles start slowly and then accelerate to unsustainable highs (on large volume) that are largely created by greed and fear but not fundamental evaluations. Bubbles generally follow the “Pareto Principle” where approximately 80% of the price move occurs in the LAST 20% of the time. Consider:

South Sea Bubble: (Extreme price bubble)

  • Phase 1: January 1719 to March 1720. Price from $120 to $180.
  • Phase 2: March 1720 to July 1720. Price from $180 to $900.
  • Time: Phase 1 – 75%, phase 2 – 25%.
  • Price: Phase 1 – 8%, phase 2 – 92%. Phase 2 price ratio: 5

Silver Bubble: (Extreme price bubble)

    • Phase 1: August 1971 to March 1978. Price from $1.50 to $6.40.
    • Phase 2: March 1978 to January 1980. Price from $6.40 to $50.
    • Time: Phase 1 – 78%, phase 2 – 22%.
    • Price: Phase 1 – 10%, phase 2 – 90%. Phase 2 price ratio: 7.8


NASDAQ Bubble: (Extreme price bubble)

    • Phase 1: August 1982 to February 1995. Price from $168 to $780.
    • Phase 2: February 1995 to March 2000. Price from $780 to $4,880.
    • Time: Phase 1 – 71%, phase 2 – 29%.
    • Price: Phase 1 – 13%, phase 2 – 87%. Phase 2 price ratio: 6.3


Japanese Real Estate Bubble: (approximate numbers)

    • Phase 1: 1960 to 1979. Price Index from 4 to 50.
    • Phase 2: 1979 to 1991. Price Index from 50 to 225.
    • Time: Phase 1 – 61%, phase 2 – 39%.
    • Price: Phase 1 – 21%, phase 2 – 79%. Phase 2 price ratio: 4.5


Gold Bubble:

    • Phase 1: August 1971 to July 1978. Price from $40 to $200.
    • Phase 2: July 1978 to January 1980. Price from $200 to $870.
    • Time: Phase 1 – 82%, phase 2 – 18%.
    • Price: Phase 1 – 19%, phase 2 – 81%. Phase 2 price ratio: 4.4


S&P Bubble: (Mini-bubble)

    • Phase 1: August 1982 to February 1995. Price from $100 to $483.
    • Phase 2: February 1995 to March 2000. Price from $483 to $1,574.
    • Time: Phase 1 – 71%, phase 2 – 29%.
    • Price: Phase 1 – 26%, phase 2 – 74%. Phase 2 price ratio: 3.3


Summary

Bubbles tend to follow the 80/20 ratio indicated in the Pareto Principle. Phase 1 takes approximately 70-80% of the time and covers approximately 10-20% of the total price change. Phase 2 accelerates so that it takes only 20-30% of the time but covers 80-90% of the price change. Extreme bubbles such as the South Sea Bubble and the Silver bubble experience approximately 90% of the price change in the 2nd phase. The ratio of the phase 2 ending price to beginning price is typically 4 to 8 – a huge price move. Such bubbles are rare; the subsequent crash is usually devastating.

Future Bubbles

In the opinion of many analysts, sovereign debt is an ongoing bubble that could burst with world-wide consequences. Should deficit spending and bond monetization (Quantitative Easing) accelerate in the next several years, as seems likely, that sovereign debt bubble will inflate further. Because of the massive printing of dollars, the value of the dollar must fall, particularly against commodities such as oil, gold, and silver. As the purchasing power of the dollar falls, an increasing number of people will realize their dollars are losing value, and those people will seek safety for their savings and retirement. Gold and silver will benefit from an increasingly desperate search for safety as a result of the decline of the dollar. Assuming the 80/20 “rule” and the phase 2 price change ratio of approximately 5, what could happen if gold and silver rise into another speculative bubble?

Assume that silver began its uptrend in November 2001 at $4.01 and that gold began its move in April 2001 at $255. Silver rallied to nearly $50 in 2011, and gold also rallied to a new high of about $1,900 in 2011. Assume that both surpass those highs about mid-2013 and accelerate into phase 2 thereafter. Using these assumptions, phase 1 for silver would measure 12.5 years and phase 2 could last until approximately late 2016 – early 2017. If we assume that phase 1 was a move from $4 to $50 and that represents 19% of the total move, the high could be around $250. The ratio of phase 2 ending price to beginning price would be 5:1 – reasonable.

Indications for gold suggest a similar end date and a phase 2 bubble price of perhaps $9,000 per ounce. The ratio of phase 2 ending price to beginning price would be 4.7:1 at $9,000.

The gold to silver ratio at these bubble prices would be approximately 36, much higher than the ratio from 1980. Perhaps silver would “blow-off” higher, like it did in 1980, and force the gold to silver ratio lower or perhaps gold might not rally so high. Time will tell.

Outrageous?

Well, yes, at first glance, those prices do seem outrageous. But consider for perspective:

  • Apple stock rose from about $4 in 1997 to over $700 in 2012.
  • Silver rose from $1.50 to $50.00 in less than 10 years.
  • Gold rose from about $40 to over $850 in less than 10 years.
  • Crude oil rose from less than $11 in 1998 to almost $150 in 2008.
  • The official US national debt is larger than $16,000,000,000,000. The unfunded liabilities, depending on who is counting, are approximately $100,000,000,000,000 to $230,000,000,000,000. Divide $200 Trillion by approximately 300,000,000 people and the unfunded debt per capita of the United States is approximately $700,000. That is outrageous!
  • The official national debt increases in excess of $3,000,000,000 per day, each and every day. The unfunded liabilities increase by perhaps five – ten times that amount. Outrageous!
  • We still pretend the national debt is not a problem and that it will be “rolled over” forever. That is outrageous.
  • Argentina has revalued their currency several times in the last 30 years – they have dropped 8 zeros off their currency since 1980. Savings accounts and the middle class were devastated several times. It can happen again.

Given the above for perspective, is gold at $5,000 to $10,000 per ounce unreasonable or impossible? Is silver at $200 to $400 per ounce unreasonable or impossible? Past bubbles have had an ending price 4 – 8 times higher than the phase 2 beginning price, so history has shown that such prices for gold and silver are indeed possible. Possible is not the same as certain – but these bubble price indications are certainly worth your consideration.

Would you prefer your savings in gold, silver, or a savings account? Read Ten Steps to Safety.
GE Christenson
aka Deviant Investor