May 3, 2024

Worldwide Buying Frenzy of Gold and Silver Continues

Liberty EagleDon’t precious metal investors read newspapers?  Despite proclamations from the mainstream press that the bull market in gold and silver is over, a buying frenzy in precious metals is occurring worldwide.  The gold rush mentality to buy gold and silver at bargain prices has resulted in stock out conditions for many retail sellers of precious metals, including the U.S. Mint.

Intense gold demand in India has lead to shortages as Gold Buyers Throng Indian Stores for Second Week on Rally.

Gold consumers in India, the world’s biggest importer, thronged jewelry stores across the country for a second week on speculation that bullion may extend a rally after the biggest plunge in three decades.

“We waited for sometime to see if prices will fall more but when we saw them moving up again, we decided it’s time,” said Sripal Jain, a 77-year-old silver dealer who came with his younger brother, daughter and daughter-in-law to buy gold necklaces at Mumbai’s Zaveri Bazaar. “We don’t have any wedding or occasion coming up. The rates fell, so we decided to buy.”

Bullion slumped 14 percent in two days, reaching the lowest price in two years on April 16, triggering a frenzy among coin and jewelry buyers from the U.S. to India, China and Australia. The surge in demand has helped prices rally 11 percent since April 16, and jewelers in India are paying premiums of as much as $10 an ounce to secure supplies, according to the Bombay Bullion Association.

Gold will rally to $1,800 an ounce by December as skepticism over the global recovery increases demand, billionaire Indian jeweler T.S. Kalyanaraman said on April 19.

The rush to buy has led to a shortage in India and jewelers are paying premium of as much as $10 an ounce compared with $2 just 10 days earlier, said Bipin Jain, owner of Vimalson Jewellers and a vice president of the bullion association.

The Perth Mint reports that while the media is talking about the bear market in gold, bullion buying has soared as bargain hunters move in.  As gold and silver prices corrected, Perth Mint buyers viewed the situation as a perfect buying opportunity and stepped up their purchases of gold and silver.  Activity on the Perth Mint website was so intense, that some buyers experienced long delays.

As the central bank of Japan continues its unprecedented experiment in massive monetary expansion, the Japanese Seek Refuge in Bullion as Yen Slumps, Inflation Looms.

Japanese consumers are poised to become net buyers of gold for the first time in eight years as the yen’s decline and looming inflation drive them to seek refuge in bullion, according to Standard Bank Plc.

Net sales of gold bars and coins by Japanese individuals shrank to 10.1 metric tons in 2012, the smallest amount since 2005, data from the World Gold Council show. A surge in purchases this month and the chance to buy after bullion slumped into a bear market foreshadow a turnaround in 2013, said Bruce Ikemizu, Standard Bank’s head of commodities trading in Tokyo.

The currency has depreciated 13 percent against the dollar this year and is trading near a four-year low after the central bank’s pursuit of unprecedented monetary easing to end deflation was unopposed by Group of 20 nations. Inflation may rise above 1 percent in the 12 months starting April 2014 and approach a 2 percent target as early as that year, Bank of Japan (8301) policy board member Ryuzo Miyao said April 18.

“The time has come for Japanese to buy gold with the government trying to engineer inflation,” Ikemizu, who has traded commodities for almost three decades, said in an interview in Tokyo yesterday. “Retail investors are turning from sellers to buyers of bullion.”

In India and China, the biggest gold-consuming nations, shoppers last week lined up in bazaars from Mumbai to Shanghai to buy the metal for brides, babies and strongboxes after prices fell. Indian consumers bought a net 312.2 tons of gold bars and coins in 2012, while purchases by individuals in China reached 265.5 tons, according to the World Gold Council.

The long term rationale for owning gold and silver remains intact.  The reasons for the recent smash-down in gold and silver may never be known but it has provided a gift opportunity to increase positions in gold and silver.

Silver Rally Is Imminent Based On COT Data

Silver ETFBy: GE Christenson

The Commitment of Traders data is published every Friday. It lists the reportable positions of the commercial and non-commercial traders for silver contracts on the COMEX.

STOP! Yes, I know

  • The data is manipulated. The same people who brought us LIBOR, flash crashes, high frequency trading, and the most recent gold and silver crash are the people who report the data.
  • Experienced traders like Jim Sinclair understand the inner workings of this data far better than I, and it is my impression that he is skeptical of the value of the COT data.
  • The data is subject to revision, errors, and occasional changes in definitions.
  • Not everyone in the world is honest in their reporting (really?), and the regulation and enforcement might be a bit lax (really?).

But, given the above, let’s look at the data and USE WHAT WE HAVE.

  • First: Take the non-commercial category and net the longs and shorts. Call this the non-commercial net longs.
  • Second: Take the commercial category and net the longs and shorts (longs minus shorts – may be negative). Call this the commercial net longs.
  • Third: Subtract the commercial net longs from the non-commercial net longs. This provides a rough estimate of the difference in commitment to silver between those two broad groups of traders on the COMEX. So what? Is it valuable? Does it tell us anything useful about probable future price changes?

Examine the graph. The COT non-commercial net longs less the commercial net longs (in the legend as “net long”) are shown in red. Pay attention to the red circles where the “net long” drops below 50,000.

Click on image to enlarge.

The price of silver (in dollars) since 2005 is shown. Note the black circles that roughly correspond to the red circles. Each red circle (low in “net long”) was a buying opportunity, and silver subsequently rose in price. Some were excellent long-term opportunities, such as September 2005, August 2007, October 2008, and April 2009. Others, such as July 2011, October 2011, December 2011, and June 2012, were good but short-lived buying opportunities.

Conclusions

In spite of the supposed manipulation and distortion in the data, it does have some value indicating future price direction.

The data is better at picking price bottoms than tops. Do NOT trade using this data alone. NOW looks like a price bottom.

The data will probably NOT tell you if the current “bottom” is one in a series of lower lows in a bear market or if it is a multi-year bottom and the beginning of a new bull market.

My Opinion

This current bottom is more like the bottom in 2008 after that 55% washout than any other bottom in the past three decades. I expect that now is a significant bottom, and we will see substantially higher prices over the next several months and several years. Unfortunately, I also expected the same after the June 2012 bottom. So, we’ll wait and see… In the meantime, go back and review the fundamental case for silver and gold. Read: Why Buy Silver? and Why Buy Gold?

GE Christenson
aka Deviant Investor

U.S. Mint Runs Out of Gold Bullion Coins

tenth oz gold-eaglesWe already knew from numerous previous reports that demand for physical gold and silver has soared since the early April precious metals crash.  Further confirmation of vanishing physical gold and silver inventory was provided today by the Untied States Mint.  Authorized purchasers of gold and silver bullion coins were informed by the U.S. Mint that sales of the one-tenth ounce American Eagle bullion coin would be immediately suspended due to depleted inventories of the coin.

As short term paper speculators run from the precious metals markets, long term investors have been lining up around the block to buy physical gold and silver.  Numerous coin and bullion dealers have reported growing shortages of gold and silver and premiums have expanded as demand overwhelms supply.

Based on mid month sales reports for the American Eagle gold bullion coins, it looked like monthly sales would exceed 167,000 ounces, the highest since December 2009 when the financial system was still in a meltdown.  As of today, U.S. Mint sales of gold bullion coins has reached 183,500 ounces, an astonishing increase of 818% over the prior year’s monthly sales of 20,000 ounces.  April sales to date have increased by 196% over March sales.  For all of 2012, average monthly sales of the American Eagle gold bullion coin were 62,750 ounces.  Gold bullion coin sales by the U.S. Mint are shown below; figures for 2013 are through April 23rd.


Gold Bullion U.S. Mint Sales Since 2000
Year Total Ounces Sold
2000 164,500
2001 325,000
2002 315,000
2003 484,500
2004 536,000
2005 449,000
2006 261,000
2007 198,500
2008 860,500
2009 1,435,000
2010 1,220,500
2011 1,000,000
2012 753,000
2013 476,000
TOTAL                                      8,478,500

Sales of the American Eagle silver bullion coins, which had already been selling briskly before the April silver smash-down, continue to sell at a rapid pace.  Total monthly sales as of April 23rd have reached 3,232,000 ounces, almost as much as the previous month’s total and 112.6% higher than the comparable month of 2012.

The steep correction in gold and silver prices that occurred in early April has certainly not disturbed the fundamental long term reasons for buying precious metals.  Expect the buying stampede to continue.

Physical Demand For Gold and Silver Skyrockets – Gold Bullion Coin Sales Highest Since December 2009

1881-CC-Morgan-DollarWe have probably all heard enough already from the mainstream nitwits who are forecasting the end of the gold bull market and further price declines.  Funny thing though, most precious metal investors don’t need advice from self proclaimed experts on how to invest their money.  The explicitly stated goal of central banks to increase the rate of inflation through currency debasement is blatantly obvious.  Investors are acting accordingly by taking advantage of the recent decline in precious metal prices.

A look at product availability and pricing at some major coin and bullion dealers shows spot shortages of gold and silver as well as large premiums as investor demand overwhelms supply.

The Perth Mint reports that retail customers are increasing purchases at a record rate even as gold slumps to a 21 month low.  As the experts were proclaiming the “Death of Gold”, the Perth Mint website recorded the highest activity of the year and one of the best days of the past year.  Bargain prices on gold and silver have greatly increased the demand for physical gold and silver by the public.  Demand for gold coins have skyrocketed with sales of Australian gold bullion coins increasing by 48% in the first quarter over the comparable prior year period.

2013-Australian-Kangaroo-1oz-Gold-Bullion-Coin-Reverse-S

Buying by U.S. investors of the American Eagle gold and silver bullion coins has also increased dramatically.  Through April 16th, sales by the U.S. Mint of the American Eagle gold bullion coins have already exceeded total monthly sales for the previous two months.  At the current sales pace, sales of the gold bullion coins in April will total over 167,000 ounces, an increase of over 260% from the prior month.  The last time sales of gold bullion coins exceeded 167,000 ounces was in December 2009 when the U.S. Mint sold 231,500 ounces.

Sales of the American Eagle silver bullion coins are also strong in April, continuing a trend that began with the financial crisis in 2008.  Sales of the silver bullion coins through April 16th total 2.2 million ounces.  If the current sales pace continues through the end of April total sales of the Silver Eagle coins will increase by 31% over the previous month.

Short term speculators may be crashing the precious metals markets, but long term investors in gold and silver see this as the ultimate golden opportunity to increase positions.


Where Does Silver Go From Here?

silver-eagleBy: GE Christenson

You bought silver with high expectations! Then it crashed while endless news reports informed you that silver would drop even further. Frustration! Misery! Despair! Depression! You have lived it all. There was no light at the end of the tunnel.

Darkness and despair covered the land of silver. There was no joy in silver-ville.

But, then from the depths of despair and ugly bearish sentiment, a rally materialized. But, not just a small rally, a HUGE RALLY – TOTALLY AWESOME! The price doubled in a few months. Then it paused, scared some of us out, and rallied even further. You heard that silver was going to $100 or maybe $200 per ounce. Analysts outdid each other with higher and higher projections. You congratulated yourself on your foresight and financial acuity by investing in silver – sheer genius – forgetting that you almost sold out for a loss at the bottom. The manic phase is great while it lasts…

Silver rallied, and you waited for even higher prices before you sold. If you were rational or just lucky, you sold out before it crashed 25% in a week. If you did not sell out, you screamed to anyone who would listen, “they crashed it,” and “I should have sold out before the crash,” and “it’s not fair.”

Silver investing felt like a bipolar roller coaster ride – manic up followed by depressing down. You began to self-medicate with alcohol and wishful thinking. You sought out others who agreed with you, told you what you wanted to hear, and…

… it goes on and on.

STOP!

I repeat. STOP with the bipolar behavior, the delusional thinking, the self-medicating, and the emotionally debilitating ups and downs. It is not good for your physical, emotional, or financial health. Just stop, hit the silver reset button, and reassess.

  • Silver is heavily manipulated by the big players (JP Morgan, etc.) – what else would you expect? They are in the business to make profits, and their profit at YOUR expense is just fine with them. No need to worry about the DOJ, congress, or any regulators … for obvious reasons. So just admit it, the price is managed and manipulated, the “fix is in,” and that is exactly what we should expect. But, it is still a better investment than most paper.
  • Silver has gone up, from January 1, 2000 (a good place to start) to the LOW in April 2013 about 14% per year. One more time, what is wrong with 14% per year?
  • Silver rallied from under $9 in October 2008 to a high of nearly $49 on April 29, 2011. The next week it crashed to a low of about $35, briefly bounced, and then fell again to a low of about $26 in June of 2012, rallied to about $35 in October, and fell again to about $27 in early April 2013. That was a wild ride on the bipolar silver roller coaster.
  • Since 1971 when Nixon severed the already tenuous link between the dollar and gold and encouraged money creation to accelerate, silver has risen, on average. about 7% per year, compounded annually, for 42 years. It will go higher because the value of paper currency is almost certain to continue its decades’ long decline.
  • Central banks around the world are printing money, expanding the money supply, and doing what they can to suppress the price of gold and silver. Given the financial mess they have created, what choice do they have? So expect money printing and erratic silver rallies to continue.

For your emotional and financial sanity and physical health, get off the bipolar silver roller coaster, buy physical silver, relax, and watch the spectacle as the central banks of the world drive the value of paper currency toward zero and the value of silver to $100 or $200 or $300 per ounce. You own it for insurance and to preserve purchasing power, so there is no need to fixate on the daily or weekly price, except to buy more at bargain prices – like now.

Again: Why do we own silver?

Read:

GE Christenson
aka Deviant Investor

Physical Gold Inventories Plunge As Gold Market Crashes – How Can That Happen?

worldKyle Bass recently summed up the thoughts of many gold investors when he said “the largest central banks in the world, they have all moved to unlimited printing ideology.  Monetary policy happens to be the only game in town.  I am perplexed as to why gold is as low as it is.  I don’t have a great answer for you other than you should maintain a position.”

Gold investors can easily be forgiven for being perplexed, especially when considering that gold prices are plunging at a time when stocks of physical gold are being rapidly depleted at the COMEX warehouses.  Is this just one of life’s unsolvable mysteries or is the gold market being manipulated?  Bill Downey at Gold Trends lays out a solid case on how market manipulation caused last week’s gold collapse and why it makes more sense than ever to increase holdings in physical gold and silver.


There’s been a recent huge draw down of physical gold at the New York COMEX and at the JP Morgan Chase depository. Look at the physical market draw down on the charts below. It has taken a drastic plunge.HOUSTON — we have a problem.Physical inventory drawdown at JPM
Charts by Nick Laird of www.sharelynx.com

GoldInventoryJPMAPril2013
Physical Drawdown at COMEX
Charts by Nick Laird of www.sharelynx.com
GoldInventoryComexApr2013
You can imagine the dilemma this is causing for the market interests behind these inventories. If the inventory runs out and one cannot meet deliveries then it has to be bought on the open market. Not only that but it could cause a run up in prices that would hurt the shorts in the market.So what to do?There is only one way out of this for the market controllers would be to devise a plan that would collapse the market and trip up all the stops at the correction lows in gold of 1525 thereby setting off the stop loss orders under this important market low. And what if the plan included a way to stop the physical market from purchasing gold under 1525 while that correction was underway?

And how can that happen?

They have to hatch out a plan and carefully orchestrate it in a series of events that takes the gold market by surprise and force the players out of their positions.

Read on for today’s lesson in market manipulation and allow me to relay my speculation about what transpired last week.

A successful ambush usually involves surprise.

One of the main new weapons in the FEDS arsenal is TRANSPARENCY.

After a lifetime of silence the FED all of a sudden has come out of the closet and has decided that the best thing for the market is to be transparent and to that end they now have televised communication meetings with the general public so chairman Bernanke can explain the FED policy and answer any questions that the market has on its mind as well as the usual minutes that get released to the markets that review the policy decisions and discussion of prior meetings.

Why does the Fed need to explain what they are doing now?

Well it isn’t because everything is going just fine. Put it this way. They must figure when you have 50 million people on food stamps and the Dow Jones is going up a few hundred points a week and making all time highs and you have 16 trillion dollars in debt and interest rates are zero, its best to have a communiqué every month before someone asks you to explain what is going on. It’s called staying ahead of the curve if you will. If you tell them what’s going on it makes it look like you know what you’re doing. Otherwise all we have is the statistics and by themselves they tell you something is wrong, something is terribly wrong. So they have become transparent.

During the last communiqué the chairman made it abundantly clear that QE was here to stay until the unemployment rate reached acceptable levels. This communiqué whether by personal appearance or by releasing the FOMC minutes of the prior meeting is something the FED relies on so market participants can remain comfortable and abreast of Fed monetary policy.

Three strikes and you’re out

The FOMC minutes from the last meeting were due for release during last week. But a funny thing happened. They got released EARLIER than expected. It was all a big mistake and the FED let the SEC and the CFTC know right away that the error had occurred. And lo and behold even with all its transparency there happened to be some language we didn’t get updated on until the FOMC minutes were released. The notes say that several members have been discussing cutting back on the stimulus. That was strike one. It got the gold market thinking that stimulus cuts might be coming.

Strike one

Surprise number two

Then a bombshell was released from news sources. It was reported that Cyprus would have to sell 400 million Euro’s of gold as part of the bailout package of raising money for their failed banking system. Gold prices came down to 1550 on the news and the day passed by. Even though Cyprus bankers tell us the next day that they didn’t discuss selling any gold, market jitters seemed to remain and Friday was just around the corner. This was strike two.

Now we need a strike three and you’re out. Gold is a nervous market to begin with as a lot of people have already lost a lot of money in the last six months.
With Gold at 1550, all that is needed for the market to drop is to get one more push where all the stops are (just below the 2 year low of 1525).

The selling began in the Friday sessions overseas. By time we got to the New York COMEX gold open, the price was down to 1542. Now all the players are there and the volume and liquidity is there to create the final blow to the market.

And then the attack began. Wave after wave of selling until gold got to 1525. Then they break down the price below the two year low and all the stops that have been accumulating there start getting tripped up and the selling accelerates as it begins to feed on itself. The physical market for gold sees this as a gift and gets ready to make their move and buy up the gold.

Now comes the part that is pure genius or a total coincidental thing that just so happens to be a gift to those who are short the market and those who would be responsible to deliver gold should the inventory deplete.

ALL OF A SUDDEN THE LONDON PHYSICAL PLATFORM THAT BUYS AND SELLS PHYSICAL GOLD GETS LOCKED UP. THE SYSTEM FREEZES.

continue reading here.


Panic Selling Crushes Gold and Silver Prices – Bearish Sentiment Reaches Extreme Levels

goldThe precious metal markets, which have been under a constant drumbeat of negative news and bearish price forecasts for months, sold off sharply today.   Bearish investors seemed to reach the “give up” stage as gold and silver fell below key technical levels.  Panic selling continued to cascade throughout the day as precious metal investors hit the sell button and buyers stepped aside.

By the end of the trading day, gold dropped an astonishing $84 per ounce to close at $1,478, down over 5% on the day and below $1,500 per ounce for the first time since July 5, 2011.   Silver had an even worse day with a price decline of 6.5%, closing down $1.81 per ounce at $25.95.

Analysts had multiple reasons for the huge decline in gold and silver prices including the belief that inflation will remain subdued and the Federal Reserve would begin to slow the pace of monetary stimulus later this year.  In addition, many trend following investors are repositioning out of precious metals into other investment opportunities such as stocks which have appreciated by over 100% since the depths of the financial crisis.  By contrast, gold and silver  have been unable to breach highs reached in mid 2011.

Also weighing on investor’s mind was the fear that the proposed sale of over $500 million of Cyprus gold reserves would further pressure gold prices.  Comments in the Wall Street Journal suggested that other countries may also be forced to sell their gold reserves.

The news about Cyprus “gets people to wonder: Will there be central-bank liquidation of gold when other countries get into trouble?” said Adam Klopfenstein, senior market strategist with Archer Financial Services in Chicago. “Selling gold might be the new caveat for any future [bailout] deals.”

The match that ignited the explosive move to the downside was struck on Wednesday when Bloomberg reported that Goldman Sachs predicted sharply lower gold prices and suggested that investors actually short the gold market.

The turn in the gold price cycle is accelerating after a 12-year rally as the recovery in the U.S. economy gains momentum, according to Goldman Sachs Group Inc., which reduced forecasts for the metal through 2014.

The bank cut its three-month target to $1,530 an ounce from $1,615 and lowered the six- and 12-month predictions to $1,490 and $1,390 from $1,600 and $1,550. Goldman recommended closing a long Comex gold position initiated on Oct. 11, 2010 for a potential gain of $219 an ounce, analysts Damien Courvalin and Jeffrey Currie wrote in a report today.

“Despite resurgence in euro-area risk aversion and disappointing U.S. economic data, gold prices are unchanged over the past month, highlighting how conviction in holding gold is quickly waning,” the Goldman analysts wrote in the report. “While higher inflation may be the catalyst for the next gold cycle, this is likely several years away.”

Goldman cut its 2013 gold estimate to $1,545 an ounce from $1,610, trimmed its 2014 forecast to $1,350 from $1,490, and set year-end targets of $1,450 in 2013 and $1,270 in 2014. Goldman recommended starting a short Comex gold position, targeting $1,450 with a stop at $1,650, the analysts wrote.

Ironically, the biggest worry for gold and silver investors now comes from the precious metal ETFs, which greatly contributed to the precious metals bull market as investors poured billions of dollars in the SPDR Gold Shares (GLD) and the iShares Silver Trust (SLV).  If investors in the GLD and SLV initiate panic liquidations, a sharp rebound in gold prices may be wishful thinking despite today’s huge sell off.  According to Goldman Sachs,  “The fall in prices could end up being faster and larger than our forecast, as aggregate speculative net long positions across Comex futures and gold ETFs remain near record highs.”

COURTESY: STOCKCHARTS.COM

COURTESY: STOCKCHARTS.COM

COURTESY: STOCKCHARTS.COM

COURTESY: STOCKCHARTS.COM

The bearish sentiment and price action on gold and silver seemed to have reached extreme levels.  Does anyone hear a contrarian bell ringing?

The Financial System Has Reached The Implosion Point

coinA profound thanks to all the short term fickle speculators in gold and silver who have shifted their portfolio allocations to stocks, bank accounts and certificates of confiscation government bonds .  The shift to paper assets has provided what will in hindsight be the best buying opportunity for gold and silver since the crash of 2008.

BY:  GE Christenson

March and April 2013 may go down in history as the tipping point for the western financial system.

We have already seen:

  • Lehman Brothers and many other financial firms collapse.
  • $700 Billion in TARP funds arranged by banking insiders for banking insiders at the expense of US taxpayers.
  • Over $16 Trillion in bailouts, guarantees, swaps, and loans created by the Fed and given to various banks, nations, and other insiders.
  • MFGlobal took “segregated” customer funds, the exchange provided no compensation to customers, and yet no criminal indictments have been issued.
  • Global derivatives total $700 Trillion to well over $1,000 Trillion, depending on who is counting. Some are “toxic waste.”
  • Many European bailouts and “fixes.”
  • Spain, Italy, Slovenia, and perhaps France in trouble.
  • US official debt approaching $17 Trillion with unfunded liabilities many times larger.
  • The Federal Reserve creating $85 Billion per month (over $115,000,000 per hour) to support banks and the US government.

So what other disasters could occur? In a word, Cyprus!

  • Not because the EU and Cyprus took Russian money.
  • Not because several banks will close.
  • Not because some deposits will be confiscated and/or frozen.

In my opinion, the sign that a tipping point has occurred in the financial system is the real story:

  • The veil of banker honesty has been lifted. The EU/IMF/ECB will do whatever is necessary to support the banks, even if it means they will confiscate (tax, steal, bail-in) customer deposits.
  • Customer deposits are NOT assets held in the bank for safe-keeping, but are liabilities of the bank and are not guaranteed to be made whole.
  • Billions of dollars were removed prior to the Cyprus freeze, so insiders clearly knew in advance of the ordinary depositors (see below). There is no “level playing field” when billions of dollars/euros are in play.
  • According to Jeroen Dijsselbloem, Dutch finance minister and Euro Group President, this is “the template for any future bank bailouts.” In other words, your deposits are considerably less safe than you thought. Your bank could fail, and your deposits might be used to compensate for derivative losses or other losses that the bank incurred.
  • The FDIC in the US, as well as England, Canada, and New Zealand, has announced similar policies, agreements, and plans to confiscate deposits in the case of an emergency. Is this a sign that an emergency is not only possible but probable and imminent?
  • Confidence in the banking and financial system has been seriously damaged, perhaps irreversibly.

Following are a few quotes from respected commentators:

Jim Sinclair: If the fools that have attacked Cyprus persist then it is the start of an avalanche that will destroy confidence in fiat currency, the fractional reserve system and central banks. What are the central bankers terrified of? My answer is the mountain of old OTC derivative coming home to roost.” Link.

Tyler Durden: “With every passing day, it becomes clearer and clearer the Cyprus deposit confiscation “news” was the most unsurprising outcome for the nation’s financial system and was known by virtually everyone on the ground days and weeks in advance: first it was disclosed that Russians had been pulling their money, then it was suggested the president himself had made sure some €21 million of his family’s money was parked safely in London, then we showed a massive surge in Cyprus deposit outflows in February, and now the latest news is that a list of 132 companies and individuals has emerged who withdrew their €-denominated deposits in the two weeks from March 1 to March 15, among which the previously noted company Loutsios & Sons which is alleged to have ties with the current Cypriot president Anastasiadis.” Link.

Peter Cooper: “Depositors in the beleaguered Bank of Cyprus are now facing losses of 60 per cent on deposits over 100,000 euros as the Cyprus Government seems to have woken up to the fact that this is its last chance to steal money off these mainly foreign depositors. It’s an absolute travesty and a red letter day for European Union banks…

“Money in EU bank accounts is clearly now up for grabs by any government that recapitalizes its banking sector. Moreover, the Cyprus precedent is going to cause a run on the weaker banks that will make this sort of recapitalization inevitable. Standby for a systemic banking crisis in the EU…

“What the EU has done in Cyprus is the modern equivalent of the failure of the Credit Anstaldt in 1931 that brought on the Great Depression with thousands of banking failures around the world.” Link.

Jim Sinclair: “I believe Cyprus is the defining moment whereby the physical market for gold overtakes the paper market for gold as the arbiter of price. When that occurred in 1979 the price of gold began its move to seek its maximum valuation.” Link.

Julian DW Phillips: “When it was announced [in Cyprus] that both large and small depositors were to have a percentage of their deposits seized, it was not the amount that horrified the world but the discovery that you do not own your own bank deposits… Most investors worldwide are of the belief that when you deposit your money in a bank, it simply has safe-keeping of that money. The realization that you have lent the bank your money and are an “Unsecured Creditor” of the bank is an unpleasant revelation.” Link.

Michael Snyder: “What you are about to see absolutely amazed me when I first saw it. The Canadian government is actually proposing that what just happened in Cyprus should be used as a blueprint for future bank failures up in Canada.

The following comes from pages 144 and 145 of “Economic Action Plan 2013″ which you can find right here. Apparently the goal is to find a way to rescue “systemically important banks” without the use of taxpayer funds…”

“In addition, branches of the two largest banks in Cyprus were kept open in Moscow and London even after all of the banks in Cyprus itself were shut down. So wealthy Russians and wealthy Brits have been able to take all of their money out of those banks while the people of Cyprus have been unable to…”

“The global elite are fundamentally changing the game. From now on, no bank account on earth will ever be able to be considered “100% safe” again. This is going to create an atmosphere of fear and panic, and no financial system can operate normally when you destroy the confidence that people have in it.

Confidence is a funny thing – it can take decades to build, but it can be destroyed in a single moment.” Link.

Ellen Brown: “Confiscating the customer deposits in Cyprus banks, it seems, was not a one-off, desperate idea of a few Eurozone “troika” officials scrambling to salvage their balance sheets. A joint paper by the US Federal Deposit Insurance Corporation and the Bank of England dated December 10, 2012, shows that these plans have been long in the making; that they originated with the G20 Financial Stability Board in Basel, Switzerland (discussed earlier here); and that the result will be to deliver clear title to the banks of depositor funds.” Link.

Richard Russell: “I’ve been asked to name one future situation of which I’m most certain. My answer is this – I believe the surest situation (change) in America’s future is a decline, even a drastic decline, in our standard of living. We’ve spent it; we’ve spent what we didn’t have. And somewhere ahead, probably much sooner than we think, will come payback time. And it won’t be pretty.” Link.

Summary

GE Christenson
aka Deviant Investor

Why The Long Term Price of Silver Is Guaranteed To Rise

By: GE Christenson

Walking-Liberty-Half
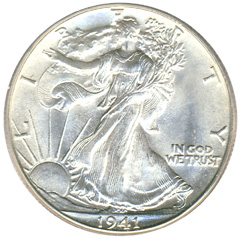
Begin the analysis in 1971 when Nixon dropped the link between the dollar and gold. A pack of Marlboros cost (depending on local taxes) about $0.39. We paid about $0.36 for a gallon of gasoline. The DOW Index was about 850. Silver was priced at about $1.39.

Times have changed! Read Part 1 of Silver – Keep It Simple!

Today we have more currency in circulation, far more debt, and much higher prices – what does it mean?

Examine Graph 1. The prices for retail cigarettes, crude oil, national debt, silver, and the true money supply (TMS) (see notes at end) are shown on a log scale graph with all prices normalized to start at 1.0 in 1971.

Click on image to enlarge.
  • National debt (green line) has increased rapidly since 1971 and even more rapidly, on average, than the other items. (National debt has increased over 12% per year for the last five years.)
  • Silver (black line) and crude oil (red line) prices have been erratic with peaks in the early 1980s, troughs in the late 1990s, and substantial rises since 2001.
  • Cigarettes and TMS have increased steadily since 1971.
  • TMS (also M2, M3, etc.), debt, and most commodity prices have increased exponentially since 1971. Because the dollar was not backed by gold, dollar creation, total debt, and prices increased rapidly.
  • Not shown are some prices that increased more rapidly (medical costs and college tuition) and some that increased more slowly (postage and bread).

Graph 2 shows annual silver and crude prices smoothed with a centered five period moving average. This removes much of the “noise” in the price data and shows longer term trends better. Note that the price of silver actually reached about $50 per ounce in early 1980, but the average daily price in 1980 was only $16.39; the smoothed daily average was about $11.

Click on image to enlarge.

Statistical Correlations

  • Silver prices in dollars (annual average of daily price) correlated with crude prices in dollars (annual average of daily price) at 0.83 – a good correlation. Both are commodities, both are affected by politics, and both are sensitive to money supply, actual inflation, and inflationary expectations.
  • TMS correlated with national debt at 0.99 – a tight correlation. When budget deficits increase the national debt, the money supply expands accordingly.
  • Silver prices (annual average shown) correlated with national debt at 0.67 and with TMS at 0.58. The smoothed silver price correlation to national debt was 0.76 over 40 years and much higher over the past 13 years.
  • Silver prices (smoothed) correlated with crude prices (smoothed) at 0.93 – an excellent correlation.

So What?

  • National debt correlates tightly with TMS. Smoothed silver prices correlate well with both national debt and TMS. We may be apprehensive about future silver prices, but we can be 99.99% certain about the inevitable increase in national debt. Based on the 40 year correlation between silver and national debt, silver prices will continue to rise.
  • Both crude oil and silver are commodities that experience large price volatility. On average, they go up and down together; and, over a 40 year history, their prices have clearly moved substantially higher. I see many reasons to expect both to move higher in the long term.
  • Crude oil is the most important commodity in the world. Its per capita use, on average, is rising and the world’s population is increasing, so demand will remain strong, unless the world suffers a massive financial and economic collapse. Further, the easily available oil has been taken so there is little chance that inexpensive supply will increase. More demand coupled with flat or declining supply requires higher future prices. Higher crude oil prices strongly suggest higher silver prices.
  • Central banks are “printing money” in their desperate attempt to fight deflation, levitate asset prices, bailout banks and countries, and encourage inflation. This guarantees further increases in national debt and TMS and price increases for most commodities including crude oil, cigarettes, and silver.

Price of Silver as a Projection Based on Other Variables

We can construct a calculated price for silver based on three variables – national debt, TMS, and the price of crude oil. Examine Graph 3 of smoothed silver prices and the calculated price of silver based on those three variables. Note that the correlation is 0.86 – quite good. The silver price has both a monetary component (national debt and TMS) and a commodity component (crude oil). Together they produce a simple but effective projection for the smoothed average price of silver over the past 42 years.

Click on image to enlarge.

For the Future

Assume national debt increases 12% per year for the next five years like it has for the past five years. Assume TMS and crude continue their past five year growth rates (11% and 8%). The estimated price for the smoothed average price of silver is about $55 in 2016. The peak price on a spike higher could easily be triple the smoothed price. Look for $100 silver in 2015 – 2017 unless a deflationary collapse occurs – to the detriment of everyone including banks, politicians, and national governments.

Conclusion

Debt, money supply, and the prices for most commodities have exponentially increased over the past 42 years. Prices for crude oil and silver have substantially increased but inconsistently. I can be certain of death and taxes, and I feel confident that the national debt and prices for crude oil, cigarettes, silver, and most other consumer items will drastically increase in the next few years – under circumstances similar to the past 40 years. A hyperinflationary increase is also possible, in which case, all commodity prices will be unbelievably higher. Assuming no deflationary collapse, expect $100 silver relatively soon – perhaps in 2016. Read Past & Future Speculative Bubbles – What They Indicate for Gold and Silver!

GE Christenson
aka Deviant Investor

Silver Bullion Coin Sales Heading for Record Highs In 2013

Sales of the American Eagle silver bullion coins soared in March, continuing a trend of record breaking sales that has been in force for the past five years.

american-silver-eagle
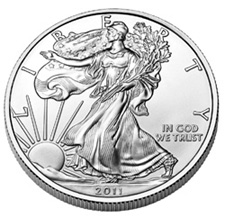
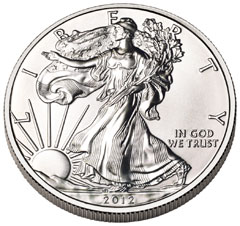
Prior to the financial crisis, sales of the one ounce American silver eagles averaged about 10 million coins per year.  The near collapse of the financial system in 2008 raised profound questions about the integrity of the financial system and the rush to precious metals was on.  Since 2008, annual sales of the American Eagle silver bullion coins have soared with average annual sales of over 31 million coins.

According to the U.S. Mint, sales of the American Eagle silver bullion coins totaled 3,356,500 ounces in March, up 32% from comparable sales of 2,542,000 ounces during March 2012.   Total sales of 14,223,000 ounces through March 31, 2013 soared by 40.3% over the comparable prior year period.

The previous record year for silver bullion coins was in 2011 when 39,868,500 coins were sold. The 2011 record may wind up looking like a low number compared to projected total sales for 2013.  Based on sales for the first three months of the year, annualized sales for 2013 could hit a record shattering 57 million ounces although even this estimate may be too low.  As the slow motion collapse of the European banking system speeds up, the looming specter of  huge losses by bank depositors could create a total loss of confidence in paper money and ignite a panic move into gold and silver.

The U.S. Mint has vastly underestimated demand for the American Eagle silver bullion coins and was recently forced to suspend sales twice as physical demand for silver soared (see U.S. Mint Sold Out).

Since 2000, investors have purchased almost a quarter billion ounces of silver bullion coins from the U.S. Mint, worth almost $7 billion based on the current price of silver.

American Silver Eagle Bullion Coins

YEAR

OUNCES SOLD

2000

                 9,133,000

2001

                 8,827,500

2002

               10,475,500

2003

                 9,153,500

2004

                 9,617,000

2005

                 8,405,000

2006

               10,021,000

2007

                 9,887,000

2008

               19,583,500

2009

               28,766,500

2010

               34,662,500

2011

               39,868,500

2012

33,742,500

2013

14,223,000

TOTAL

            246,366,000

Total sales for 2013 are through March 31, 2013.