April 26, 2024

Gold and Silver Paper and Physical Markets Realign

Late last year and early this year, a continual observation of the gold and silver markets was the disconnect between the prices quoted on paper markets and the prices that you would actually need to pay to buy physical precious metals. In the past few weeks premiums for physical gold and silver have declined as the prices quoted on the paper market have risen, basically bringing the two markets back into alignment.

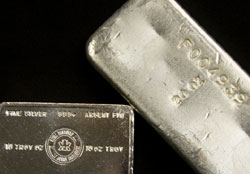
Back in October 2008, I had examined 100 ounce silver bars as an example of the excessive premiums being paid for physical precious metals. I collected some data from recently completed eBay auctions that showed the average price of the 100 ounce silver bar ranging from $1,329 to $1,557 while the market price of silver ranged from $8.88 to $10.89. This represented premiums ranging from $39.62% to 56.45%. This was particularly ridiculous since the 100 ounce silver bar has been traditionally viewed as a low premium method for silver investing.

Reviewing some data for eBay auctions completed yesterday now shows the prices paid for 100 ounce silver bars ranging from $1,450 to $1,500. At yesterday’s closing price of silver of $14.09, this represents a much more reasonable premium of about 3% to 6%.

Peculiarly, the decline in premium is a close match to the increase in price for spot silver. If you invested in silver by buying physical bars back in October, you might be showing zero profit even though the market price is up over 40%.

Future Gold and Silver Price Implications?

When the premiums for physical precious metals were high, it was viewed as a sign of heavy demand amidst a diminished supply that would eventually force market prices to move higher. Now that the disconnect between the paper and physical markets has seemingly resolved itself, is this a signal of slower demand that will lead to lower prices?

Despite the implication of slower demand, I think the realignment of the markets represents a long term positive for the price of gold and silver. Back when premiums were high, I am sure that many potential investors backed away from the market when they were faced with excessive premiums. Potential investors will now actually be able to buy physical gold and silver around the market prices. This is a much better environment for fostering mainstream demand to keep gold and silver moving higher.
[phpbay]100 ounce silver bar, 3, “”, “”[/phpbay]
Is the Silver Eagle Shortage Ending?

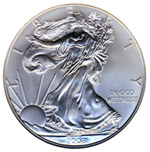
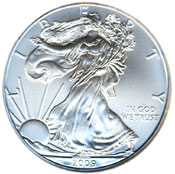
World mints have struggled to keep up with the booming demand for precious metals. The situation has been ongoing for more than a year and frustrated physical silver investors with suspensions, rationing, and delays. There are finally some signs that the shortage may be coming to an end, in particular for the American Silver Eagle bullion coin.
The Silver Eagle shortage first began in February 2008. The US Mint became so overwhelmed with orders for the popular silver bullion coin that they were forced to suspend taking new orders. The suspension was only in place until March 2009, however, sales were resumed on a rationed basis. Authorized purchasers were limited in the number of coins that they could order. Early suggestions indicated that the rationed amounts covered only a fraction of the overall demand.

More than one year later, there are some indications that the situation may finally be abating. As I mentioned in my post on the US Mint’s March 2009 Bullion Sales, sales of silver and gold reached extremely high levels. Sales of silver coins were actually the highest monthly total since 1986. Since these are rationed sales, the high level was more of an indication of reduced supply constraints than increased demand.

Recently, there have been more indications at the dealer level that the shortage may be ending. One  dealer has reported that delays for delivery of Silver Eagles are shortening, and premiums for the coins is declining. At the height of the shortage premiums were as high as $4.50 over the spot price of silver. Premiums have now pulled back to around $3.00 over spot.

Gold, Silver & Platinum 2009 First Quarter Performance

With the first quarter at an end, let’s take a look at the performance of gold, silver, and platinum so far this year.
When putting the numbers together, I knew what to expect, but its still surprising to see where the final numbers landed. Gold, silver, and platinum’s performance relative to one another has basically been turned upside down from the 2008 annual performance.

2009 First Quarter Gold, Silver, and Platinum Performance
30-Dec-08 31-Mar-09 Change Percent
Gold 869.75 916.50 46.75 5.38%
Silver 10.79 13.11 2.32 21.50%
Platinum 898.00 1,124.00 226.00 25.17%

For 2008, gold had performed the best with a gain of 4.32%, followed by silver with a loss of 26.90%, with platinum in last place with a loss of 41.31%.

As you can see the performance for the first quarter of 2009 has been the opposite with platinum performing best with a gain of 25.17%, followed by silver with a gain of 21.50%, with gold in last place with a gain of 5.38%.

Platinum and silver were in some respects recovering from the beating they took last year. Over the past several years gold has emerged as more of a steady performer, as compared to the more volatile performance of the other metals, commodities, equities, real estate, etc. It’s ironic that whenever a mainstream publication discusses the possibility of investing in gold, they never fail to caution about gold’s “volatile” prices.

At any rate, precious metals outperformed stocks for the quarter, mostly by a wide margin. The Dow, S&P 500, and Nasdaq lost 14.29%, 12.81%, and 3.07% respectively.

Silver Investment Demand

In a previous post, I reviewed the amount of silver bullion sold by the United States Mint during 2008. With this post, I will take a longer term look at silver demand, which highlights the absolute explosion in demand which has occurred in recent years.

The supporting data for the charts included with this post comes from a new section of Gold and Silver Blog which collects the US Mint Silver Bullion Sales data since the inception of the program in 1986. You can visit the page to find the monthly sales figures for any date from 1986 to present. The section also calculates the approximate silver bullion value of each period’s sales based on the average monthly price of silver.

Silver Bullion Sales in Ounces

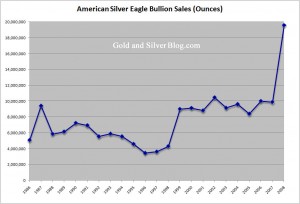
Here’s a chart summarizing the total ounces of silver bullion sold by the US Mint each year since 1986. (Click on the chart for a larger version.)

During 2008, the US Mint sold 19,583,500 ounces of silver through its bullion program. As explored previously, this marks an all time high for the program. It represents an increase of more than 98% from the prior year, and an increase of 92% from the previous all time high reached in 2002.

One important thing to note when considering the magnitude of the increase for 2008 is that the number of ounces sold could have been much greater. The US Mint suspended silver bullion sales during February before resuming sales on a rationed basis. When the rationing first began, one dealer claimed that he could have sold 500,000 ounces of silver per week, but was only allocated 100,000 ounces.

2008 Silver Bullion Sales in Dollars

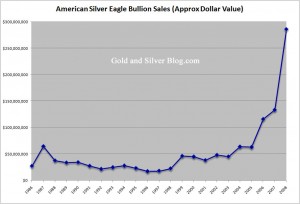
Here’s a second chart which illustrates the explosion in demand for silver in even more dramatic fashion. The chart shows the approximate dollar value of silver bullion sold by the US Mint each year. As mentioned, this was calculated based on monthly silver bullion sales and the average monthly price of silver. (Click on the chart for a larger version.)

Silver Bullion Sales Value Chart

During 2008, The US Mint recorded silver bullion sales of approximately $286,451,715. This marks an all time high and an increase of 114% from the prior year, which was also the prior all time high.

The magnitude of the increase is more pronounced when compared to silver bullion sales from earlier years of the program. Throughout the majority of the 1990’s, the US Mint was selling less than $30 million worth of silver each year. The year for the lowest value of silver bullion sold was 1996 with $17,434,050. During 2008, the US Mint recorded monthly sales exceeding this level for ten out of twelve months.

Silver Bullion Sales and the Price of Silver

But what about the price of silver amidst this explosion in demand?

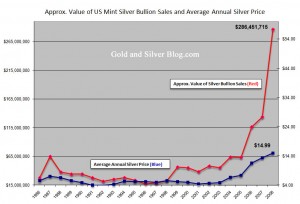
Here’s a third chart which plots the value of US Mint silver bullion sales from the last chart, together with the average annual price of silver for each year. (Click on the chart for a larger version.)

Silver bullion sales increased from a low of $17,434,050 to last year’s high of $286,451,715 representing an increase of 1,543%. The average annual price of silver increased from a low of $3.95 per ounce to last year’s high of $14.99 representing an increase of 203%. While this is a respectable gain, it pales in comparison to the increase in demand.

Everyone has been waiting for the disconnect between the demand for silver and the price of silver to resolve itself. Will it finally happen in 2009?
[phpbay]2009 silver eagle, 3, 39488, “”[/phpbay]

US Mint Raises Premiums on Silver Eagle Bullion Coins (Again)

Today, the United States Mint published notification that they would be raising the premiums charged for American Silver Eagle bullion coins. This refers to the premium above the price of silver at which the US Mint sells the bullion coins to Authorized Purchasers. The premium will increase from $1.40 per coin to $1.50 per coin. The increase will be effective from February 9, 2009.
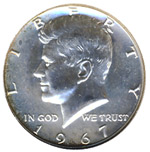
The US Mint cited the recent price increase for “raw materials silver” as the reason for the increase. Less than four months ago on October 14, 2008, the US Mint had raised premiums from $1.25 per coin to $1.40 per coin. At that time they had cited “increases in the cost of acquiring silver blanks.”

Silver Eagle bullion coins sold by the US Mint continue to be subject to rationing. This “allocation program” has been in place since April 2008 as the US Mint’s solution to the ongoing overwhelming demand for silver. I am sure most would prefer to pay even higher premiums for Silver Eagles if they were allowed to buy the coins in unrestricted quantities.

The full notification of the current premium increase as published in the Federal Register is included below.

[Federal Register: January 27, 2009 (Volume 74, Number 16)]
[Notices]
[Page 4830]
From the Federal Register Online via GPO Access [wais.access.gpo.gov]
[DOCID:fr27ja09-87]

DEPARTMENT OF THE TREASURY

United States Mint

Notification of United States Mint Silver Eagle Bullion Coin Premium Increase

ACTION: Notification of United States Mint Silver Eagle Bullion Coin Premium Increase.

SUMMARY: The United States Mint is increasing the premium charged to Authorized Purchasers for American Eagle Silver Bullion Coins, a program authorized under 31 U.S.C. 5112(e). Because of the recent price increase for the premium for raw materials silver, the United States Mint will increase the premium charged to Authorized Purchasers for American Eagle Silver Bullion Coins, from $1.40 to $1.50 per coin, for all orders accepted on or after February 9, 2009.

Authority: 31 U.S.C. 5112(e)-(f) & 9701.

Dated: January 22, 2009.
Edmund C. Moy,
Director, United States Mint

2008 Gold, Platinum & Silver Performance

As trillions of dollars in equity values were vaporized this year, a strong November and December performance pushed gold into positive territory by year end. Gold’s annual gain was 4.32%. This marks gold’s eighth consecutive annual gain. The “lost decade” for stocks, has been quite the opposite for gold. Silver and platinum were less fortunate, posting losses of 26.90% and 41.31% respectively.

(Figures calculated from Kitco’s London PM Fix prices)

The headline numbers only tell part of the story. I rounded up a bit more data which paints a more complete picture of the 2008 performance of gold, silver, and platinum.

Gold Silver Platinum
Dec 31, 2007 Close 833.75 14.76 1530.00
Dec 31, 2008 Close 869.75 10.79 898.00
Annual Change +36.00 -3.97 -632.00
Percentage Change +4.32% -26.90% -41.31%
2008 Low 712.50 8.88 763.00
Change from start to low -121.25 -5.88 -767.00
Percentage Change -14.54% -39.84% -50.13%
2008 High 1011.25 20.92 2273.00
Change from start to high +177.50 +6.16 +743.00
Percentage Change +21.29% +41.73% +48.56%

The first section of the table above shows the performance of gold, silver, and platinum from start to finish during 2008. The second section lists the lowest closing price for each metal during 2008, and calculates the percentage change from the start of the year to the low price. The final section lists the highest closing price for each metal during the year, and the percentage change from start of the year to the high price.

Some observations:

Often when the mainstream press writes about gold as a potential investment option, they usually caution that prices are “extremely volatile.” A look at the figures above shows otherwise. While it seemed like a year of extremes for gold, at its lowest it was down 14% and at its highest it was up 21%, probably making it one of the least volatile investments of 2008.

Platinum, which is starting to draw my interest, basically went straight up during the month of February to its peak price of $2,273 per ounce. Then it experienced three months of nearly continuous declines from mid-July to mid-October where it reached its low of $743 per ounce. At its high it was up nearly 50%, at its low it was down more than 50%. Briefly, the price of gold exceeded the price of platinum, but the situation has now reverted to the norm.

Silver experienced a similar plight, up more than 40% at its peak and down more than 40% at its low. The period of decline also took place from mid-July to mid-October. Many have pointed to the enormous concentrated short position taken by a handful of banks in July as responsible for the decline.

On a housekeeping note:

Sorry for the lack of posting on Gold and Silver Blog during the end of December. I should be back on a regular schedule for the new year. I aso plan to add some new sections to the site, which compile historical data relevant to gold and silver watchers. Thanks for reading and let’s make 2009 a great year!

US Mint 2008 Gold and Silver Dwindle, 2009 Releases Delayed

The United States Mint recently released a memo to authorized bullion purchasers regarding the remaining 2008-dated bullion coins and the upcoming 2009-dated bullion coins.

The only 2008 dated bullion coins still being sold by the US Mint are the 1 ounce American Gold Eagle and 1 ounce American Silver Eagle. Final allocations for these coins will take place December 15, 2008. All of the fractional Gold Eagles, Gold Buffaloes, and Platinum Eagles are no longer available.

Sales of 2009-dated 1 ounce Gold Eagles and 1 ounce Silver Eagles will begin on December 29, 2008. Availability will be subject to allocation. The remaining 2009-dated bullion coins will be delayed. The US Mint cites “very limited” supplies of blanks from suppliers amidst high demand.

The full US Mint memo is reproduced below:

November 24, 2008

MEMORANDUM TO ALL AMERICAN EAGLE AND AMERICAN BUFFALO BULLION COIN AUTHORIZED PURCHASERS

SUBJECT: 2008 and 2009-Dated Bullion Coin Products

With the exception of the American Eagle Gold One-Ounce and American Eagle Silver One-Ounce Bullion Coins, all 2008-dated bullion coins have been depleted. Weekly allocations will continue for these two products.

The final 2008 allocation for these coins will be provided on Monday, December 15, 2008.

There will be no bullion allocations during the week of December 22, 2008.

2009-dated American Eagle Gold One-Ounce and American Eagle Silver One-Ounce Bullion Coins will be made available for sale via the standard allocation process on Monday, December 29, for pricing December 30 and order pick-up on Friday, January 2, 2009.

Allocations for these products will continue until the United States Mint is able to meet demand.

The quantities of blanks that we have been able to acquire from our suppliers continue to be very limited, while demand for bullion coins remains high. As a result, it is necessary for the United States Mint to delay the launch of other bullion coins until later in 2009. We will continue to monitor the situation and keep you informed as additional information becomes available.

Thank you for your patience and your continued support of the United States Mint Bullion Coin Program.

Buying Physical Silver at the Lowest Premium

If you’ve tried buying physical silver recently, then you are undoubtedly aware of the incredibly high premiums charged above market value. I wrote previously about the premiums for 100 ounce silver bars, which are traditionally a low premium method for acquiring silver. At the time of investigation, premiums were running from 40% to 50%  above the market price of silver.
Premiums for virtually all other methods of acquiring physical silver are also stubbornly high. American Silver Eagles, Canadian Silver Maple Leafs, and other government issued bullion coins carry premiums often well in excess of 50%. The same high premiums persist for generic silver rounds, small size bars, and bags of 90% junk silver. Even 1,000 ounce silver bars are now carrying premiums of 25% to 30%. Many people have been actively looking for the method which will provide the absolute lowest premiums.

One area that I have noticed which seems to offer the lowest premiums is 40% junk silver coins. For those unfamiliar with the term, “junk silver” refers to legal tender coins with silver content, which have little or no collectible value. These coins are bought and sold based on the value of the silver content. In the United States, dimes, quarters, half dollars, and dollars were minted in 90% silver before 1965. A lesser known fact is that from 1965 to 1970, half dollar coins were minted in 40% silver.

While bags of 90% junk silver coins carry premiums in excess of 50%, bags of 40% junk silver coins can be found with premiums as low as 20%. A bag of $1,000 face value 40% silver coins, which contains roughly 295 ounces of pure silver, can be bought for around $3,500. This can be confirmed on various bullion dealer websites, as well as through a survey of completed eBay auctions. Bullion dealers typically sell junk silver in $1,000 or $500 face value bags, while eBay usually has listings for much smaller lots. I’ve found that even these smaller lots sell for around the same relatively low premiums of 20% to 25%.

Why are the premiums so low? Some people consider 40% silver coins too bulky and inconvenient. If you acquire 90% junk silver, you would have the same silver content in less than half the weight and volume. But in today’s environment, aren’t the lower premiums well worth the trade off? In reality, I think this is more of an overlooked area. Perhaps as time moves on and people start to take note, premiums will rise to the same levels as other physical silver options.

Premiums for 100 Ounce Silver Bars

There has been much recent coverage of the rising premiums being paid to purchase physical gold and silver bullion. This has been cited as a consequence of the extreme demand for precious metals and evidence of the growing disconnect between market prices and physical prices.

I decided to look at some data to calculate exactly what kind of premiums are being paid and see if any trend or patterns in the data could be determined.

Specifically, I looked at selling prices for 100 ounce silver bars on eBay. I decided to use this as a source of data since 100 ounce silver bars have historically been a low premium method to acquire silver.  Also, bars of silver are relatively undifferentiated. Bullion coins from different countries or with different dates often carry premiums based on those differences.

I used eBay data because it was accessible. Completed auction records can be obtained for the prior two weeks or more. Also, I believe that eBay represents a real time, liquid market of buyers and sellers who discover prices through a bidding process. Quoted dealer prices may be for delivery at a later date and may not represent actual available supplies.

There are some possible flaws with this method. It does not take into account potential premiums for different manufacturers. I don’t know if people pay more for different makes of bars. Also, shipping costs are not included in the price data used. Some auctions may carry higher shipping charges which would impact the final selling prices. And lastly, some auctions were “true auctions” which start at a minimal opening bid while others were fixed price listings.

Data was available from October 13 to today’s date. I did not include data for today or October 13, since it may represent partial data. I determined the average price for each day’s auctions which closed with a sale. I compared this to the closing market price of silver for each day.

Here is a summary of the data:

Average Price for 100 Ounce Silver Bars on eBay Compared to Market Price of Silver

Date Bars Sold Ave Price Market Price Premium Premium %
14-Oct 12 $1,557.17 $10.89 $468.17 42.99%
15-Oct 10 $1,524.70 $10.92 $432.70 39.62%
16-Oct 29 $1,465.07 $9.99 $466.07 46.65%
17-Oct 19 $1,427.68 $9.56 $471.68 49.34%
18-Oct 28 $1,422.00 $9.56 $466.00 48.74%
19-Oct 46 $1,419.04 $9.56 $463.04 48.44%
20-Oct 21 $1,431.76 $9.79 $452.76 46.25%
21-Oct 17 $1,391.94 $9.86 $405.94 41.17%
22-Oct 19 $1,428.11 $9.84 $444.11 45.13%
23-Oct 25 $1,382.84 $9.34 $448.84 48.06%
24-Oct 37 $1,367.78 $8.88 $479.78 54.03%
25-Oct 13 $1,389.31 $8.88 $501.31 56.45%
26-Oct 33 $1,329.91 $8.88 $441.91 49.76%
27-Oct 15 $1,337.33 $9.01 $436.33 48.43%

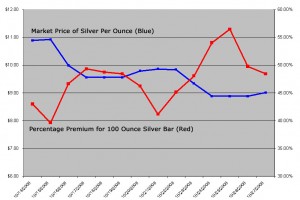
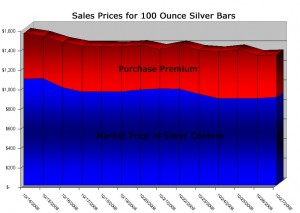
Some charts based on this data appear to the right. (Click for larger versions) The data is only for a limited time frame, but it does spur some interesting observations.

The premium paid for a 100 ounce silver bar has ranged from 39.62% to 56.45%. The premium represents the amount paid in excess of the so-called “market price” of silver. People are clearly paying astounding premiums to acquire physical silver.

On October 15 and 22, the market price of silver dropped. In each instance this caused the percentage premium to rise. This lends some evidence to the anecdotal observation that a decline in market price only spurs greater demand for the physical metal.

Two distinct prices for silver seem to exist. The paper price for the contractual right to acquire future silver, and the physical price to acquire real silver, in hand. How and when will this situation resolve itself?

There have been several recent reports of bullion buyers seeking to take physical delivery of silver and gold from the COMEX. This would allow buyers to purchase real silver at the heretofore “fictional” paper price. If these deliveries take place and become a dependable source of purchasing physical silver, premiums for 100 ounce bars and other physical silver would likely begin to subside.

On the other hand, some are voicing the possibility that since the COMEX only has small coverage of physical metal for outstanding contacts, if enough contact holders demand delivery they will be forced to default and settle in cash. If this occurs, the likely result would be soaring market prices for silver and potentially greater premiums as the argument for physical scarcity gains another leg of support.
[phpbay]100 silver bar, 3, 39489, “”[/phpbay]