May 16, 2024

Measuring Declines from the High for Gold and Silver Prices

The prices of gold and silver had each risen to fresh all time highs, just before the severe declines experienced over the past few days.

On April 25, 2011, the price of silver touched an intraday high of $49.82 per ounce. This narrowly eclipsed the previous all time high of $49.45 reached in 1980. Silver’s recent price of $34.64 represents a decline of $15.18 or 30.47%.

After breaking above the $1,450 per ounce level in early April, the price of gold had achieved a string of new all time highs. This culminated with the most recent high of $1,577.40 per ounce reached on May 2, 2011. The recent gold price of $1,473.60 per ounce represents a decline of $103.80 or 6.58%.

The severity of the decline for silver has drastically altered the Gold Silver Ratio. This ratio measures the number of ounces of silver necessary to purchase one ounce of gold. At their respective highs, the ratio would have been 31.65. Recent prices put the ratio at 42.54.

Gold

Recent High: $1,577.40 (May 2, 2011)
Recent Price: $1,473.60 (May 5, 2011)
Decline: -$103.80 (-6.58%)

Silver

Recent High: $49.82 (April 25, 2011)
Recent Price: $34.64 (May 5, 2011)
Decline: -$15.18 (-30.47%)

Gold and silver’s stellar performance over the past several years has been interrupted by other declines, some of them even more drastic. From intermediary peaks reached in March 2008, gold and silver fell sharply as the financial world melted down later that year. Gold fell from $1,011.25 to $712.50 per ounce, losing 29.54%. Silver fell from $20.92 per ounce to $8.88, for a loss of 57.55%.

Despite the recent carnage, both gold and silver hold onto gains for the year to date. From the price levels on December 31, 2010, gold is up $63.35 per ounce or 4.49% and silver is up $4.01 per ounce of 13.09%.
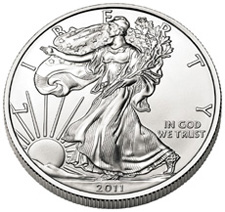
US Mint Gold and Silver Bullion Coin Sales By Month

Through the end of April, the United States Mint has now sold 466,000 ounces of gold and 16,375,000 ounces of silver through its bullion coin programs. In both cases the figures are far ahead of the numbers from the comparable year ago period, despite the higher market price per ounce for the bullion.
Last year through the end of April, US Mint gold bullion sales were 388,000 troy ounces, while the price of gold ranged from a low of $1,058.00 to a high of $1,179.25 per ounce. Silver bullion sales during this period were 11,531,000 with the market price ranging from a low of $15.14 to a high of $18.84 per ounce.

US Mint Gold and Silver Bullion Sales (in ounces)

January February March April Total
American Gold Eagle 133,500 92,500 73,500 108,000 407,500
American Gold Buffalo 38,000 20,500 58,500
Total Gold in ounces 133,500 92,500 111,500 128,500 466,000
American Silver Eagle 6,422,000 3,240,000 2,767,000 2,819,000 15,248,000
ATB Silver 1,127,000 1,127,000
Total Silver in ounces 6,422,000 3,240,000 2,767,000 3,946,000 16,375,000

During the latest month of April 2011, the US Mint recorded sales of 128,500 troy ounces of gold bullion, comprised of 108,000 ounces worth of American Gold Eagles and 20,500 ounces worth of American Gold Buffaloes.

Meanwhile, silver bullion sales for the latest month reached 3,946,000 ounces, the second highest level of the year. For three months running, the pace of sales for the American Silver Eagles had remained approximately the same base level, despite indications of higher demand. The restrained sales are presumably the impact of the US Mint’s allocation program, which rations the available number of bullion coins amongst the authorized purchasers.

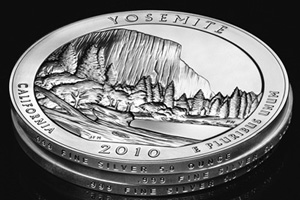
The boost in silver bullion sales seen in April was due to the release of the 2011-dated America the Beautiful Silver Bullion Coins. These coins each contain five troy ounces of silver and have a diameter of 3 inches. Sales began on April 25, 2011, and authorized purchasers immediately purchased coins accounting for 1,127,000 troy ounces of silver.

COMEX Increases Silver Margin Requirements for Third Time in Past Week

On Tuesday, May 3rd, the COMEX raised margin requirements for trading silver futures contracts. This was the third increase in the past week.
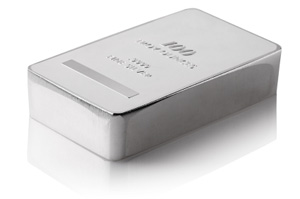
The new margin requirement per contract was increased from $14,513 to $16,200 for initial margin and from $10,750 to $12,000 for maintenance margin.  Hedgers in silver futures pay maintenance margin as initial margin while traders are required to post the higher initial margin amounts.

Effective last Friday, the COMEX had also increased initial margin from $12,825 to $14,513 and from $9,500 to $10,750 for maintenance deposits.

Two days prior to this, the COMEX had also raised margin requirements. On April 27th, margin for initial contracts were increased from $11,745 to $12,825 and margin for maintenance contracts was increased from $8,700 to $9,500.

The CME Group, which owns the COMEX, has been raising margin requirements in an attempt to reduce volatility and protect itself from potential losses generated by large price moves.  As recently as early February the initial margin requirement per silver contract was only $6,075.

Although margin requirements have been raised significantly, the margin required as a percentage of total contract value has remained within a relatively narrow range of between 6 and 8 percent.   The increase in COMEX margin requirements have merely tracked the increase in the price of silver.

Under current margin requirements, a price decline of 8% could wipe out the margin of a silver trader leaving the COMEX exposed to potential losses if the trader does not come up with additional cash.  As silver prices have climbed almost nonstop, the COMEX has raised margin requirements ten times over the past year in order to maintain the same percentage of margin to the silver value represented by one contract.

Even with the higher margin requirements, silver futures contracts allow a trader to make a highly leveraged investment.  One silver futures contract is for 5,000 ounces worth $218,050 at yesterday’s closing London Fix Price.  The new higher margin requirement of $16,200 represents only 7.43% of the value of  one silver futures contract.

After trading close to the $50 per ounce level late last week, silver closed Tuesday at $41.72 in New York trading for a loss of over $8 or 16% over the past two days.

Silver Institute Details Silver Demand and Supply Fundamentals

According to the  just released World Silver Survey published by the Silver Institute, global investment and fabrication demand were the primary factors that pushed silver prices higher in 2010.  Of major note among the many statistics released by the Institute, is the fact that despite rising prices and increased demand, mine production of silver rose by only 2.5% during 2010.
The Silver Institute survey showed increased demand during 2010 despite a 38% average increase in the price of silver to $20.19.   The increase in silver prices during 2010 was the largest price gain since 1980.

Silver investment, one of the largest categories of silver demand, rose by 40% during 2010 to 279.3 million ounces, almost double the amount for 2009.

The amount of silver held by silver ETFs rose to 582.6 million ounces during 2010, an increase of 114.9 million ounces over 2009.  The largest increase in silver holdings was by the iShares Silver Trust (SLV) which accounted for 40% of the total increase.

Demand for physical silver reached new milestones in 2010.  Silver used in coin and medal production rose by 28% to 101.3 million ounces.  Sales of  U.S. Silver Eagles reached 34.6 million, far ahead of the previous record of 29 million reached in 2009.   Sales of bullion coins by mints in Australia and Canada also hit new highs.  Investors also purchased 55.6 million ounces of silver in the form of bullion bars during 2010.

Silver fabrication demand hit a ten year high of 878.8 million ounces, an increase of almost 13% over 2010.  Industrial applications increased by almost 21% to 487.4 million ounces.  Jewelry increased by 5%, showing the biggest increase in demand since 2003.  Photography was the only category that experienced a decline with usage falling by 6.6 million ounces.

The Silver Institute notes that demand for silver in industrial application is particularly strong in electronics and thermal applications.  New industrial applications using silver are expected to account for an additional 40 million ounces of demand by 2015.    Silver’s unique chemical properties are constantly leading to new industrial demand, one example being the development of products using silver as an antibacterial agent.

The increased demand for silver has encouraged new mine exploration and production.  Nonetheless, despite efforts by mining companies, silver production increased by a very modest 2.5% during 2010 to 753.9 million ounces.  The largest silver producer in 2010 was Mexico, followed by Peru, China, Australia and Chile.

Silver from above ground stocks increased to 142.9 million ounces due to a 14% higher scrap supply, net producer hedging and a significant increase in sales from government stocks to 44.8 million ounces.  The primary seller of government silver stocks was Russia.

Silver has had a recent pullback after extraordinary gains over the previous two years.   Some experts see a buying opportunity.   Michael Haynes, CEO of AMPEX, one of the country’s largest precious metals dealers, commented on the silver pullback in an interview with CNBC.  According to Mr. Haynes “The Middle America, the individual investor across the world is just now beginning to take hold of this concept and they’re not day traders. They’re not looking to buy today and sell this afternoon, sell next week. They have a long time frame; 3 to 5 years. So they’re purchasing this asset, not because they want to make money today, but they are looking at it almost like an insurance policy or a hedge against the rest of their portfolio.”

APMEX CEO Says No Bullion Shortage

Despite recent volatility, gold and silver prices continue to push to new highs.  After a brief pullback on earlier this week, silver rebounded strong and once again approaches the $50 level. Gold, which has lagged the price gains in silver, recently rose to a fresh all time high and remains solidly above the $1,500 level.
The rapid rise in silver prices has resulted in the Chicago Mercantile Exchange increasing the margin requirements on silver futures for the third time.  The press provided numerous accounts of traders taking huge positions in bearish silver puts.  Silver also faces the psychologically important barrier of $50 per ounce.   During the last great silver bull move of the early 1980’s silver rapidly collapsed from the $50 range and subdued for decades.

Despite the calls for a major correction by silver bears, the metal remains near all time highs and there have been numerous press reports of a physical shortage of silver based on intense investor demand.

Indications of a supply/demand imbalance in the bullion markets can be seen in many areas.   The US Mint has been rationing Silver Eagle bullion coins to its authorized purchasers and earlier this year the Royal Canadian Mint admitted that it was having major problems in sourcing adequate supplies of silver due to high demand.  The spot price of physical silver is trading above the price of futures contracts (known as backwardation) and this is an indication of huge physical demand.  In addition, earlier this week, APMEX, a major precious metals dealer, offered to buy bullion at a generous premium from its customers and cited “incredible demand” for gold and silver bullion products.

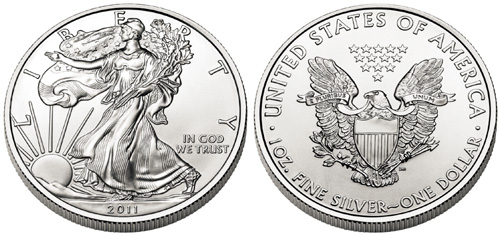
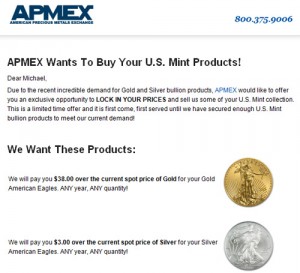
Although APMEX says there is no supply/demand imbalance, they recently increased their buy price for some US Mint bullion products. In particular, they are offering $3 over spot silver for one ounce American Silver Eagles. This is higher than the company’s cost of acquisition directly from the United States Mint, which sells the coins at $2 over spot to authorized purchasers.

In order to get a better assessment of the precious metal markets and supply/demand situation in bullion products, Gold and Silver Blog interviewed Michael Haynes, the CEO of American Precious Metals Exchange (APMEX).

When asked about the high prices APMEX is offering for Silver Eagles, Haynes said, “APMEX had not made a general offer to the customer base in quite some time and it seemed logical to remind the customers that APMEX has a need to buy. With respect to prices on Silver Eagles, you rightly describe that APMEX is offering more than the Mint sell price and you also rightly observe that the Mint is allocating product. As previously discussed, APMEX supplements its buying needs from the secondary market. Therefore, APMEX is buying at the bid offered to the customers and as mentioned above, APMEX would rather buy from its customers than a commercial dealer”.

Thus, despite the challenges experienced in other sectors of the market, from APMEX’s perspective they are able to obtain adequate supplies to meet customer demand.   Michael Haynes noted that APMEX is “currently able to buy the products needed to maintain adequate inventories for customers”.

Michael Haynes also provided insights into current customer buying trends.  According to Mr. Haynes, “average order sizes are increasing slightly, but that may be attributed to higher prices of the underlying product.  Recently, the purchases have shifted slightly toward silver”.  There has been no dramatic changes in customer buying patterns related to product size or premium according to Mr. Haynes.

Addressing  the appreciation in precious metals prices, Mr. Haynes noted that “APMEX sales seem to rise in either a rising market or a declining market.  The customers that purchase under those different scenarios are different, in that new customers tend to purchase on increases and mature customers tend to purchase on pullbacks”.

APMEX has apparently met the challenges of meeting surging customer demand for physical bullion products and, in addition, maintains a liquid market for those investors who chose to sell.  Mr. Haynes calls APMEX “one of the great business stories of the internet age”. APMEX was founded by Scott Thomas who has built the company into one of the largest dealers in coins and precious metals based on “a great passion to satisfy customers”.   Mr. Haynes stated that one of his goals is to “reach more of the population with the opportunity to own precious metals”.

Physical Silver Shortage Worsens Due To Mint Rationing and Surging Investment Demand

The inability of the US Mint to meet public demand for gold and silver bullion products was discussed at a recent House Financial Services Subcommittee hearing.  Testimony by industry experts revealed that the US Mint was losing an estimated one-third of potential bullion sales because they cannot meet demand.
For the past several weeks the US Mint sales figures for Silver Eagle bullion coins have been essentially flat. The US Mint sells its bullion products in bulk to authorized purchasers (AP’s).  The AP’s resell the bullion coins to dealers who then sell the products to the public.  The US Mint has been rationing the 2011 Silver Eagle bullion coins to AP’s, leaving one to conclude that the flat sales of Silver Eagles have been the result of Mint production constraints or supply shortages, rather than flat or reduced market demand.

On past occasions, the US Mint has cited the lack of adequate supplies of silver planchets as the cause for the continuing rationing of silver bullion coin sales. Earlier this year, the Royal Canadian Mint admitted that they were having significant problems in sourcing silver since huge demand was outpacing silver supply.

Combine rationing and surging demand and the obvious result is a severe shortage of  physical gold and silver bullion products.  Confirming this situation, American Precious Metals Exchange (APMEX), announced yesterday that they were seeking to purchase US Mint bullion products from their customers in order to meet “recent incredible demand for gold and silver bullion products”.

APMEX, one of the country’s largest precious metals dealers, offered to purchase American Gold Eagles and American Silver Eagles at generous premiums over spot prices in order to secure inventory.  Despite the increase in the price of gold and silver, public demand obviously remains incredibly strong.

The American public has been provided with plenty of evidence that out of control deficit spending and money printing policies by the Federal Reserve are destroying the value of the paper dollar and they are acting accordingly (see Why There Is No Upside Limit To Gold and Silver Prices).  A loss of confidence in paper money is fueling the rise in gold and silver prices as people seek to protect their wealth.  Any pullbacks in precious metal prices should be viewed as another major buying opportunity.

Federal Reserve May Cause Stampede Into Gold and Silver This Week

At the end of a two day Federal Reserve policy meeting, Fed Chairman Bernanke has scheduled a news conference on Wednesday that has the potential to rattle markets worldwide.   Every analyst and investor at the news conference is certain to focus their questions on Fed plans after the scheduled completion of QE2  in June.
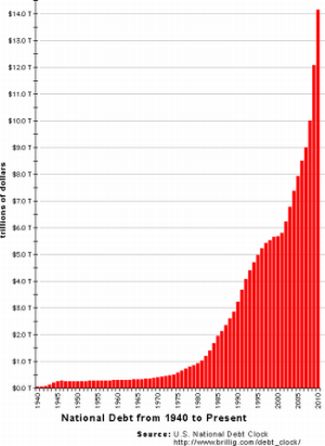
Current market expectations are that the Fed will not announce a new program of asset purchases and will initiate steps to slowly reduce the size of its bloated $2.5 trillion balance sheet.  Through the end of June, the Fed will have purchased $600 billion of treasury debt using newly created dollars, after having purchased $1.7 trillion of assets under QE1.

The Federal Reserve has been supporting the skyrocketing federal deficit by purchasing 85% of all new treasury debt since QE2 was initiated.   Some analysts think that interest rates on US debt will increase once the largest buyer of treasury debt steps aside.  The withdrawal of massive stimulus by the Fed could also cause a sell off in stocks and bonds, and result in lower housing prices and higher unemployment.  Under this scenario, another round of quantitative easing by the Fed would become inevitable.

Chairman Bernanke’s comments on the Federal Reserve’s exit strategy from a super easy monetary policy could cause major moves in many markets, especially precious metals.  If the markets sense that the Fed may need to initiate another round of quantitative easing, gold and silver prices will explode to the upside.  This prediction is based on the results of the current QE2 program which benefited certain asset categories but did little to help the average American.

Since last August when it became clear that the Fed would initiate QE2, we have witnessed the following results.

  • Home prices have continued to decline.
  • The 30 year mortgage rate has increased from 4.2% to 4.8%.
  • New housing starts declined to all time lows.
  • The 10 year treasury note rate has increased from 2.6% to 3.4%.

The Fed has continued its policy of near zero short term interest rates at the expense of consumers who receive virtually no return on savings.  Banks, meanwhile have increased US treasury and agency securities to a massive $1.7 trillion, benefiting from the spread between short and long rates.

The Fed’s policy of overt currency debasement, while helping to increase exports and earnings for multinational corporations has resulted in the dollar declining to the all time lows reached in early 2008.   Foreign countries with dollar reserves are protecting themselves by diversifying out of dollars and into other currencies and hard assets.

The lower value of the US dollar, while helping multinational corporations, has resulted in higher oil and food costs which has put  additional strains on consumers already burdened with excessive levels of debt and declining incomes.

Unemployment has remained stubbornly high despite unprecedented fiscal and monetary stimulus.  The Fed can print money but it cannot directly create an increase in real incomes for the average American family.  Nor can the Fed fool the people – recent Gallup polls show that almost half of the public has little faith in the Federal Reserve’s ability to do the right thing.

The Fed’s explicit policies of dollar debasement and zero interest rates risks triggering a major collapse in the value of the dollar.   Since last summer the dollar has seen a decline of 16% as investors do the logical thing and dump dollars.

Huge US  budget deficits, uncontrolled spending  and money printing by the Fed resulted in a warning by S&P that a credit downgrade on US debt was possible, putting further pressure on the US dollar.

QE2 liquidity did result in higher stock and precious metal prices benefiting a minority of Americans while doing nothing to solve the problem of too much debt and too little income.  Reliance on the Fed to come to the rescue with ever increasing amounts of cheap money has become the last resort, self defeating option.

The gold and silver markets are reflecting the failure of  unsustainable fiscal and monetary policies which virtually guarantee further appreciation in the precious metals sector.  Any pullback in prices should be viewed as a long term buying opportunity.

For Silver, This Time It’s Different

To many investors with a sense of history, the four most dangerous words are “this time it’s different”. The phrase is usually evoked in an attempt to justify why a huge price gain in a particular asset class can continue to defy common sense and historical valuation norms. A surfeit of explanations on why “this time is different” is usually enough to send seasoned investors to the exits.

Silver, having defied the low expectations of many investors, has now seen a monster rally of 392% from $8.88 in October 2008 to the recent market price of $43.67. The pace of the advance has gone almost vertical with silver gaining 60% from the lows of late January.

Long term silver investors no doubt remember the aftermath of the last rapid run up in silver prices to $48.70 in January 1980. Silver prices collapsed shortly thereafter and ultimately slid to the $5 range where it remained throughout the 1990’s. Silver dropped off the radar for most investors and remained dead money for 25 years before decisively breaking out of a very long base in early 2006.

Will history repeat with another meltdown in silver prices at some near point in the future, or is the rise in silver prices indicative of a major trend change in our economic future? I have never believed that the mechanical application of past price trends was a useful tool for predicting the future. Each point is history is unique with new players and new sets of circumstances. Understanding today’s fundamentals are far more important than ascribing importance to past events that are largely irrelevant.

To understand why silver prices are in the initial stages of a long term super cycle advance rather than a replay of the 1980’s, it is necessary to review the differences of the late 1970’s compared to our current situation. Gold and silver both advanced in the 1970’s as a booming, demand driven economy fueled inflation. The huge cost of financing the Vietnam War, low employment and surging wages all contributed to a steadily rising rate of inflation which peaked at 13.5% in 1981. Federal Reserve Chairman Paul Volcker finally stopped inflation dead in its tracks through a series of massive interest rate increases which brought the prime rate to a high of 21.5% in mid 1981. High interest rates caused a severe recession but by 1983, the rate of inflation had collapsed to 3.2%.

Both gold and silver moved dramatically higher during the inflation surge of the late 1970’s and early 1980’s but the meteoric rise in silver prices was driven by specific events. Wealthy brothers Nelson and William Hunt acquired a massive position in silver in an attempt to corner the market. Prices skyrocketed on the news and silver went from $11 per ounce in late 1979 to $48.70 in early 1980. Regulators did not take kindly to market manipulation and margin requirements on commodities were dramatically raised. The Hunt brothers’  ill conceived attempt to drive silver prices higher collapsed along with their net worth. Silver prices plunged to less than $11 per ounce within two months. The last great silver “bull market” lasted less than six months, driven not by fundamental demand but rather by heavily leveraged speculators.

Fast forward 30 years – the finances of governments worldwide have reached the tipping point under ballooning debt levels and massive deficits. Additional borrowing by insolvent nations to rollover debt simply delays the day of reckoning – more debt is not the solution for too much debt.

The message from the gold and silver markets is clear – governments have reached the limits on borrowing and the day of debt Armageddon is approaching. The accelerating exodus from paper assets to historical stores of value is only in its initial stages as desperate governments take desperate measures to stay afloat (see Smart Money Sees The Perfect Storm for Gold and Silver).

The great debt bubble of the United States and much of the rest of the world is reaching its end game as creditors realize that a stealth default of some type is inevitable via a combination of inflation, money printing, currency debasement and/or negative interest rates.  Nor is it likely that S&P’s lowered outlook on U.S. government debt to negative from stable will have any affect on reining in ballooning U.S. debt (see Why There Is No Upside Limit To Gold and Silver Prices).

From a long term perspective, perhaps this time is not different but simply a replay of the history of currencies backed only by the “full faith and credit” of governments.  Voltaire had this to say regarding fiat money – “Paper money eventually returns to its intrinsic value – zero”.

2011 America the Beautiful Silver Bullion Coins Release

On April 25, 2011, the United States Mint will make the first of the 2011-dated America the Beautiful Silver Bullion Coins available for purchase. This year’s release and distribution of the 5 ounce silver bullion series is expected to be much different than experienced for the previous year.
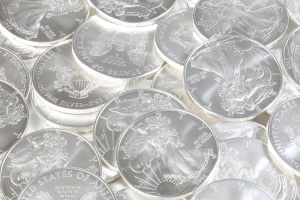
As with other bullion programs of the United States Mint, the coins are distributed through a network of authorized purchasers. A group of primary distributors may purchase the coins directly from the Mint in bulk quantities based on the market price of the metal plus a modest premium. For the 5 oz. ATB silver bullion coins, this premium is $9.75 per coin. After acquisition, the authorized purchasers resell the coins to other bullion dealers, coin dealers, and the broader public.

For this year’s offering, the US Mint will start by releasing two different designs featuring Gettysburg National Military Park and Glacier National Park, each with a mintage of 126,500 units. This will be followed by three additional designs released later in the year featuring Olympic National Park, Vicksburg National Military Park, and Chickasaw National Recreation Area. The US Mint has stated that their goal is to produce a minimum of 126,500 coins for each of these designs.

For the 2010-dated issues, all five designs had been released on the same date, late in the year. Each of the designs had production of only 33,000 units. This extremely limited mintage generated excitement with collectors, as the coins were viewed more as low mintage numismatic products than bullion coins. In an attempt to prevent price gouging, the US Mint would halt sales and impose terms and conditions on the distribution of the coins at the authorized purchaser level. This included capping the premiums on the coins and distributing directly to the public, with a household limit imposed.

For the upcoming releases, mintage levels are high enough that the US Mint will not impose similar terms on their distributors, except for the standard allocation (rationing) program and a requirement to certify that all of the prior year coins have been distributed in accordance with the rules previously set.

Price Pullbacks in Silver Becoming Shorter and More Shallow

Silver prices continued streaking higher today on fears of a plunging dollar, rampant money printing by central banks, and talk in Europe of a looming debt restructuring (default) by Greece.
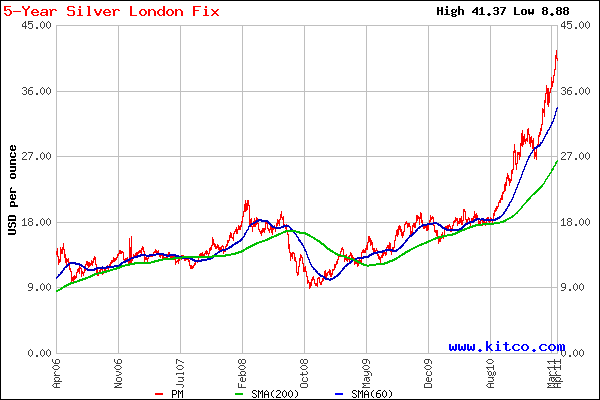
In late afternoon trading silver was up $1.22 to $41.88, a 3% gain for the day.  Since decisively breaking through the $15 price range in early 2008, silver has been in a major bullish uptrend with price pullbacks becoming shorter in duration and more shallow in their extent.

SILVER - COURTESY KITCO.COM

Silver reached an intermediary high of $20.92 in March 2008.  As the financial world headed for a meltdown in late 2008 and every asset class in the world was liquidated, silver experienced a sharp sell off and by October 2008 reached a low of $8.88.  The 2008 low represented a price consolidation of 40% from the base silver had established at the $15 range.

The ensuing recovery in silver took a little over a year before the price once again approached the $20 per ounce level.  In December 2009 silver hit a high for the year at $19.18.  After a brief consolidation below $18 in early 2010, silver broke out of its base in the $18 range  to reach a high of $30.70 in December 2010. The price of silver ended the year up $13.46, for a gain of 78.4% on the year.

In January of 2011 silver again consolidated briefly and pulled back $3.95 or 13% to a low of $26.68 on January 28th.  This month-long pullback turned out to be another fantastic buying opportunity as silver recovered its losses and rose to $36.60 by March 7th.

Over the next 7 trading days, silver consolidated again, declining  from $36.60 on March 7th to $33.88 on March 15th for a loss of $2.72 or 7.4%.  Silver then rallied again to a new annual of $41.37 on April 11th.

Silver’s most recent pullback was the shortest of them all, declining from $41.37 on April 11th to $40.22 on April 13th for a loss of $1.15 or 2.8%. The losses were quickly recovered and a new 31 year high was reached, with silver recently trading at nearly $42 per ounce.

Investors who seized the opportunity to purchase silver on price pullbacks over the past four years have made fantastic profits.  As the bull market in silver has progressed, these pullbacks have become shorter in duration and more shallow in price. This situation seems to be reaching its extreme, where pullbacks last not months, not days, but mere hours. Investors have started to capitalize on even the smallest price declines to increase their positions and drive prices higher.