May 1, 2024

As Silver Prices Soar, Silver Coins Get Smaller

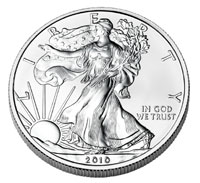
Ten years ago, one ounce silver bullion coins could be purchased for around $7 each. This reflected market silver prices below the $5 level. As recently as one year ago, the prices for one ounce bullion coins had risen to around $18 each. Following the dramatic rise in the silver price experienced in the last five months, newly minted one ounce silver bullion coins from a major world mint are now priced around $39, assuming a purchase in quantity.

Silver has been called “poor man’s gold”, but after the significant rise in price, even the traditionally smallest sized coins are becoming expensive. Thus, it was only a matter of time before smaller sized coins would be introduced.

Last month, the Perth Mint of Australia began selling one-tenth ounce Silver Koala coins. Previously, this series had been offered in sizes ranging from one-half ounce to 1 kilo. Other numismatic and bullion coin offerings from the Perth Mint have also been available in sizes starting at one-half ounce, but this seems to be the first instance that a one-tenth ounce size has been available.
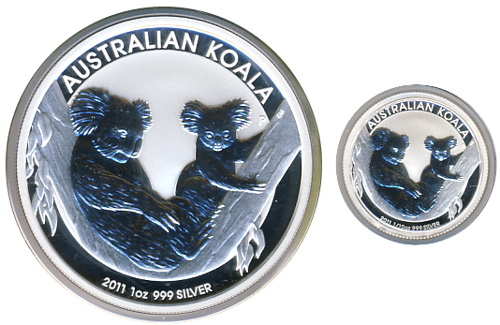
As will generally be the case with silver products, the smaller weight offerings carry a larger premium than than larger weight products. This can be the result of the fixed costs associated with manufacture or volume discounts which may be available for purchases in bulk quantities.

The Perth Mint’s website shows the one ounce 2011 Silver Koala priced at US $41.88, reflecting a premium of $5.57 or 15.34%. The one-tenth ounce version is priced at $13.76, reflecting a premium of $10.13 or 279%! (All prices at time of post.)

Obviously when purchasing silver for investment purposes, it makes sense to pay the lowest premium possible. That way, you will get more silver for your money and won’t risk seeing contraction of premiums offset gains.

The move by the Perth Mint to smaller sized silver coins is certainly an interesting one. How long will it be before other world mints follow suit?
Demand For Silver Jewelry Soars As Silver Hits New Highs

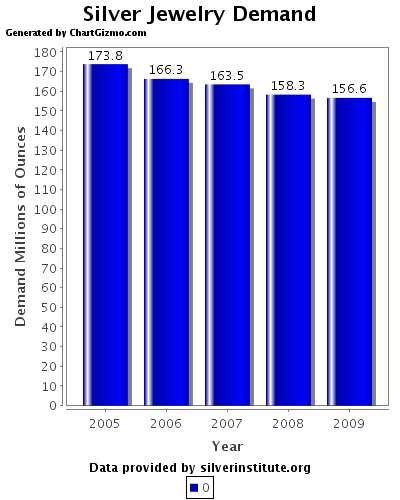
Demand for silver jewelry hit new records in 2010 according to The Silver Institute. A survey of 340 retail jewelers conducted in February by Nielsen/National Jeweler shows that 87% of retail jewelers experienced sales increases. The retail jewelers surveyed operate 4,000 stores.
The survey reveals that of the jewelers reporting sales increases, 52% saw sales increases of between 11% and 25%. Sales increased by more than 25% at 28% of the jewelers surveyed.

Sales of gold and platinum jewelry saw increases in sales of 4%, far below the sales increase in silver jewelry. As the price of both gold and silver continue to surge, many smaller investors naturally gravitate to less expensive silver.

The fact that silver jewelry sales increased substantially despite the huge jump in silver prices last year indicates that the general public is recognizing the need to diversify their wealth into an asset that has held its value over the millenniums.  Paper currencies have come and gone over the centuries, leaving paper wealth holders impoverished while gold and silver have always been a store of permanent value.

As the economy hit the wall during 2008 and 2009, silver jewelry sales declined from previous record levels to under 160 million ounces.  A ten year high in silver jewelry demand was reached during 2003 at 179.2 million ounces.  The four other years of the past decade during which silver jewelry sales exceeded 170 million ounces were 2000, 2001, 2004 and 2005.

The silver institute has not yet released their World Silver Supply and Demand statistics for 2010, but based on the survey cited, it appears that silver jewelry demand for 2010 may have exceeded the previous demand record of 179.2 million ounces during 2003.  Assuming that total silver jewelry demand increased by 15% over 2009, total 2010 demand could have exceeded 180 million ounces – a very bullish indicator as silver continues to increase in price.

Historical Gold Silver Ratio Predicts $100 Silver Price

The gold silver ratio chart below shows the dramatic fashion in which silver has been outperforming gold since last August.  The gold silver ratio is calculated by dividing the price of gold by the price of silver.  A declining gold silver ratio indicates that silver has been outperforming gold.   The gold silver ratio has declined from 65 last summer to a current level of 41.
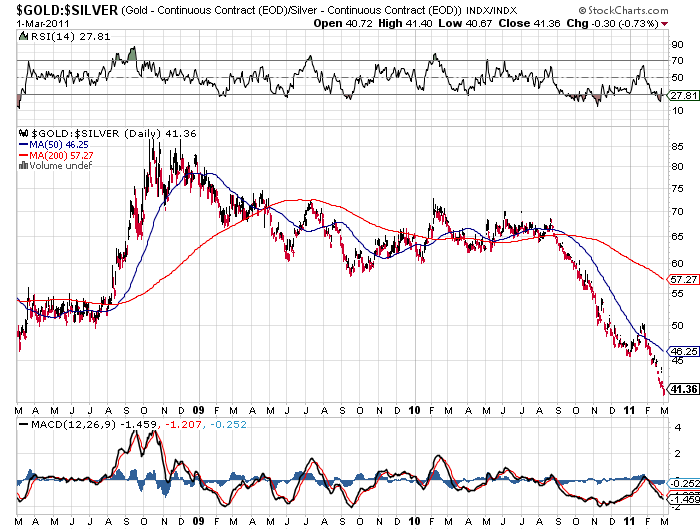
Since August 2010 gold has moved up 22% from the $1,175 level while silver has soared 92% from the $18 range.  Does the declining gold silver ratio indicate that silver prices are due for a correction or is this a fundamental change in the price relationship?

The gold silver ratio has averaged around 60 since the mid 1970’s.  In January 1980, as silver hit its peak price of $48.70, the gold silver ratio briefly hit 16, but rapidly rose as the Hunt brother’s attempt to corner the silver market came undone and silver prices collapsed.

Gold Silver Ratio - Courtesy Stockcharts.com

Will the current decline in the gold silver ratio continue?  From a very long term historical perspective, a gold silver ratio in the 16 range has been the norm.  Since ancient times, it has typically taken 16 ounces of silver to purchase one ounce of gold.  Interestingly, the earth’s  reserves of silver exceeds that of gold by roughly 16 times.  If this ultra long term relationship were to reassert itself, silver would sell for approximately $90 per ounce based on the current price of gold.  With gold at $2,500 per ounce, silver would have a value of $156 per ounce at the historical gold silver ratio of 16.

The fundamental reason that may drive the gold silver ratio back to the 16 range is growing demand by small investors.  Silver, known as the poor man’s gold has seen a huge surge of public demand, as evidenced by record sales of the Silver Eagles.

Increasing public recognition of the need to preserve wealth against paper currencies will continue to propel silver to historic highs.  Simply put, silver is more affordable to the average buyer who cannot afford the higher priced Gold Eagles.  Silver has a lot of catching up to do and we are probably in the early stages of a fundamental reversion to a lower gold silver ratio which will send silver prices soaring past $100 per ounce.

Silver Breaks Out of Triple Top for New Bull Move – Is Gold Next?

Triple tops are a well known chart formation that signal the potential for a price trend reversal.  A classic triple top occurs over a period of three to six months during which prices decline after hitting a series of multiple equal highs.  For the reversal pattern to register a definitive sell signal, the price must break below support levels.
A triple top has certain characteristics, each of which must be analyzed.

  • The three highs must be within reasonable price points of each other and spaced over equal time periods.
  • A previous long term uptrend must have occurred which established a definitive uptrend.
  • Volume levels tend to decrease during the formation of a triple top.  If volume increases on a pullback from the third top, more significance must be given to the potential for a significant trend reversal.
  • A triple top is not completed unless the price level breaks a key support level which would be the lowest price point on previous pullbacks from the intermittent tops.
  • A triple top chart pattern is not considered bearish unless support levels are decisively broken

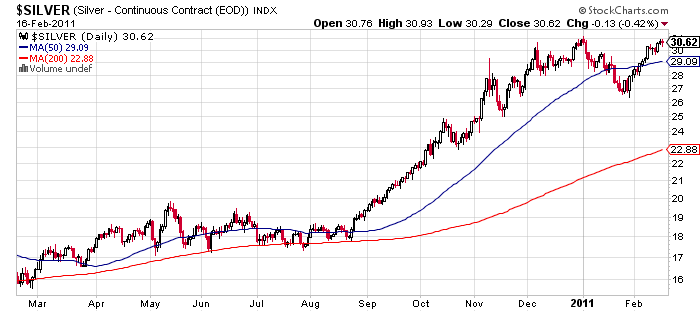
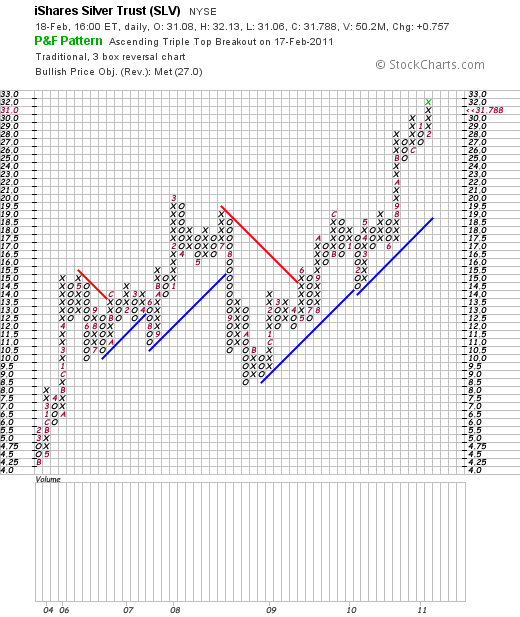
Examining the chart for silver before the recent move up, we could see a pattern developing with characteristics of a triple top.  The critical support level for silver was at  the $27  level.  Silver’s inability to break resistance at the $30 level would have been at best a neutral signal and a break below $27 would have forecast further price declines.   The strong upward price movement in silver last week as it soared past the $30 area is extremely bullish and tells us that the bull market in silver is intact.

Silver - courtesy stockcharts.com

TRIPLE TOP BREAKOUT - COURTESY STOCKCHARTS.COM

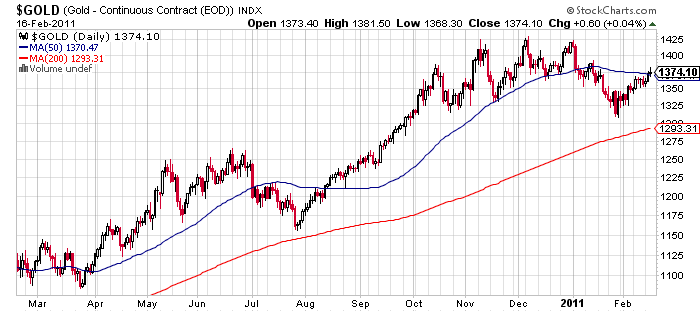
Viewing the chart of gold, we can see that the same potential for a triple top exists.

Gold - courtesy stockcharts.com

Gold has been turned back three times at the $1425 level, the tops are equally spaced over a period of almost 4 months and gold has been in an established uptrend for an extended period of time.  In the case of gold, a drop below support at $1320 would be a bearish signal and reason to take a defensive posture.

Considering the strong fundamentals supporting gold, we may soon see a breakout in the price of gold similar to what we have just witnessed with silver.

US Mint Silver Bullion Sales Set Monthly Record

The pace of sales for the United States Mint’s American Gold Eagle and American Silver Eagle bullion coins jumped in the past week. This propelled silver bullion sales far into record territory for the month of January.
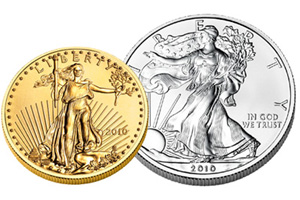
In the prior week ending February 2, 2011, the US Mint sold 1,748,000 ounces worth of Silver Eagles and 56,500 ounces of Gold Eagles. These are sizable increases from the prior week, when the pace of sales had slowed considerably.

Currently, the US Mint offers only these two options for precious metals investors. The American Gold Buffalo, struck in 24 karat gold, has been unavailable for several months. The American Platinum Eagle remains on indefinite hiatus since late 2008. The recently introduced America the Beautiful Silver Bullion Coins are now in production for the 2011 designs, following the rapid sell out of the previous year’s coins.

US Mint Bullion Coin Program Sales 2/2/2011 (ounces)

Prior Week Month to Date Year to Date
American Silver Eagle 1,748,000 50,000 6,472,000
American Gold Eagle 56,500 6,000 139,500
America the Beautiful Silver 0 0 0
American Platinum Eagle 0 0 0
American Gold Buffalo 0 0 0

For the month of January 2011, Silver Eagle bullion coin sales reached 6,422,000, representing the highest monthly sales total in the history of the program. The previous monthly record of 4,260,000 ounces was set in November 2010, at the time breaking the long standing record of 3,696,000 ounces from December 1986.

To put this monthly sales total into perspective, there were ten separate years of the program where annual sales did not reach this level. If the pace of sales continues for the rest of 2011, more than 77 million ounces of silver would be sold. This amount exceeds the total annual domestic silver mining production of the United States.

US Mint Added New Silver Blank Supplier in 2010

For much of the past three years, the United States Mint has struggled to keep up with the boom in demand for physical precious metals. Although they have been required to mint and issue American Gold and Silver Eagle bullion coins in quantities sufficient to meet public demand, they have often fallen short of this mandate, resorting to sales suspensions and rationing programs.
The US Mint’s 2010 Annual Report details some of the specific steps they have taken to increase the quantity of precious metals blanks that they are able to acquire:

  • The US Mint worked with their existing precious metals blanks fabricators to revise delivery schedules to fit production levels. Level loading materials allowed these fabricators to increase productivity and increase output.
  • A new silver blank fabricator began delivering blanks late in the fiscal year. The US Mint also continues to pursue additional suppliers. The reliance on a small number of foreign suppliers was previous noted as the “heart of the problem” in the US Mint’s struggle to manufacture sufficient gold and silver bullion coins.
  • Productivity and efficiency enhancements were implemented at the West Point Mint. Coin encapsulation and packaging processes were automated, employees were trained to handle more areas of responsibility, and coordination with suppliers allowed continuous assaying, inspection, and coin production to take place.

The US Mint cited the results of their efforts during the year:

  • The average monthly supply of all gold and silver blanks from vendors increased from 2.6 million ounces to 4.1 million ounces.
  • Output at the West Point Mint increased from 175 ounces per labor hour to 215 ounces per labor hour.
  • By August 2010, the US Mint had sufficiently expanded supply to remove order limits and fully satisfy demand for silver bullion coins by August 2010.
  • Popular numismatic products like the 2010 Proof Gold Eagles and 2010 Proof Silver Eagles were launched in October and November 2010. These offerings had been canceled in the previous year.

Gold and Silver: Investment Differences

Gold just had an amazing year, in which it reached a new all time high, rising about 25%. Silver provided an even more stellar performance, with a gain of about 75% and counting. It’s no wonder then, that more and more investors are becoming interested in the potential offered by silver.
One of the most pronounced differences between gold and silver is the price per ounce. Gold is currently around $1,400 per ounce, while silver is at $30. The difference has not always been so large.

The gold-silver ratio, or the number of ounces of silver it takes to buy one ounce of gold, is currently around 47:1. Historically, this ratio has been around 16:1, which closely corresponds to the ratio of gold to silver within the earth’s crust. Thus on an absolute basis, the difference in price is justified, but not to such a degree as current prices have suggest.

Another key difference between gold and silver is the price volatility. While gold has enjoyed a string of ten straight years of annual gains, silver’s price performance has not been as constant. Some years have been downright disastrous, such as the 27% drop silver experienced during 2008. From the start of the year to the low, silver had experienced a decline of nearly 40%. During 2008, gold had booked a 4.32% gain, with a maximum decline of 14.54% from the start of the year.

Finally, while gold and silver are both metals that store value, silver has been long served as an industrial metal. The recent case for gold demand has been as a hedge against inflation or a safe harbor from fiat currencies. Demand from these factors has offset declines in demand from gold jewelry, which has historically been the predominant source of demand. Silver, on the other hand, can serve in a dual capacity, with possible appreciation in value in times of both economic distress and prosperity.

Silver’s roles may be expanding once again, as it is starting to be utilized for its antibacterial qualities.

With an impressive year nearly in the books, the story for silver seems hardly over. Next year might be telling as to whether silver will continue to make progress in catching up with the historic ratios and start to challenge the label of “poor man’s gold.”

Gold and Silver: Investment Similarities

Gold and silver just seem to go together. They’re two precious metals that we love to invest in, especially after the strong performance of the metals during 2011, and gold’s string of consecutive annual gains stretching back a decade.

This year, gold futures have grown as much as 25% this year and silver futures as much as 75%. It’s this last figure that really interests us though. It is indicative of growing investor interest in a metal that is much more affordable than gold, but still offers many of the same benefits in the precious metals market.

Gold and Silver Investment Options

The major similarities that we can point to are related to the various ways that gold and silver are sold and traded among investors. In most cases, a potential investor has a few different options:

  • They can invest in bullion coins
  • They can invest in numismatic coins
  • They can invest in exchange traded funds or ETFs

Gold and silver bullion coins are produced by a number of different world mints. A few of the most widely traded options include the American Silver Eagle from the United States Mint, the Silver Maple Leaf from the Royal Canadian Mint, and the Silver Philharmonic from the Austrian Mint. These coins are issued each year and are generally sold based on the market price of silver plus a mark up. The mark ups might be $2.50 to $4.00 per coin, depending on the quantity purchased.

Numismatic gold and silver coins are those which are valued not only based on their intrinsic value, but also their rarity and condition. In some cases, a rise in the price of precious metals might not result in an increase in value for numismatic coins since other factors come into play. It takes some understanding of the coin market and grading scales to invest in numismatic coins.

For many beginning investors, Exchange Traded Funds provide a useful alternative. Precious metals ETFs are traded on stock exchanges in the same manner as stocks and generally track the price of the underlying metals. There are different types of ETFs, which use either physical metal or futures and contracts to track the price of the underlying metal. The largest and widely held precious metals ETFs are the SPDR Gold Shares ETF (GLD) and the iShares Silver Turst (SLV).

2011 American Silver Eagle Release Date

Sales of the 2011 Silver Eagle bullion coins will begin on Monday, January 3, 2011. This will mark the first day that authorized purchasers may place orders for the coins with the United States Mint.
The American Silver Eagle has been issued in bullion format each year since 1986. Each coin contains one troy ounce of .999 fine silver, with the weight and purity guaranteed by the United States government. The program was authorized by Congress to provide a convenient and cost effective method for Americans to invest in physical precious metals.

The United States Mint sells bullion coins to a small group of official distributors who resell the coins to secondary retailers who in turn sell to the public. This authorized purchaser system is believed to be the most effective and efficient means of distributing the coins to the public, although recently this has been called into question.

Under typical procedures, the group of eleven primary distributors will be able to place orders for 2011 Silver Eagle bullion coins directly with the US Mint. The price paid will be based on the London Silver Fix on the first business day following the order, plus a premium of $2.00 per coin. Minimum order requirements are for 25,000 ounces of silver per order, with orders above the minimum placed in 500 ounce increments.

The bullion Silver Eagles are packaged in plastic tubes containing 20 one-ounce coins. Twenty five tubes are placed into molded plastic shipping containers, containing 500 ounces of silver. The plastic tubes and shipping containers are imprinted with the United States Treasury Department Seal.

The United States Mint is currently selling 2010-dated Silver Eagles. If any inventory of these coins remains on January 3, 2011, the prior year coins will be sold on a ratio basis for any primary distributors placing orders for coins bearing the new date.

America the Beautiful Silver Bullion Coin Distribution

Nine out of eleven of the US Mint’s authorized purchasers have decided to go along with the new terms and conditions covering the distribution of the America the Beautiful Silver Bullion Coins.

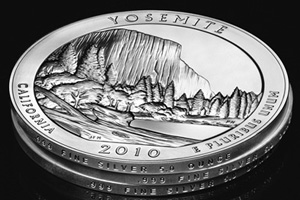
The 5 ounce silver bullion coins featuring duplicate designs of the circulating quarter dollar series became hot items once collectors learned of the limited mintage of just 33,000 coins per design. Based on the high demand and limited supply available, one of the US Mint’s primary distributors began accepting orders for the coins at a premium considered to be excessive.

Complaints from customers caused the US Mint to halt and relaunch the program with price controls and other measures to ensure broad distribution to the public. In order to participate in the distribution of the America the Beautiful Silver Bullion Coins, the primary distributors had to agree to sell all coins directly to the public, limit premiums to 10% above acquisition cost, and impose household ordering limits. The rules seemed problematic for some of the distributors who generally only sell in bulk quantities to other dealers.

The US Mint’s eleven primary distributors were able to place orders with the United States Mint from December 10 to 17. The nine who purchase their allotments of 3,000 coins of each designs are included below:

  • A-Mark Precious Metals (Los Angeles)
  • Coins ‘N Things (Massachusetts)
  • MTB (New York)
  • American Precious Metals Exchange, Inc. (Oklahaoma)
  • Dillon Gage Incorporated of Dallas (Texas)
  • Prudential Securities Inc. (New York)
  • The Gold Center (Illinois)
  • Jack Hunt Coin Broker (New York)
  • Fidelitrade (Delaware)

The coins allocated to the two primary distributors who did not place orders will be reallocated to active sellers this week.

In the first quarter of 2011, the United States Mint plans to offer numismatic versions of the 2010 America the Beautiful Silver Bullion Coins. These would be limited to 27,000 coins per design and sold directly to the public via the US Mint’s website and by telephone.