May 13, 2024

iShares Silver Trust Holdings Reach Record High As Gold and Silver Hit New Highs

Silver holdings of the iShares Silver Trust (SLV) jumped to another new record high this week while holdings of the SPDR Gold Shares Trust (GLD) dropped slightly.

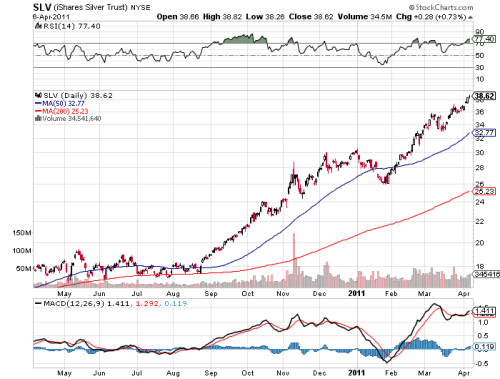
The SLV holdings increased by 22.93 tonnes to surpass last week’s record high.  Holdings of the SLV now total 11,162.45 tonnes or 358.9 million ounces of silver valued at $14.2 billion.  Since silver began its nonstop advance in late January, holdings of the SLV have increased by a substantial 757.28 tonnes.

GLD and SLV Holdings (metric tonnes)

6-April-2011 Weekly Change YTD Change
GLD 1,205.47 -6.37 -75.25
SLV 11,162.45 +22.93 +240.88

The London Fix Price for silver increased by $2.10 (5.6%) over the past week, closing today just below $40 at $39.63.  The price of silver has now reached levels last seen 31 years ago in 1980.  Patient silver investors who took the opportunity to increase holdings when the metal was below $10 per ounce are now enjoying the profit of patience.

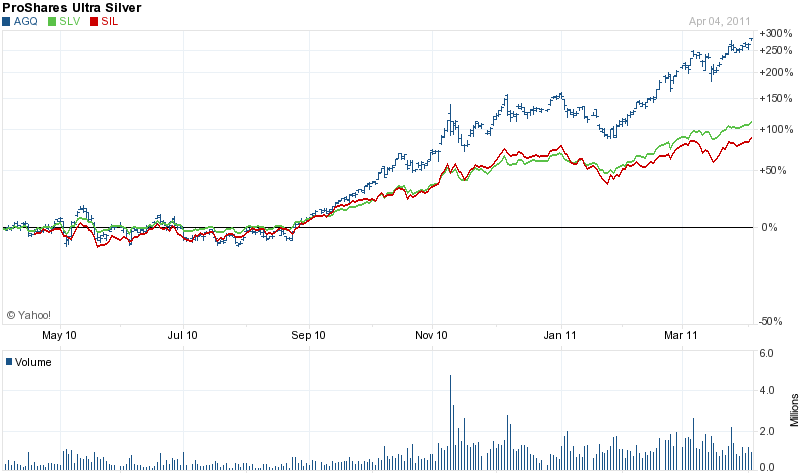
The astonishing rally in silver prices since late last August has resulted in a gain of 114% for the SLV.  Profits from owning the ProShares Ultra Silver ETF (which does not hold physical silver) have been even more dramatic for silver bulls with a gain of over 400% since last August.

Despite the large price gains in silver since late January, we have not yet witnessed a large volume price spike as was seen in early November 2010 which lead to a 3 month price consolidation.  The next logical resistance level for silver would be on its approach to $50.  Besides the psychological resistance of round numbers, the all time high of silver is $48.70 reached in January 1980.

SLV - COURTESY STOCKCHARTS.COM

Holdings of the GLD declined by 6.37 tonnes on the week, bringing the decline in gold bullion holdings to 75.25 tonnes since the beginning of the year.  The all time record holdings of the GLD reached 1,320.47 tonnes on June 29, 2010.  The SPDR Gold Shares Trust (GLD) now holds a total of 38.8 million ounces of gold valued at $56.6 billion.

The price of gold, as measured by the closing London PM Fix Price hit an all time high today of $1,461.50 and has now broken through resistance at the $1,450 level.  Many analysts are now targeting $1,500 as their next price objective.  Fundamentals favoring the gold market continue to be strong, especially as the U.S. continues inexorably towards a debt crisis at some point in the future (see Gold and Silver Soar As Budget Fiasco Sends Wrong Message to U.S. Creditors).
Proshares Ultra Silver (AGQ) Delivers Huge Gains On Soaring Silver Price

Surging silver prices over the past two years have resulted in huge gains for silver investors. The price of silver bullion has skyrocketed from the $8 level in late 2008 to a New York Spot Price of over $39 per ounce today for a gain of 388%.
Besides directly purchasing silver bullion, other common ways to profit from the silver bull market include investing in silver stocks or silver Exchange Traded Funds (ETF).  The inconvenience and higher transaction costs of investing directly in physical silver has resulted in a major flow of investment dollars into silver ETFs.

The largest silver ETF, the iShares Silver Trust (SLV), has attracted huge investor interest and has seen an astonishing increase in asset growth. The SLV, which held $263.5 million in silver at its inception in April 2006, closed today with total net assets of $13.7 billion. The SLV is structured so that its net asset value per share approximates the value of one ounce of silver bullion. The SLV has worked as it was designed to and the returns are comparable to the return from a direct investment in silver bullion.

There is another silver ETF, however, that has been the standout winner for silver investors.  The ProShares Ultra Silver (AGQ) has soared from its initial $22 a share price in December 2008 to a closing price today of $243.98, providing initial investors with a gain of over 1,000%.   According to ProShares, the AGQ seeks to provide for a single day twice the return of silver bullion as measured by the London Fix Price.  The gain on the AGQ has exceeded the returns on silver bullion, the SLV, and a basket of silver stocks by a wide margin as can be seen below.

AGQ VS SLV AND SIL - YAHOO FINANCE

The AGQ was launched by ProShares on December 1, 2008, trades on the New York Stock Exchange and is defined by the Commodity Exchange Act as a commodity pool.  ProShares is part of the ProFunds Group which manages over $31 billion in mutual funds and ETFs.  ProShares also offers the UltraShort Silver (ZSL) which is a double inverse ETF and the exact opposite of the AGQ.  The ZSL seeks to produce a 200% opposite investment result of a long position in silver and will therefore increase in value if the price of silver declines.

One important element that investors should be aware of is that the AGQ does not hold physical silver, as is the case with SLV and PSLV.  The AGQ seeks to achieve its stated investment objective by owning financial instruments whose underlying value is correlated to the price of silver.  The AGQ may hold various complex financial instruments such as forward contracts, option contracts, swap agreements and futures contracts. As of April 5, 2011, the ProShares Ultra Silver held the majority of its assets in silver forward contracts.

The ProShares prospectus states that ProShares Ultra Silver seeks a 200% return on the performance of silver bullion “for a single day” since returns over periods greater than one day could vary in direction or amount from the target return due to compounding of daily returns.  The four factors cited by ProShares that could result in differences between daily and long term returns are index volatility, inverse multiples, holding periods, and leverage.

As every investor knows, greater rewards usually involve taking greater risks and the AGQ is no exception to this rule.  ProShares uses complex financial instruments that are subject to volatility in order to achieve leveraged results and the Ultra Silver ETF is therefore subject to much greater risk than investments in traditional silver securities.  ProShares warns investors that certain financial instruments held by the AGQ may be “subject the fund to counterparty risk and credit risk, which could result in significant losses for the fund”.  ProShares also notes that the Ultra Silver ETF is non-diversified and entails risks associated with the use of derivatives.

The bottom line is that the ProShare Ultra Silver is much riskier than investing in silver trust ETFs, silver stocks, or silver bullion and should therefore be used only by knowledgeable investors.   As long as silver continues to increase in value, investors are likely to see outsized gains in the AGQ.  Leverage, however, works both ways and a sharp price correction in silver would result in significant losses to investors in the AGQ. An example of how severe losses can be in a leveraged ETF can be seen by looking at the investment results of the ZSL which is designed to go up in value if the price of silver declines.

ProShares introduced the ZSL when silver was below $10 per ounce and, needless to say, initial investors who maintained an investment in the ZSL have experienced devastating losses.  The ZSL has declined almost 50% this year and since its inception in late 2008, has experienced a split adjusted decline of over 95%.

Gold and Silver Consolidate Recent Gains As Threat Of Sovereign Defaults Grows

Gold and silver prices, as measured by the London PM Fix Price, were largely unchanged on the week.  Gold slipped by $18 per ounce while silver declined modestly by $.05
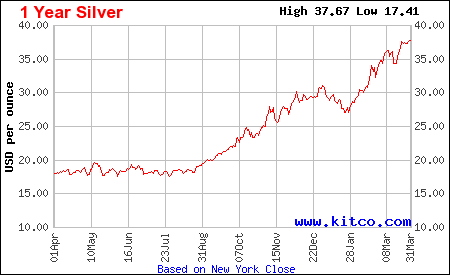
Gold has rallied almost $100 per ounce since late January but has failed to decisively break out to new all time highs.  Silver, the standout performer in the precious metals sector has rallied furiously since late January, gaining $10 per ounce for an increase of 36%.

SILVER - COURTESY KITCOSILVER.COM

Despite the current attempt by Congress to implement very modest budget reductions,  fewer and fewer people seem to have faith in the long term value of the dollar.  The value of gold has not gone up for 10 years straight by accident – it is the result massive increases in debt and the looming threat of paper currency depreciation as governments resort to the printing presses to avoid defaulting.  (See Why There Is No Upside Limit for Gold and Silver).  Recent comments by two prominent individuals reinforce the view that the potential fallout from the debt crisis will be severe.

Bill Gross of Pimco, the world’s largest bond investor, writes in his April 2011 Investment Outlook,  “Unless entitlements are substantially reformed, I am confident that this country will default on its debt; not in conventional ways, but by picking the pocket of savers via a combination of less observable, yet historically verifiable policies – inflation, currency devaluation and low to negative real interest rates”.

John Lipsky of the International Monetary Fund warned that the level of debt by developed nations is unsustainable, having reached levels last witnessed after the end of World War II.  According to Mr. Lipsky, “The fiscal fallout of the recent crisis must be addressed before it begins to impede the recovery and create new risks.  The central challenge is to avert a potential future fiscal crisis, while at the same time creating jobs and supporting social cohesion”.

The reality of a democracy is that we elect those who promise to provide us with the most benefits and entitlements.  Under these constraints, the temptation by elected officials to use printed money to meet promises that cannot be kept is irresistible.  Yes, the promises will be kept but they will be paid for in dollars that have little purchasing value.

Precious Metals Prices
Fri PM Fix Since Last Recap
Gold $1,418.00 -18.00 (-1.25%)
Silver $37.63 -0.05 (-0.13%)
Platinum $1,773.00 +21.00 (+1.20%)
Palladium $772.00 +18.00 (+2.39%)

Platinum and palladium both gained on the week, continuing a rebound from recent sell off lows reached during the height of the panic related to the Japanese earthquake.  Since mid March, platinum has gained $73 per ounce while palladium has gained $60 per ounce.  In late February palladium was at the $860 level while platinum traded in the $1850 range.

Why There Is No Upside Limit for Gold and Silver Prices

The past decade has seen a virtually nonstop advance in the price of gold.  Silver, which lagged gold until last year,  recently hit a 31 year price high.  Gold and silver, both used as currency for thousands of years, have gained broad investor appeal as a hedge against paper currencies.

The increase in the value of gold and silver is due to the fiscal and monetary policies of nations struggling to deal with massive levels of debt – policies that virtually guarantee a continued rise in the price of gold and silver.

Central banks, having exhausted all conventional means of monetary easing, have moved on to the last resort option of quantitative easing and currency debasement.  Federal Reserve Chairman Bernanke has twice resorted to the printing presses, and then shamelessly explained the “virtues” of his money printing policy (in convoluted terms) to a gullible public on national television.  The subsequent absence of broad public opposition to a policy that is certain to ultimately destroy the financial well being of most Americans seems based on ignorance and/or indifference.

One American who is not ignorant or indifferent to the Fed’s policy of printing money issued a dire warning this week on the dangerous path the Federal Reserve has taken.  The reason we should all pay great attention to this warning is because it was issued by a powerful policy maker at the Federal Reserve.

According to Reuters, Richard Fisher, President of the Dallas Federal Reserve stated in a speech that the debt situation in the U.S. is at a “tipping point.” He is quoted as saying, “If we continue down on the path on which the fiscal authorities put us, we will become insolvent.  The question is when”.   Bank President Fisher further said that no additional extraordinary measures should be taken when the current round of money printing ends in June of this year.

We shall see what happens comes mid year when QE2 is scheduled to end.  The problem facing the Fed is that they are out of conventional policy bullets to ease credit conditions with rates already at zero.  The ease and apparent lack of consequences in printing money has made additional quantitative easing a very seductive method of  allowing huge deficit spending by the government.  QE2 is a thinly disguised monetization of the Federal deficit in which the Federal Reserve purchases government debt from the primary dealers after they purchase the debt at Treasury auctions.

Government officials argue that unprecedented deficit spending and quantitative easing are necessary to stimulate economic  growth, but this theory has not worked in the real world.  Despite trillions in stimulus spending,  job creation and economic growth have been extremely weak and are likely to remain so according to economists Kenneth Rogoff and Carmen Reinhart who wrote This Time Is Different: Eight Centuries of Financial Folly.  According to Rogoff and Reinhart, economic growth is subpar when public sector debt exceeds 90% of GPD which the U.S. and many other developed nations have already surpassed.  In addition, a recovery of the job and housing markets after a financial crisis take many years due to the burden of excessive levels of debt.  Ultimately, Rogoff and Reinhart predict that austerity measures will need to be imposed along with some type of debt restructuring.

Is the U.S. capable of reducing spending and  instituting austerity measures? Cutting deficits means cutting payments to a long list of incomeless recipients who really don’t care where the entitlement money comes from.  Those still actually paying taxes will object strongly to any proposed tax increase to fund government spending.  Unable to cut spending or raise taxes leaves the Government with one bad option – print more money.

Politicians, who value getting elected above all else, are likely to strong arm the reliably compliant Federal Reserve Chairman Ben Bernanke to “come to the rescue” again with QE3.   In the minds of politicians and Federal Reserve officials, there will always be very compelling reasons to continue borrowing and money printing.  With the expected retirement of Federal Reserve Bank of Kansas President Thomas Hoenig this October, the Federal Reserve will be dominated by dovish members who favor the easy money policies of Fed Chairman Bernanke.  President Hoenig is one of the few Fed members who oppose continued zero interest rates and quantitative easing.

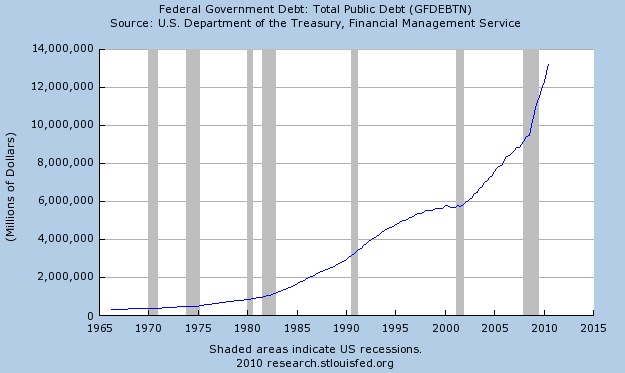
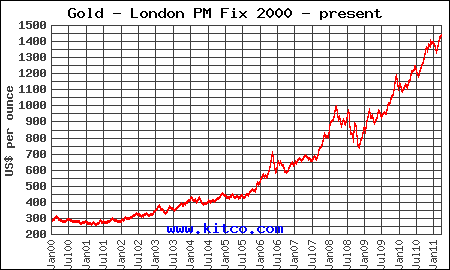
The correlation between parabolic increases in government debt and the price of gold is clear.   Since 2000 both government borrowing and the price of gold have been closely correlated as seen below.  The increased value of gold directly reflects the decreasing value of paper money.

A nation that has reached the limits on taxation and borrowing has few viable policy options other than a continuing series of quantitative easing programs.  Current government policies, if left unchanged, virtually guarantee a continued increase in the price of precious metals.

TOTAL PUBLIC DEBT

GOLD PRICE - COURTESY KITCO.COM

Gold and Silver Prices Push To New Highs, Gold Silver Ratio Drops To 28 Year Low

Gold and silver prices, as measured by the London PM Fix Price, moved to new highs on the week.

Gold, as measured by the closing London PM Fix Price, gained $16 per ounce on the week and hit an all time high of $1,447 on Thursday.  After soaring 30% last year, investors still have plenty of reasons to allocate part of their portfolio to precious metals.

Precious Metals Prices
Fri PM Fix Since Last Recap
Gold $1,436.00 +16.00 (+1.13%)
Silver $37.68 +2.53 (+7.20%)
Platinum $1,752.00 +32.00 (+1.86%)
Palladium $754.00 +27.00 (+3.71%)

Silver was once again the standout performer among the precious metals, gaining $2.53 per ounce on the week.  The price of silver has now risen by over 10% in the past two weeks and is up from a yearly low of $27 in late January.  Silver has far outpaced the gains in gold, which has resulted in a decline in the gold/silver ratio to 38, which is the lowest since late 1983.  A return to the long term historical gold/silver ratio would result in silver prices approaching $100 per ounce.

SILVER - COURTESY STOCKCHARTS.COM

The surge in silver prices caused the CME to increase margin requirements on silver futures, which contributed to a pullback in prices on Thursday.  The move by the CME was seen by some as a manipulation tactic to bring down the price of silver, but increased margin requirements are common when prices are rapidly increasing.  Small and underfunded speculators may have to liquidate, but in the long term silver will merely move from weak hands to strong hands.  Increased margin requirements on highly leveraged positions can produce a short term sell off, but it does nothing to change long term fundamentals.

Platinum and palladium, which both lost over 3% last week, gained on the week as fears of reduced industrial demand were eased by estimates of the huge reconstruction cost in Japan.  The rebuilding of Japan is likely to result in higher prices for all types of commodities and an increased rate of global inflation.

Gold Price Hits All Time High, Silver At 31 Year High

The price of gold hit an all time highs for the second day in a row, while silver prices moved up to a new 31 year high.

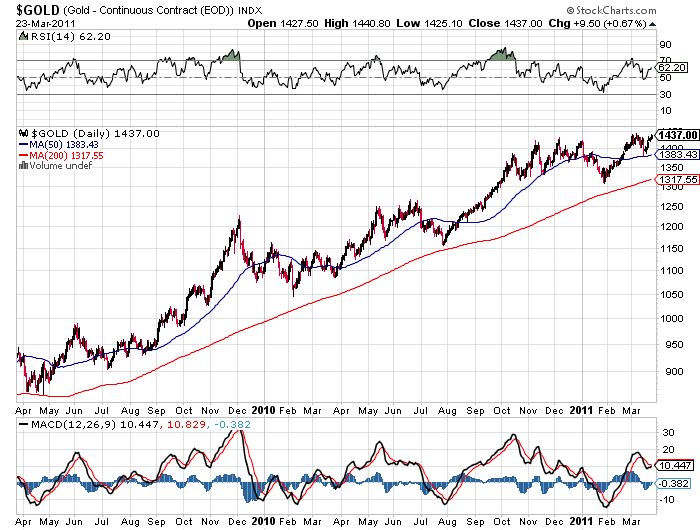
As measured by the closing London P.M. Fix Price, gold reached an all time high of  $1,447.00 up from yesterday’s all time high of $1,439.50.  The previous record London Fix Price was $1,437.50 on March 7th.   The all time record high intraday price of gold was also reached on March 7th at $1,444.95.  Earlier in the day, Comex gold futures had hit an all time high of $1,448.60 before a pull back erased the day’s gains.  In late afternoon trading the bid on New York spot gold was $1,431.30.

Silver futures scored another new 31 year high at $38.18 before sliding to $37.45 in New York spot trading.   The closing London P.M. Fix Price for silver was $37.78.

GOLD - COURTESY STOCKCHARTS.COM

In 2010, the price of gold advanced by 30% as investors grew increasing nervous about the value of paper currencies and the increasing threat of inflation.  The U.S. Federal Reserve policy of printing money to fund government deficits sets a horrendous precedence and it appears that other central banks will soon be conducting their own versions of quantitative easing.

The European Central Bank is struggling to prevent numerous sovereign defaults in an effort to preserve the European Union and monetization of the debt seems to be the only feasible “solution”.   Japan, the most heavily indebted developed nation in the world, needs hundreds of billions of dollars for reconstruction after a devastating earthquake and the printing press seems to be their only option.

Reflecting on the fiscal and monetary policies being conducted by the U.S. Government, Warren Buffet stated that “We’re following policies that will lead to a lot of inflation down the road unless changes are made.  The U.S. can’t run the kind of deficits we’re running and other policies without it being enormously inflationary”.

Unfortunately, intelligent changes are not being made and the ruinous policies of central banks seems likely to continue at an accelerated rate.  Gold has broken out to new highs and should see significant price gains in 2011.

Sprott Physical Gold Trust (PHYS) Advantages Over SPDR Gold Shares Trust (GLD)

Investors seeking to increase or establish positions in the gold market have been pouring money into gold trusts. The largest gold trust is the SPDR Gold Trust Shares (GLD) which, since its launch in November 2004, has seen huge investor demand. The GLD currently holds over 39 million ounces of gold valued at $55.5 billion.
The Sprott Physical Gold Trust (PHYS), which began trading on the New York Stock Exchange in late February 2010, is similar to the SPDR Gold Trust Shares in that the investor owns an undivided, fractional interest in gold held by the trust. The PHYS, however, has some major differences from the GLD which may result in an investor preference for PHYS.

As detailed below, the advantages of the PHYS over the GLD are a much lower tax rate on gains and government custody of the physical gold backing the PHYS.

PHYS is not an exchange traded fund (ETF) but rather a closed-end mutual fund trust which means that the physical gold holdings and investor units outstanding do not change.  The PHYS holdings remain constant based on the initial trust offering.  The PHYS holds over 820,000 ounces of gold valued at $1.18 billion.

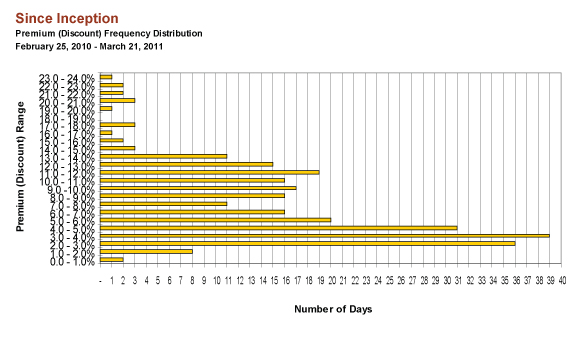
As with any closed end fund, the net asset value of the PHYS can trade at a discount or premium to the market value of gold held by the trust.   Since its creation, the PHYS has consistently traded at a premium to its net asset value.  The premium has at times reached a substantial 24%.  To avoid paying an excessive premium, potential investors in PHYS should compare the net asset value to the purchase cost of PHYS.

PHYS Premium to net asset value - source: Sprott Gold Trust

The premium paid by an investor to own the PHYS is based on two major factors –  very favorable tax treatment and extremely secure custody holding  of the physical gold that backs the PHYS as explained below.

Discounts or premiums to net asset values also occur with the GLD ETF, based on investor supply and demand during the course of daily trading.  Premiums or discounts on the GLD, however, are extremely small, typically ranging only plus or minus 0.5%.  The very small discount or premium on the GLD is due to the complex manner in which the fund is structured.

The GLD has a complex mechanism by which shares can be “created or redeemed” by the GLD Trust via Authorized Participants.  Authorized Participants are large Wall Street investment firms that profit by arbitraging against a premium or discount to the GLD.  The transactions of the Authorized Participants can result in significant changes in gold holdings by the GLD .  The SPDR Gold Trust was structured in this manner so that the price of the GLD would closely correspond to the underlying price movements in gold.

The PHYS holds 99.5% of its assets in physical gold bullion stored at the Royal Canadian Mint in Ottawa, Canada.  The gold backing the PHYS is specifically allocated by the Royal Mint to PHYS.  The Trust does not invest in gold certificates or other paper instruments.  The Royal Canadian Mint of the Canadian Government is responsible for any loss or damage to the bullion held for the PHYS and the gold bullion is subject to annual audits.

The custodian for the gold held by the SPDR Gold Trust (GLD) is HSBC Bank in London. The GLD prospectus notes that the gold held by the Trust is specifically allocated to GLD and that the allocated gold bars “are not a part of the bankrupt’s estate in the event of the bankruptcy of the Custodian”.  In addition, the gold bars allocated to the GLD are identified by number and updated everyday.  After witnessing the failure of very large banks in 2008, investors may be more secure with a Government custodian.

A very significant advantage of the PHYS according to Sprott Asset Management is that investors holding units for more than one year are only taxed at the capital gains rate of 15% compared to a 28% tax rate on gold ETFs and physical gold coins. The gold held by investors in the GLD ETF is considered to be “collectibles” by the IRS and thus taxed at a higher 28% rate.

The prospectus for the PHYS discloses that the fund does have a physical redemption feature that is exercisable on the 15th of each month and processed at the end of the month, a setup which is designed to discourage redemptions. Given the inconvenience, cost and delays involved in redeeming units for physical gold, the Trust expects that most investors will chose to sell their units rather than redeem them for gold bullion.

The reason why the Sprott Physical Gold Trust discourages redemptions is due to the fact that a redemption would be considered a sale of gold by the Trust for tax purposes and thus be taxed at 28%. The taxes paid by the Trust would be passed on to shareholders who would then be liable for taxes above the 15% capital gain rate based on their pro rata share of the gain. Sprott Management believes that it is highly unlikely that any investors would chose redemption versus selling their units on the market.

In any event, even if a partial redemption of units occurred, the pro rata gains would still result in a tax rate significantly less than the 28% that applies to gains on the sale of an ETF. In the extremely unlikely event that all units were physically redeemed, an investor’s tax rate would still be no higher than the 28% rate that applies to an ETF.

Long term ownership of the PHYS in a non tax deferred account thus conveys significant tax advantages over an ETF.  Net investment gains on the PHYS could result in a 13% higher return than an equivalent investment in a gold ETF.  Investors should consult with their tax expert and read the PHYS prospectus before investing.

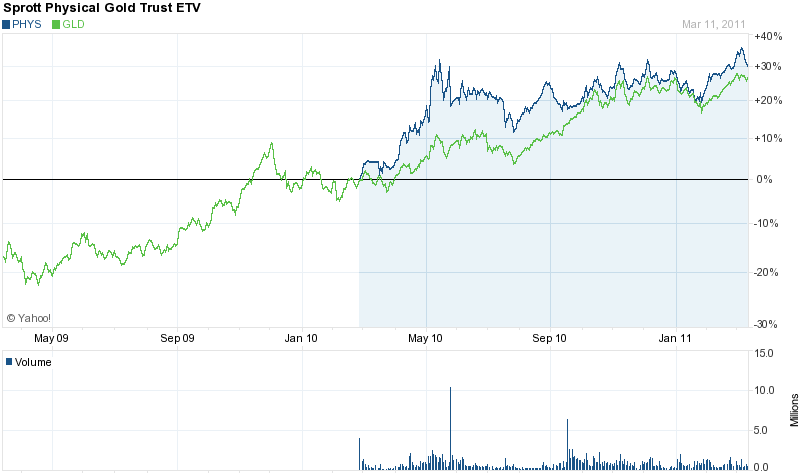
Since its inception, the PHYS has had a higher return than the GLD.

PHYS VS GLD

The PHYS fund is managed by Sprott Asset Management based in Toronto, Canada. Sprott offers hedge funds, mutual funds, fixed asset funds, limited partnerships and bullion focused funds. The holding company, Sprott, Inc. trades on the Toronto Stock Exchange under the symbol “SII”.


US Mint Boosts America the Beautiful Silver Bullion Coin Production

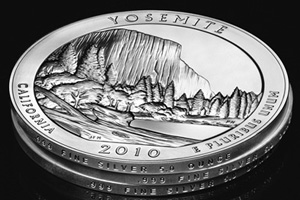
The United States Mint plans to issue the first of this year’s America the Beautiful Silver Bullion Coins in late April. Last year, the series caused quite a stir when the low mintages made them more akin to scarce collectibles than bullion coins. For the current year, the US Mint has planned significantly higher production levels that will eliminate some of the excitement, but hopefully allow the coins to trade as intended, based primarily on the precious metals content.

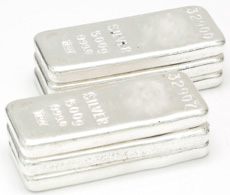
The coins are struck in 5 troy ounces of .999 fine silver, representing the first time the US Mint has offered bullion coins with a weight greater than one ounce. The designs are exact duplicates of the America the Beautiful Quarters series, which features five different releases annually depicting National Parks or sites in each of the states and territories. The oversized bullion coins also include edge lettering indicating the weight and fineness of the precious metals content.

Each of the 2010-dated bullion releases had a limited production of 33,000 units each. The US Mint tried to solve the problem of high demand for a limited supply by requiring their primary distributors to follow specific terms and conditions, which capped premiums and sought broad distribution.

Recent reports indicate that the US Mint has produced 125,000 of the first 2011-dated releases featuring Gettysburg National Military Park. With production closer to market demand, the same terms and conditions will not apply for the distribution of this year’s coins. However, in order for the primary distributors to participate, they must certify that they have sold their complete allocation from last year in accordance with the rules established by the US Mint.

The remaining 2011-dated releases will feature Glacier National Park, Olympic National Park, Vicksburg National Military Park, and Chickasaw National Recreation Area. These will be released at intervals throughout the year.

With higher mintages, there will be less collector allure for the 2011 coins, however, the status of the 2010 coins as desirable rarities may be reinforced. If the US Mint manages to keep production levels high for the reminder of the twelve year series, the 2010 coins will take on the status of key dates for the bullion series.

Gold and Silver Prices Gain on Week

As measured by the London PM Fix price, gold and silver prices gained on the week after declining approximately 1% each in the previous week.  Gold gained $8.50 per ounce on the week to $1,420.00.  Silver was the stand out gainer on the week with a 3% or $1.05 per ounce gain.   As the situation in Japan and Libya stabilized somewhat, the recent panic selling in financial markets subsided as bargain hunters moved in, although in late trading, stocks gave up much of their gains.  Gold and silver also pulled back slightly in New York trading with gold at $1417.80 and silver at $35.10.
As market analysts worried about the potential for slower economic growth due to the disaster in Japan, classic industrial metals saw further price erosion after significant losses in the prior week.  Platinum fell by $57 on  the week and palladium dropped by $27.  Over the past two weeks, platinum has declined by $108 or over 6% while palladium was off $84 for over a 10% loss.

Precious Metals Prices
Fri PM Fix Since Last Recap
Gold $1,420.00 +8.50 (+0.60%)
Silver $35.15 +1.05 (+3.08%)
Platinum $1,720.00 -57.00 (-3.21%)
Palladium $727.00 -27.00 (-3.58%

As discussed last week , the fundamental forces propelling gold higher remain intact.  The devastation in Japan will require massive amounts of additional borrowing by a government already reaching the limits of its borrowing ability.  Expect Japan to follow the policy of the Federal Reserve with massive amounts of quantitative easing.   The currencies of Japan, Europe and the United States all face a loss of real purchasing value as governments engage in money printing to meet spending and borrowing needs that have spiraled out of control.

The toxic combination of  low economic growth, weak personal incomes and public resistance to additional tax increases have left governments with no other choice than to engage in massive expansion of the public debt.  As constraints on governments’ borrowing ability have grown, the last resort option of money printing will continue to result in the debasement  of currencies.  Increases in the price of precious metals have no upside limit under this scenario.

Silver remains the primary investment choice of many as the metal reasserts itself in relationship to the price of gold.  If the very long term historical gold silver ratio reasserts itself as many expect, the price of silver could easily close in on the $100 per ounce level.

SLV - Courtesy yahoo finance

US Mint Gold Bullion Sales Rise with Gold Buffalo Launch

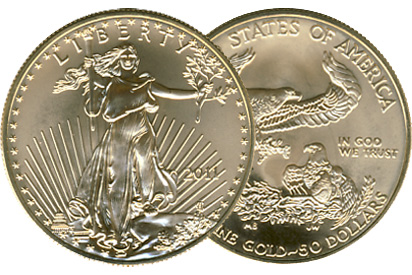
The number of ounces worth of gold bullion coins sold by the United States Mint rose in the latest week, bolstered by the launch of the 2011 Gold Buffalo coins. Silver bullion sales showed a slight increase, as the year to date total for American Silver Eagles moved above 11 million.

The United States Mint sells bullion products through a network of authorized purchasers. This small group of primary distributors may buy the coins directly in bulk quantities, based on the market price of the metals plus a mark up. The coins are then resold to other dealers and the public for broader distribution.

At the current time, the available products include one ounce Silver Eagles; one ounce, half ounce, quarter ounce, and tenth ounce Gold Eagles, and one ounce Gold Buffaloes. The 5 ounce America the Beautiful Silver Bullion Coins are expected to be released in late April. The status of the Platinum Eagle coins remains uncertain.

US Mint Bullion Coin Program Sales 3/16/2011 (ounces)

Prior Week Month to Date Year to Date
American Silver Eagle 748,500 1,417,000 11,079,000
American Gold Eagle 24,000 42,500 268,500
America the Beautiful Silver 0 0 0
American Platinum Eagle 0 0 0
American Gold Buffalo 21,500 0 21,500

Total ounces of gold sold for the week ending March 16, 2011 was 45,500. This consisted of 24,000 ounces of American Gold Eagles and 21,500 ounces of the newly released 2011 Gold Buffalo coins. The latter are only available in one ounce size and are struck in 24 karat gold.

In the past week, the US Mint recorded sales of 748,500 ounces of American Silver Eagles. This is up from the sales of 668,500 reported for the previous period. Sales levels for silver bullion continue to be restrained as the US Mint imposes its allocation program, which rations the available supply amongst the authorized purchasers.