May 13, 2024

Is Gold Losing Its Safe Haven Status?

In the view of many, recent world events should have resulted in soaring gold prices as investors flocked to gold, the ultimate safe haven investment.  Oddly enough, major sell offs in world stock markets due to turmoil  in the Middle East and a massive earthquake in Japan did nothing to push gold above its all time closing high of $1,440 hit in early March.

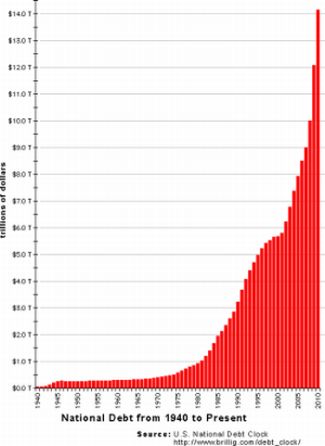
As if that weren’t enough, the Bank of Japan flooded its financial markets with yen equivalent to half a trillion U.S. dollars while the U.S. Federal Reserve continued its own money printing campaign to supplement its zero interest rate policy.  In addition, many suspect that in order to prevent Ireland, Greece, Portugal and Spain from defaulting on their sovereign debt, the European Central Bank will have no option but to resort to the printing press.

Traditionally, gold is held in a portfolio due to its negative correlation with returns from more traditional investments such as stocks and bonds.  Gold, as a safe haven investment, is supposed to offset the declines in other asset classes that occur during times of great economic distress.  Exactly how did gold perform relative to the financial markets, using the Dow Jones as a benchmark?

The recent sell off in the Dow Jones Industrial Average resulted in a loss of over 550 points or a 4.5% decline from the yearly high reached in early February.  The price of gold during this tumultuous period dropped by over $40 per ounce resulting in a loss of 2.9% from its all time high.  Although the stock market experienced an intraday loss of 300 points earlier this week, a decline of 4.5% hardly qualifies as a financial panic, thus rendering moot the recent action of gold versus stocks.

The real test of gold as a safe haven asset needs to be examined at a time of extreme financial panic such as was experienced during 2008.  Most people expect gold to perform the best during times of crisis or to be a hedge against a declining stock market.  Unfortunately, those who expected gold to insulate them from losses during the financial meltdown of 2008 were disappointed.

Brutal selling hit virtual every asset class during the panic of 2008 and gold was no exception to the surprise of many.  In late 2008, gold experienced a 30% drop from its yearly high in the $1,000 range to a low of $700 in November.  Regardless of asset allocation, virtually every investor lost money during 2008.  Why did gold decline so dramatically in 2008 instead of performing as a safe haven asset?  It could be argued that gold’s sharp decline during 2008 was due to the fact that highly leveraged investors held large gold positions believing that this would reduce risk in their portfolios.  As other asset classes were decimated, investors receiving multiple margin calls were forced to liquidate everything, including gold positions.

Looking further than the snapshot year of 2008, it can be argued that gold was in fact a safe haven since it outperformed stocks.  At the low of $700 per ounce reached in late 2008, gold was still above its low of $615 reached during early 2007.  Stocks by contrast fared much worse with the Dow Jones plunging 50% from its high of 14,000 reached during 2007.   The Dow Jones is still over 2,000 points below its 2007 high while gold has more than doubled since 2007.  As can be seen on the chart above, gold has outperformed the Dow by about 200% since 2006.

Will gold protect a portfolio during the next financial panic?   Based on the above analysis, gold outperformed stocks during the financial panic of 2008 and significantly outperformed stocks since 2006.  In an uncertain and volatile world, gold is one hedge that has worked quite well for long term investors.

Gold and Silver Prices Hold Gains, Rise in Late Trading

Gold and silver prices declined slightly on the week, as measured by the closing London PM Fix prices.  Gold finished the week at $1,411.50 for a loss of $15.50 while silver declined fractionally by 33 cents to close at $34.10.  However, as markets assessed the impact of a slowing world economy, higher inflation, higher oil prices and the massive earthquake in Japan, prices for gold and silver saw significant price improvement in late Friday New York trading.  Gold moved up $9.20 to $1,421.30, while the silver price rose $.60 to $35.90.

In a week of tumultuous economic and political news, platinum and palladium saw significant declines on the week as investors worried about reduced industrial demand in the face of a slowing world economy.

Precious Metals Prices
Fri PM Fix Since Last Recap
Gold $1,411.50 -15.50 (-1.09%)
Silver $34.10 -.33 (-0.96%)
Platinum $1,777.00 -51.00 (-2.79%)
Palladium $754.00 -57.00 (-7.03%

The minor price consolidation for gold and silver over the past week are impressive considering the strong gains of the previous month.  Strong bull moves are never straight and price corrections should be seen as an opportunity to increase positions.

None of the concerns that have propelled the precious metals higher have been resolved.  There is a strong probability that one or more of them will blow up putting major financial pressures on governments that are already staring into the abyss due to untenable levels of debt.  Which event will trigger another financial crisis is impossible to predict, but here’s a quick rundown of the obvious suspects:

1.) The final implications of the massive Japan earthquake will take weeks to assess but is certain to add huge financial stress to a country already overwhelmed by the highest debt to GDP ratio in the world.  The Japanese central bank has already indicated it is ready to loosen monetary conditions to calm financial markets, which may be a signal that they will follow the U.S. Fed’s lead and engage in a significant amount of quantitative easing or money printing.  The cost of credit default swaps on Japanese government debt widened significantly reflecting the need for increased borrowings by a government already overwhelmed by indebtedness.  As investors become increasingly alarmed at the prospects of default on government debt and currency debasement, the flight to gold will accelerate.

2.) The sovereign debt crisis in Europe continues to spiral towards a crisis as the European Central Bank attempts to solve a debt crisis with more debt.  Monetary authorities worldwide are out of standard policy options and will follow the lead of the U.S. Fed by printing money.   The implications of money printing on a global basis removes all constraints on the appreciation limits of the precious metals.

3.) The largest bond fund in the world dumps all longer dated U.S. Treasury securities. Bill Gross, manager of PIMCO, the largest bond fund in the world warns that when QE II stops in June, there will not be enough buyers for government debt, leading to a funding crisis for the U.S. Government.  If one of the planet’s smartest and biggest bond investors thinks it’s time to sell U.S. Treasuries, the risk of contagion becomes substantial.  Foreign governments currently purchase half a trillion dollars of U.S. debt every year and are becoming alarmed by Fed policies which make their debt investments look riskier by the day.  How long will it be before other major investors in U.S. debt decide to follow Bill Gross’s lead and initiate a massive sell off in U.S. treasuries?

4.) Oil prices have pulled back in recent days but the situation remains volatile.  A small group of protesters in Saudi Arabia were immediately dispersed with a hail of rubber bullets from security forces, an action that can only further inflame the passions of those who feel repressed by regimes in Saudi Arabia and other oil producing countries.  Chaos in Saudi Arabia would quickly put the world economy back into an economic meltdown that governments may be unable to contain.

SILVER - COURTESY STOCK CHARTS.COM

The last upward move in silver last four months from September through the end of 2010 with a price gain of over 70%.  After a brief correction early in the year, investor and industrial demand pushed silver to a new yearly high.  A rally equivalent to that of last year would drive silver up to the $50 level by June.

iShares Silver Trust Holdings Continue to Skyrocket

Silver holdings in the iShares Silver Trust (SLV) continued to skyrocket, while holdings of gold in the SPDR Gold Shares Trust (GLD) experienced a modest increase.

The iShares Silver Trust (SLV) holdings increased by 209.54 tonnes in the latest week.  The prior two weeks have seen increases of 189.29 tonnes and 164 tonnes.  Total holdings of the SLV are now 52.49 tonnes higher than at the beginning of the year.  The SLV holds 352.8 million ounces of silver valued at $12.76 billion.

The holdings of silver in the iShares Silver Trust have now exceeded peak holdings reached at the beginning of the year.  Silver has moved relentlessly higher in price since last August.  After a brief price correction in January which brought silver down to the $26 level, silver prices have exploded to more than $36 per ounce, a gain of 38% in less than two months.

Given the huge run up in the price of silver, it is not surprising to see holdings of the SLV increase dramatically.  The SLV is a proxy for investors who chose to invest in silver without the cost and inconvenience of holding physical silver.  Purchasing the SLV allows an investor to take an immediate position in silver and without the markups associated with physically purchasing bars or coins.

The annual expense ratio of the SLV is only 0.5% compared to common markups of 5% to 10% when purchasing physical bullion or coins from a dealer.  The SLV has been wildly popular with investors since it was launched and has provided huge returns to patient investors.   The SLV has risen from below $10 in October 2008 to its closing price today of $35.27 for a gain of over 250%.  A purchase of a thousand shares of the SLV at the low of $9.13 in October 2008 would have resulted in profits of $26,140.

SLV - Yahoo Finance

It has been over 30 years since silver hit its all time high price of $48.70 in January 1980.  Huge investment and industrial demand as well as physical shortages of silver are all factors that could easily push silver to a new all time high.  Silver has been making up for lost time and has dramatically outperformed the price movement in gold.  A reversion to the centuries old gold silver ratio could easily push silver prices towards the $100 per ounce level.

GLD and SLV Holdings (metric tonnes)

9-March-11 Weekly Change YTD Change
GLD 1,217.30 +6.34 -63.42
SLV 10,974.06 +209.54 +52.49

Holdings in the SPDR Gold Shares Trust (GLD) saw a jump in holdings of nearly 7 tonnes on Monday of this week, which is the largest increase in daily holdings seen in the past two months.  The GLD increased holdings by over 6 tonnes for the week after modest declines in the previous two weeks.   Total GLD holdings are still lower than the beginning of the year by 63.42 tonnes.  The GLD currently holds 39.14 million ounces of gold valued at almost $56 billion.

Since its launch in November 2004 when gold was trading at $445 per ounce, the GLD has been an extremely profitable investment.  As the price of silver broke out and hit new highs, gold has still not decisively broken through its trading range in the low $1400’s.   Gold made a strong move up from $1150 last August and has been consolidating sideways since breaching the $1400 level.

As Silver Prices Soar, Silver Coins Get Smaller

Ten years ago, one ounce silver bullion coins could be purchased for around $7 each. This reflected market silver prices below the $5 level. As recently as one year ago, the prices for one ounce bullion coins had risen to around $18 each. Following the dramatic rise in the silver price experienced in the last five months, newly minted one ounce silver bullion coins from a major world mint are now priced around $39, assuming a purchase in quantity.

Silver has been called “poor man’s gold”, but after the significant rise in price, even the traditionally smallest sized coins are becoming expensive. Thus, it was only a matter of time before smaller sized coins would be introduced.

Last month, the Perth Mint of Australia began selling one-tenth ounce Silver Koala coins. Previously, this series had been offered in sizes ranging from one-half ounce to 1 kilo. Other numismatic and bullion coin offerings from the Perth Mint have also been available in sizes starting at one-half ounce, but this seems to be the first instance that a one-tenth ounce size has been available.

As will generally be the case with silver products, the smaller weight offerings carry a larger premium than than larger weight products. This can be the result of the fixed costs associated with manufacture or volume discounts which may be available for purchases in bulk quantities.

The Perth Mint’s website shows the one ounce 2011 Silver Koala priced at US $41.88, reflecting a premium of $5.57 or 15.34%. The one-tenth ounce version is priced at $13.76, reflecting a premium of $10.13 or 279%! (All prices at time of post.)

Obviously when purchasing silver for investment purposes, it makes sense to pay the lowest premium possible. That way, you will get more silver for your money and won’t risk seeing contraction of premiums offset gains.

The move by the Perth Mint to smaller sized silver coins is certainly an interesting one. How long will it be before other world mints follow suit?

Gold Price Hits All Time High, Silver at 31 Year High

The Week in Precious Metals

Gold and silver continued their winning ways this week. Measured by the closing London PM Fix prices, gold gained $24.50 or 1.75%, while silver rose $1.89 or 5.81%. On an intraday basis, the gold price hit an all time high of $1,440.31 while silver traded to a new 31 year high at $35.55.

Gold’s advance for the week came after solid gains of $19 per ounce in the previous week.  Concerns about a weak dollar, skyrocketing oil prices and continuing turmoil in oil producing nations in the Middle East all contributed to reinforce the importance of gold for wealth diversification and as a hedge against a range of adverse economic conditions.

The ongoing surge in oil prices does not reflect an actual shortage in crude production.  Inventories remain robust and excess producing capacity seem adequate to replace all of Libya’s roughly 2 million barrels a year of production.  Rising oil prices reflect the fear that social unrest will spread to Saudi Arabia, the King of oil producers.

Saudi Arabia is surrounded by countries that are in massive social, religious and economic upheaval.   The contagion of violence and revolution has spread throughout the area included Algeria, Libya, Tunisia, Iran, Yemen and Bahrain.  If Saudi Arabia follows the path of its neighbors, the price of oil would quickly be on its way to $200 a barrel.  Small protests in the Saudi Kingdom this week may be a prelude to much larger upheaval in the months ahead.

Oil - Stockcharts.com

The money printing and inflation creation campaigns of the Federal Reserve seem to be giving the struggling U.S. economy some traction and there have been discussions by Fed members regarding the termination of quantitative easing after the current $600 billion round of money printing ends in June of this year.  However, much higher oil prices would quickly put the U.S. economy back into recession since consumer disposable incomes would be drastically reduced.

The Fed’s only easing option to fight another recession is to institute another round of money printing, which at some point leads to an inflationary spiral.  In Senate testimony this week, Fed Chief Bernanke admitted that “sustained rises in the prices of oil or other commodities would represent a threat both to economic  growth and to overall price stability.”  It is no surprise that gold is looking like a sensible option to more and more investors.

Precious Metals Prices
Fri PM Fix Since Last Recap
Gold $1,427.00 +24.50 (+1.75%)
Silver $34.43 +1.89 (+5.81%)
Platinum $1,828.00 +37.00 (+2.07%)
Palladium $811.00 +26.00 (+3.31%

Platinum regained some of its luster with a gain of $37 after last week’s loss of $45, while palladium was up $26 following last week’s loss of $62.

After a gain of almost 2% last week, silver continued its sharp upward price movement and gained $1.89 or almost 6% on the week.  On a percentage basis, silver’s gain on the week was almost three times the gain seen by gold.  Since last summer, silver has vastly outperformed gold, a trend that may continue.

If the gold to silver ratio returns to its long term historical trend of 16, the price of silver would approach $100 per ounce at the current price of gold.

The price of the ProShares Ultra Silver (AGQ)  jumped $23 points on the week to close at $204.19 while the popular iShares Silver Trust (SLV) jumped $2 dollars or 6.2%, closely tracking the price of the metal.

AGQ - Yahoo Finance

Historical Gold Silver Ratio Predicts $100 Silver Price

The gold silver ratio chart below shows the dramatic fashion in which silver has been outperforming gold since last August.  The gold silver ratio is calculated by dividing the price of gold by the price of silver.  A declining gold silver ratio indicates that silver has been outperforming gold.   The gold silver ratio has declined from 65 last summer to a current level of 41.

Since August 2010 gold has moved up 22% from the $1,175 level while silver has soared 92% from the $18 range.  Does the declining gold silver ratio indicate that silver prices are due for a correction or is this a fundamental change in the price relationship?

The gold silver ratio has averaged around 60 since the mid 1970’s.  In January 1980, as silver hit its peak price of $48.70, the gold silver ratio briefly hit 16, but rapidly rose as the Hunt brother’s attempt to corner the silver market came undone and silver prices collapsed.

Gold Silver Ratio - Courtesy Stockcharts.com

Will the current decline in the gold silver ratio continue?  From a very long term historical perspective, a gold silver ratio in the 16 range has been the norm.  Since ancient times, it has typically taken 16 ounces of silver to purchase one ounce of gold.  Interestingly, the earth’s  reserves of silver exceeds that of gold by roughly 16 times.  If this ultra long term relationship were to reassert itself, silver would sell for approximately $90 per ounce based on the current price of gold.  With gold at $2,500 per ounce, silver would have a value of $156 per ounce at the historical gold silver ratio of 16.

The fundamental reason that may drive the gold silver ratio back to the 16 range is growing demand by small investors.  Silver, known as the poor man’s gold has seen a huge surge of public demand, as evidenced by record sales of the Silver Eagles.

Increasing public recognition of the need to preserve wealth against paper currencies will continue to propel silver to historic highs.  Simply put, silver is more affordable to the average buyer who cannot afford the higher priced Gold Eagles.  Silver has a lot of catching up to do and we are probably in the early stages of a fundamental reversion to a lower gold silver ratio which will send silver prices soaring past $100 per ounce.

Gold and Silver Prices Higher as Platinum and Palladium Sell Off

As turmoil reigned in the Middle East and worries mounted over the reduction of oil supplies, gold and silver proved their safe haven status as both moved higher in price.

After a very solid gain of $1.94 per ounce last week, silver continued its upward move with another gain of $.60.  The closing London Fix Price for silver was $32.54 for a gain of 1.88% on the week.   The normal price consolidation and pullback in silver that extended from the beginning of the year into the end of January was the setup for a solid breakout into new highs.  Silver has now advanced over 20% from the lows of January.

SILVER - COURTESY STOCKCHARTS.COM

Besides the safe haven/currency alternative lure of silver, the fundamentals in silver are forecasting further dramatic price gains.   There have been numerous reports documenting physical shortages of silver as well as huge investment demand in the U.S., India and China.

One solid indication of the huge demand for physical silver is evidenced by the backwardation in prices.  Typically, the forward price of a commodity will exceed the cash price due to the expenses of insurance, warehousing and inventory financing.  When a commodity has a normal upward pricing curve to reflect a higher futures cost, the situation is termed contango.  Backwardation, the unusual case where the cost of the physical commodity is higher than future prices, is a classic indicator of surging demand.  Another indicator of the great demand for physical silver is the four year low of Comex warehouse silver.

Precious Metals Prices
Fri PM Fix Since Last Recap
Gold $1,402.50 +19.00 (+1.37%)
Silver $32.54 +0.60 (+1.88%)
Platinum $1,791.00 -45.00 (-2.45%)
Palladium $785.00 -62.00 (-7.32%

Gold also continued its upward move with a gain of $19 per ounce after an advance of $19.50 in the previous week.  To understand the wealth preservation appeal of gold, one needs only to look at the exponentially increasing level of  U.S. debt.  Ultimately, the staggering amount of sovereign debt can be serviced only through inflation and dollar debasement which is what the Federal Reserve is currently orchestrating through quantitative easing (money printing).

US NATIONAL DEBT - THE ROAD TO FINANCIAL OBLIVION

The U.S. dollar also appears to be losing its cache as the “safe haven” currency.  Despite the unprecedented turmoil in the Middle East and the rise in oil prices, the U.S. dollar has weakened over the past two weeks.  By comparison, during the financial crisis of 2008, the U.S. dollar appreciated 24% against other major currencies.

The surge in oil prices has led to concerns that the U.S. and world economies will see much lower growth as higher oil prices devastate consumer disposable income.  A weakened world economy would probably lead to lower demand for industrial metals such as platinum and palladium which both declined this week.  Platinum sold off by $45 and palladium was rocked by a $62 loss from the prior week.

US Mint Gold and Silver Eagle Bullion Coin Sales

Sales of the United States Mint’s gold and silver bullion coins remained on a relatively steady pace with recent weeks. Sales of 908,000 ounces worth of American Silver Eagle coins were recorded, along with 28,000 ounces worth of American Gold Eagles.

In the previous week, the Mint had recorded bullion sales of 833,500 ounces of silver and 31,500 ounces of gold.

The US Mint utilizes a network of authorized purchasers (AP’s) to distribute bullion products to the public. This small group of private sector businesses are allowed to purchase bullion coins from the Mint in bulk quantities, and in turn resell them to the public. The price charged to the APs is based on the market price of the metal plus a mark up.

The mark up for Silver Eagles is currently $2.00 per coin. The mark up for Gold Eagles varies based on the size of the coin. The premium levels are 3%, 5%, 7%, and 9%, for one ounce, one-half ounce, one-quarter ounce, and one-tenth ounce sized coins, respectively.

US Mint Bullion Coin Program Sales 2/23/2011 (ounces)

Prior Week Month to Date Year to Date
American Silver Eagle 908,000 2,638,500 8,152,500
American Gold Eagle 28,000 83,500 189,000
America the Beautiful Silver 0 0 0
American Platinum Eagle 0 0 0
American Gold Buffalo 0 0 0

For the year to date, the US Mint has sold 8,152,500 ounces of silver bullion and 189,000 ounces of gold bullion. All sales have taken place for the American Eagle coins. Later in the year, 24 karat Gold Buffalo bullion coins and 5 ounce America the Beautiful Silver Coins are expected to be made available.

Silver Breaks Out of Triple Top for New Bull Move – Is Gold Next?

Triple tops are a well known chart formation that signal the potential for a price trend reversal.  A classic triple top occurs over a period of three to six months during which prices decline after hitting a series of multiple equal highs.  For the reversal pattern to register a definitive sell signal, the price must break below support levels.

A triple top has certain characteristics, each of which must be analyzed.

  • The three highs must be within reasonable price points of each other and spaced over equal time periods.
  • A previous long term uptrend must have occurred which established a definitive uptrend.
  • Volume levels tend to decrease during the formation of a triple top.  If volume increases on a pullback from the third top, more significance must be given to the potential for a significant trend reversal.
  • A triple top is not completed unless the price level breaks a key support level which would be the lowest price point on previous pullbacks from the intermittent tops.
  • A triple top chart pattern is not considered bearish unless support levels are decisively broken

Examining the chart for silver before the recent move up, we could see a pattern developing with characteristics of a triple top.  The critical support level for silver was at  the $27  level.  Silver’s inability to break resistance at the $30 level would have been at best a neutral signal and a break below $27 would have forecast further price declines.   The strong upward price movement in silver last week as it soared past the $30 area is extremely bullish and tells us that the bull market in silver is intact.

Silver - courtesy stockcharts.com

TRIPLE TOP BREAKOUT - COURTESY STOCKCHARTS.COM

Viewing the chart of gold, we can see that the same potential for a triple top exists.

Gold - courtesy stockcharts.com

Gold has been turned back three times at the $1425 level, the tops are equally spaced over a period of almost 4 months and gold has been in an established uptrend for an extended period of time.  In the case of gold, a drop below support at $1320 would be a bearish signal and reason to take a defensive posture.

Considering the strong fundamentals supporting gold, we may soon see a breakout in the price of gold similar to what we have just witnessed with silver.

Silver Soars to 30 Year High as Precious Metals Resume Upwards Trends

After a brief consolidation below the 50 day moving average in late January, silver resumed its uptrend with a vengeance.  The London PM fix price for silver closed at $31.94 up from $30.00 the previous week.  Since late January, silver has rocketed $5.50  for over a 20% gain.

Silver - courtesy stockcharts.com

The fruitless budget reduction talks in Washington, a slide in the US Dollar Index and a new high on silver are certain to ignite the precious metal markets into another major move upwards.  Most investors under the age of 50 probably don’t remember the last time silver prices have soared past $30 in the early 1980’s.

Technically and fundamentally, silver is poised to make a major move.  Price movements coming out of long bases usually have a long duration.   Silver has broken out from an ultra long base of over 25 years.  The initial move from the $5 area to $30 is simply the first phase of what should turn out to be a major upward move.

Long term silver

Silver hit an all time high of $48.70 in January 1980.  The inflation adjusted historical high for silver is $130 per ounce.  Considering the horrendous manner in which sovereign states are conducting their financial affairs and the potential for another financial crisis, the inflation adjusted high of $130 will look like a bargain price at some future date.

The closing London Fix Prices showed gains across the board from the previous week.  Silver was the standout performer with a gain of 6.5%.

Precious Metals Prices
Fri PM Fix Since Last Recap
Gold $1,383.50 +19.50 (+1.43%)
Silver $31.94 +1.94 (+6.46%)
Platinum $1,836.00 +7.00 (+0.38%)
Palladium $847.00 +25.00 (+3.04%