April 28, 2024

John Paulson Maintains Huge Holdings in SPDR Gold Shares Trust (GLD)

In 2010, John Paulson personally earned $5 billion, vaulting him into the ranks of the world’s wealthiest persons.  Incredibly, this was not a one time event precipitated by a heavily leveraged bet that just happened to turn out right.  Mr. Paulson had previously made another brilliant call prior to the financial crisis.  Based on his analysis of the subprime mortgage market, Mr. Paulson had the acumen to establish a major bearish position in mortgages, prior to the mortgage meltdown, that resulted in billions of dollars in profits.

It was how Mr. Paulson made $5 billion during 2010 that makes his every move the object of  intense scrutiny by gold investors worldwide.  Mr. Paulson believes that the Federal Reserve is determined to re-inflate every asset class possible, using whatever means necessary.  Without the “benefit” of inflation, the crushing levels of national debt would eventually lead to massive defaults and an economic disaster.   Based on this conviction, Mr. Paulson invested heavily in gold futures, the SPDR Gold Shares Trust (GLD), and other gold structured investments that resulted in his massive paycheck for 2010.

Last October, while speaking at the University Club in New York, Mr. Paulson predicted that the price of gold could easily reach $4,000 an ounce.

With Mr. Paulson’s track record, any change in his gold holdings would obviously be of great interest to gold investors worldwide.

Mr. Paulson directs most of his investments through his hedge fund, Paulson & Co, and is required to report major holdings to security regulators with 45 days after the end of each quarter.   The latest regulatory Form 13-F filing shows that Mr. Paulson’s position in the SPDR Gold Shares Trust was unchanged for the latest quarter.

At December 31, 2010, Mr. Paulson’s holdings in the GLD amounted to $4.37 billion dollars or about 8% of the total value of the Gold Trust.  The value of the GLD’s holdings are currently $53.95 billion.

Other big time successful investors also maintained or increased their holdings in the GLD.  The Soros Fund Management at year end held $655 million of GLD while PIMCO (run by super star bond manager Bill Gross) had holdings of $307.7 million.
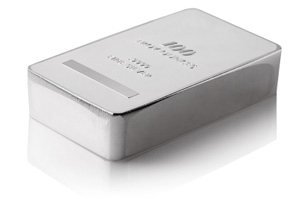
Gold ETF Holdings Stable As Silver ETF Holdings Increase

The SPDR Gold Shares Trust (GLD) holdings declined marginally on the week, while the iShares Silver Trust (SLV) increased its holdings by over 41 metric tonnes.   As both gold and silver prices consolidate in a tight price range, both the GLD and the SLV have experienced a decline in bullion holdings since the beginning of the year.

Holdings in the GLD declined by 2.43 tonnes compared to a decline of .71 tonnes in the previous week.  Total holdings have declined by 4.4% or 56.71 tonnes since the start of the new year.  The GLD currently holds 1,224.01 tonnes or 39.35 million ounces of gold valued at $53.9 billion.

The price of the GLD has traded between $128 and $139 since last October after running up from approximately $110 from the start of 2010.   The GLD was originally launched in November 2004 when the price of gold was trading at $445 per ounce.

GLD and SLV Holdings (metric tonnes)


16-Feb-11 Weekly Change YTD Change
GLD 1,224.01 -2.43 -56.71
SLV 10,411.23 41.01 -510.34

Silver holdings in the iShares Silver Trust (SLV) increased by 41.01 tonnes over the past week compared to a decline in the previous week of 38.38 tonnes.  The year to date decline of 551.35 tonnes represents a 5% drop in silver holdings.

There is no direct correlation between SLV holdings and the price of the SLV due to the mechanism by which shares are created or redeemed by the Trust via Authorized Participants.  The Trust is structured so that the value of the iShares reflects the price of silver owned by the trust.  The price of an iShare should closely track the price of one ounce of silver, less the Trust’s expenses.

The SLV’s closing price of $29.96 on February 16th is only slightly below the all time high of $30.40 reached at the beginning of the year.  Since 2010, the price of silver almost doubled from the $16 range to the current price of $30.67.

Gold Featured on Magazine Cover- Should We Be Worried?

There is a body of empirical evidence suggesting that once a particular investment category is featured on the cover of a popular magazine, a major trend change is imminent.

This theory, know as the “Magazine Cover Indicator” was first documented by Paul McRae Montgomery, a strategist at Legg Mason.  According to Mr. Montgomery, “The great value of popular magazine covers is they indicate the extent to which awareness of fundamental factors is widely shared, and therefore are unable to move prices significantly further”.

The Magazine Cover Indicator has been dismissed for being overly simplistic.  Nonetheless, Mr. Montgomery’s research shows that after a financial trend is featured on the cover of a widely distributed magazine, there is a high likelihood of a major trend reversal.  The focus of Mr. Montgomery’s research was Time Magazine cover stories going back to 1914.  When  a specific financial investment was the cover feature, within a year and up to 80% of the time, the trend featured on Time’s cover had reversed and sometimes in a dramatic fashion.

One of the all time great clarion calls for investors was the now infamous BusinessWeek cover story headlined “The Death of Equities” in August, 1979, just prior to the greatest bull market for stocks in history.  According to Montgomery, the indicator has resulted in profits for him and his clients, stating that “It has worked surprisingly well, but people don’t take it seriously.  I actually move money based on it, but I don’t think many other people do”.

Given the research cited above, should we be worried about this week’s magazine cover story by SmartMoney entitled “The Power of Gold”?

Despite the apparently bullish title, after reading “The Power of Gold”, one gets the distinct impression that the article is bearish on the yellow metal.  Investors are portrayed as beset by doubts about owning gold and worried that they will be regarded as “crackpots” if they disclose their predilection for gold ownership.  If the article had been rampantly bullish, it would have quoted gold investors bragging about their investment acumen and predicting further huge price gains.  A bullish article would have also featured photos of small time “joe six pack investors” lined up outside of bullion dealers, desperately clutching handfuls of dollars to convert into gold.  We are not even close to classic signs of a top in the gold market.

SmartMoney notes that “people are buying gold in record amounts, but in many cases they don’t really feel good about it…Others fear that they’ll be targets for robberies or scams, or be branded as crackpots by their friends and neighbors”.  Although SmartMoney mentions the huge growth of the SPDR Gold Shares Trust (GLD), ownership of gold by Americans is still small, representing only one-eighth of all bullion and coins in the world.

SmartMoney also plays down any further upside movement in gold stating that “Of course, a further price surge isn’t inevitable or even, in the eyes of some professional investors, probable.”

The “Magazine Cover Indicator” in this case represents a solid buy signal for gold based on SmartMoney’s bearish article.

Whether one believes in the “power of magazine covers” or not, the fundamental reason for owning gold remains intact – preserving the purchasing power of accumulated wealth.  The value of paper dollars is under ferocious assault by both the government and a financial system that must inflate to survive.

The only government response to the debt crisis has been to add more debt.  The Government budget proposal for fiscal 2012 has the United States borrowing almost half of the entire amount to be spent next year.  The proposed budget requires deficit financing by the United States of an unimaginable $1.65 trillion, or 44% of proposed spending of $3.73 trillion.  Even more disconcerting, a large proportion of the deficit will be funded by the Federal Reserve creating dollars via “quantitative easing”.

Governmental, private and corporate indebtedness has reached levels that make repayment mathematically impossible.  Deflation and debt collapse is not an option being entertained by the government nor is it an option that most Americans would select over inflation.   The nation needs inflation to prevent a level of defaults that would make the Great Depression look like a minor recession.  When this dark reality becomes obvious, gold will have no upside limit.

GLD Gold Holdings Sixth Largest In The World, SLV Holdings Show Small Decline

The SPDR Gold Shares Trust (GLD) and the iShares Silver Trust (SLV) both registered small declines over the past week as the price of gold and silver recovered some ground.

Holdings in the GLD declined by .71 tonnes compared to a decline of 2.43 tonnes in the previous week.  Total holdings have now declined by 4.2% or 54.28 tonnes since the start of the new year.  The GLD currently holds 1,226.44 tonnes or 39.4 million ounces of gold valued at $53.8 billion.

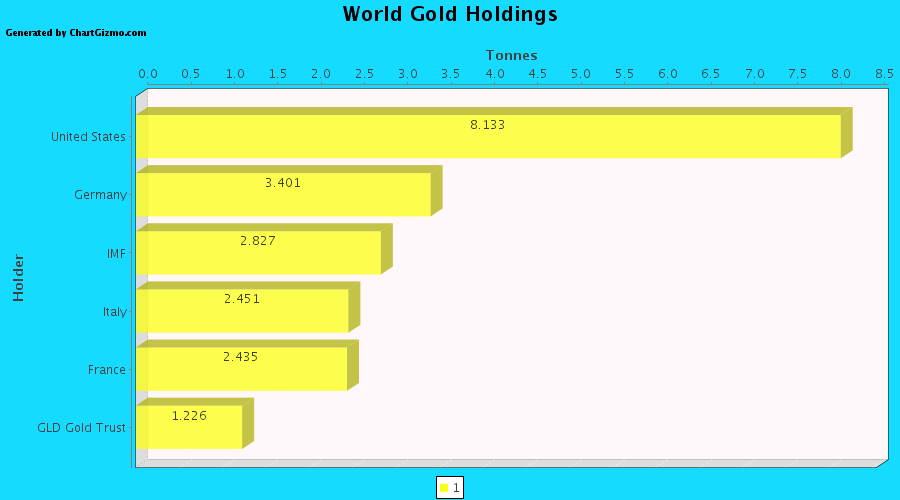
Since launching in November 2004, the Gold Shares Trust has grown very rapidly and is now one of the largest gold holders in the world.  The latest stats show the GLD holding 172.34 more tonnes of gold than China at 1,054.1 tonnes.  From zero at its inception, the GLD has become the world’s sixth largest holder of gold in less than seven years.

World Gold Holdings January 2011 - source: World Gold Council

The GLD came into existence at a very auspicious moment in financial history.  As the worst financial crisis since the Depression unfolded, some of the country’s largest banks failed. The entire financial system seemed to be heading for collapse.  Trillions of dollars in government aid stabilized the banking industry but there were plenty of nervous investors who viewed gold as the last monetary refuge.

Gold does not have the inherent counter-party risk that exists with paper financial assets.  An investor purchasing gold does not have to worry about being bailed out of a gold investment.  Gold and silver have intrinsic value that rapacious governments cannot destroy.

The SPDR Gold Share Trust opened the market to a flood of new buyers who were enticed by a very easy and low cost purchase process. Prior to the GLD, it took a dedicated gold buyer to search for a dealer, check credentials, physically drive to the dealer to pick up a gold purchase, followed by another trip to the safe deposit box.  Commissions on the GLD were minimal compared to the markup at dealers.  The GLD made buying gold simple with low markups and little transaction friction.  Investors, many of whom had never before owned gold, rushed into the GLD which became the fastest growing ETF in history.

The GLD launched in November 2004 when gold was trading at approximately $445 per ounce.  Shortly afterward, gold entered a long term rise concurrent with the geometric increase in GLD gold holdings.  The price of bullion tripled to the current level of $1361.

GLD and SLV Holdings (metric tonnes)

9-Feb-11 Weekly Change YTD Change
GLD 1,226.44 -0.71 -54.28
SLV 10,370.22 -30.38 -551.35

Silver holdings in the iShares Silver Trust (SLV) declined by 30.38 tonnes over the past week compared to a decline in the previous week of 47.10 tonnes.  The year to date decline of 551.35 tonnes represents a 5% drop in silver holdings.    The SLV has declined by a very modest 2.5% from its high of $30.40 at the beginning of the year.  After a huge gain of 67% in the price of silver since late last year, it is normal to see price consolidation before another advance.

GLD and SLV Holdings Decline as Investors Ponder Next Move in Gold and Silver

Both the SPDR Gold Share Trust (GLD) and the iShares Silver Trust (SLV) registered minor declines over the past week.

Holdings in the GLD declined by 2.43 tonnes compared to a decline of 21.85 tonnes in the previous week.  Since the start of the year, total holdings have declined by 4.2% or 53.57 tonnes.  The GLD currently holds 39.5 million ounces of gold.

The holdings of the GLD currently have a market value of $52.7 billion, making the GDL a very significant presence in the gold market.   The market cap of the GLD  far exceeds that of major gold producers such as Goldcorp (GG) at $30 billion, Newmont Mining (NEM) at $27.4 billion and Randgold (GOLD) at $7.1 billion.

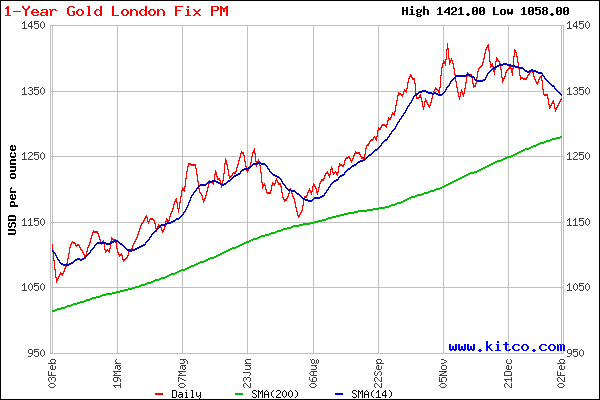
Gold has now made three failed attempts to decisively pierce the $1400 level since last November, forming a triple top in the process.  The failure to breakout to new highs and the large price gain of $250 per ounce since last July has motivated some nervous selling by gold investors.  A look at the one year chart shows that gold’s short term momentum has faltered as prices breached the 14 day moving average.  The next important test will be at the 200 day moving average which gold has traded above for the past two years.

1 YEAR GOLD PRICE - COURTESY KITCO.COM

Despite the recent minor setback in gold prices, the long term trend of gold remains intact technically and fundamentally.

GLD and SLV Holdings (metric tonnes)

2-Feb-2011

Weekly Change

YTD Change

GLD

1,227.15

-2.43

-53.57

SLV

10,400.60

-47.10

-520.97

Silver holdings in the iShares Silver Trust (SLV) declined by 47.1 tonnes over the past week compared to a decline in the previous week of 127.6 tonnes.  The year to date decline of 520.97 tonnes represents a 4.7% drop in silver holdings which trails the 7.8% year to date decline in the price of silver.  The SLV has declined by 9% from its high of $30.40 at the beginning of the year.  After a huge gain of 67% in the price of silver since late last year, it is normal to see price consolidation before another advance.

In this writer’s opinion we have not seen a parabolic blow off type price move, nor have we seen the excited entry of first time silver buyers lured by stories of rising prices.  One of the sentiment gauges that I use involve noting how many of my friends and clients ask or offer unsolicited advice on a specific investment category.  Thus far, not even one person has mentioned silver.  Despite the huge advance in silver prices, public awareness seems minimal, implying long term bullishness.

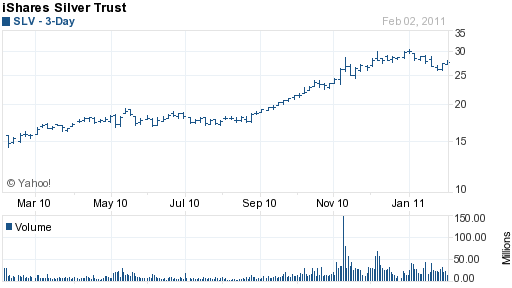
SLV - courtesy yahoo finance

American Gold and Silver Eagle Sales Slower

After generating some mainstream media attention for the record pace of sales, United States Mint bullion coins had a quiet week. According to figures provided by the Mint, only 136,000 ounces of American Silver Eagles and 7,500 ounces of American Gold Eagles were sold in the past week.
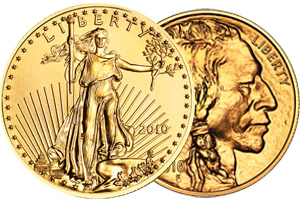
Some have noted the divergence in the sales of bullion coins, which are in record territory for the month, and exchange traded fund (ETF) holdings, which continue to decline. Both have an impact on demand for silver, although the nature the of the buyers for each type of investment are different.

Those purchasing ETF’s are more likely to be professionals or other investors trying to participate in short terms price gains. Since bullion coins are comparatively more difficult to buy and sell and carry larger spreads, these buyers are more likely to be making longer term investments.

US Mint Mint Bullion Coin Program Sales 1/26/2011 (ounces)

Prior Week Year to Date
American Silver Eagle 136,000 4,724,000
American Gold Eagle 7,500 83,000
American Platinum Eagle 0 0
American Gold Buffalo 0 0

The US Mint has now sold 4,724,000 of the one ounce Silver Eagles for the year to date. This includes a remaining quantity of 2010-dated coins, as well as the newly released 2011 Silver Eagles. This is the highest monthly sales total in the history of the program.

American Gold Eagle sales total 83,000 for the year to date. This includes sales of 80,500 one ounce coins, 1,000 one-half ounce coins, 2,000 one-quarter ounce coins, and 15,000 one-tenth ounce coins. The fractional weight coins represent 2010 Gold Eagles, while the one ounce coins included 2010 and 2011-dated coins.

United States Mint Bullion Program Net Margin Remains at 1.9%

Amidst increased demand for physical gold and silver investment products, the United States Mint achieved record revenue from the sale of bullion coins during their 2010 fiscal year. Annual sales totaled $2.86 billion, which yielded net income of $55.2 million for the segment.
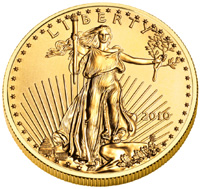
The US Mint produces gold, silver, and platinum bullion coins which are distributed through a network of authorized purchasers. The various programs were authorized by Congress, and the weight, content, and purity of each bullion coin is guaranteed by the U.S. government.

During the fiscal year ending September 30, 2010, the US Mint issued one ounce American Silver Eagles; one ounce, half ounce, quarter ounce, and tenth ounce American Gold Eagles; and one ounce American Gold Buffalo coins. The American Platinum Eagle, which is typically produced in four different bullion weights, was not produced or issued during the year.

Because the purpose of the US Mint’s bullion coin programs is to provide investors with a convenient and cost effective method for investing in precious metals, the programs are managed to a nominal net margin. The bullion coins are sold to authorized purchasers based on the current market price of the metal plus a fixed or percentage mark up to cover minting, distribution, and marketing costs, as well as a net margin targeted at or below 2%. For the past three years, the net margin has remained steady at 1.9%.

The US Mint utilizes a hedging program to avoid the risk related to fluctuations in silver costs. Silver is purchased in large quantities on the open market and then an interest in that silver is sold to a trading partner. The US Mint maintains physical custody and title to the silver. As finished silver bullion coins are sold to authorized purchasers, the trading partner’s interest is repurchased. Transaction fees related to the hedging program were $170,000 for the 2010 fiscal year.

Monthly American Silver Eagle Sales Already in Record Territory

Gold and silver bullion coin sales at the United States Mint are showing exceptional strength. In the past week, authorized purchasers ordered 1,181,000 ounces worth of American Silver Eagles and 32,000 ounces worth of American Gold Eagles.
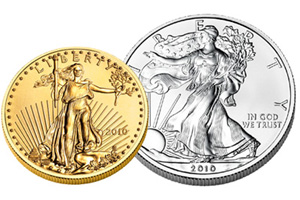
For the Silver Eagle bullion coins, total sales for the month have now risen to 4,588,000 ounces. With the month not even two-third complete, this total already represents a new record high for monthly silver bullion sales. The previous monthly sales record of 4,260,000 ounces was set in November 2010.

On January 3, the US Mint had begun sales of the 2011 Silver Eagle. Strong initial sales are typical when newly dated coins are available, however the strength has persisted, suggesting other factors are at play. Some new investors may making purchases following silver’s stellar performance during 2010. Existing investors may be adding to positions after silver experienced a brief 7% decline.

US Mint Mint Bullion Coin Program Sales 1/19/2011 (ounces)

Prior Week Year to Date
American Silver Eagle 1,181,000 4,588,000
American Gold Eagle 32,000 75,500
American Platinum Eagle 0 0
American Gold Buffalo 0 0

For the year to date, the US Mint has now sold 75,500 ounces worth of Gold Eagle bullion coins. This is comprised of 73,000 one ounce coins, 1,000 one-half ounce coins, 2,000 one-quarter ounce coins, and 15,000 one-tenth ounce coins. Sales of the 2011-dated one ounce coins began on January 3. Sales of the fractional weight coins are remaining 2010-dated coins.

The month to date total for gold bullion sales now approaches the full month sales level for the year ago period, when 85,000 ounces were sold.

US Mint Added New Silver Blank Supplier in 2010

For much of the past three years, the United States Mint has struggled to keep up with the boom in demand for physical precious metals. Although they have been required to mint and issue American Gold and Silver Eagle bullion coins in quantities sufficient to meet public demand, they have often fallen short of this mandate, resorting to sales suspensions and rationing programs.
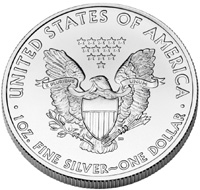
The US Mint’s 2010 Annual Report details some of the specific steps they have taken to increase the quantity of precious metals blanks that they are able to acquire:

  • The US Mint worked with their existing precious metals blanks fabricators to revise delivery schedules to fit production levels. Level loading materials allowed these fabricators to increase productivity and increase output.
  • A new silver blank fabricator began delivering blanks late in the fiscal year. The US Mint also continues to pursue additional suppliers. The reliance on a small number of foreign suppliers was previous noted as the “heart of the problem” in the US Mint’s struggle to manufacture sufficient gold and silver bullion coins.
  • Productivity and efficiency enhancements were implemented at the West Point Mint. Coin encapsulation and packaging processes were automated, employees were trained to handle more areas of responsibility, and coordination with suppliers allowed continuous assaying, inspection, and coin production to take place.

The US Mint cited the results of their efforts during the year:

  • The average monthly supply of all gold and silver blanks from vendors increased from 2.6 million ounces to 4.1 million ounces.
  • Output at the West Point Mint increased from 175 ounces per labor hour to 215 ounces per labor hour.
  • By August 2010, the US Mint had sufficiently expanded supply to remove order limits and fully satisfy demand for silver bullion coins by August 2010.
  • Popular numismatic products like the 2010 Proof Gold Eagles and 2010 Proof Silver Eagles were launched in October and November 2010. These offerings had been canceled in the previous year.

US Mint 2011 American Silver Eagles Selling Quickly

United States Mint bullion coin sales remained robust for the two available options. In the prior week, authorized purchasers ordered 1,322,000 ounces of American Silver Eagles and 25,000 ounces of American Gold Eagles.

For bullion coin programs, the US Mint does not sell directly to the public, but distributes the coins through a network of authorized purchasers. A group of 11 primary distributors can order coins in bulk quantities from the Mint based on the market price of the precious metals, plus a mark up. In turn, they resell the coins to other precious metals dealers, coin dealers, and the public, as well as facilitate a two way market for the bullion coins.

The US Mint began sales of 2011-dated Gold and Silver Eagles on January 3, 2011. Because inventory of 2010-dated coins remained, the Mint required authorized purchasers to order the newer coins on a ratio basis. For every five 2011 Silver Eagles ordered, they were required to take one 2010 Silver Eagle. For Gold Eagles, the AP’s could order four 2011 coins for every one 2010 coin.

At this time, the US Mint only has available one ounce 2011 Gold Eagles, with fractional weight coins planned to be issued later in the year. The American Silver Eagle is only produced in one ounce size. The release dates for the 2011-dated American Platinum Eagle and 24 karat American Gold Buffalo coins have not yet been announced.

So far, the month of January 2011 is shaping up to be a strong one for silver bullion sales. The past week’s orders for 1,322,000 ounces, bring the monthly (and year to date) total to 3,407,000. In January 2010, the US Mint had sold 3,592,000 ounces for the entire month.

US Mint Mint Bullion Coin Program Sales 1/12/2011 (ounces)

Prior Week Year to Date
American Silver Eagle 1,322,000 3,407,000
American Gold Eagle 25,000 43,500
American Platinum Eagle 0 0
American Gold Buffalo 0 0