April 26, 2024

Gold Bullion Coin Sales Steady In May But Plunge From Previous Year

2014-proof-gold-eagle
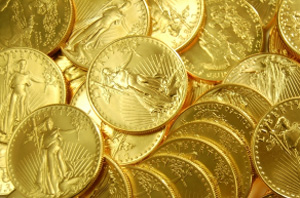
The sale of gold bullion coins by the US Mint remained steady in May compared to the previous month but declined sharply from year ago levels.  There are numerous theories on why gold demand and prices have not recovered in 2014.

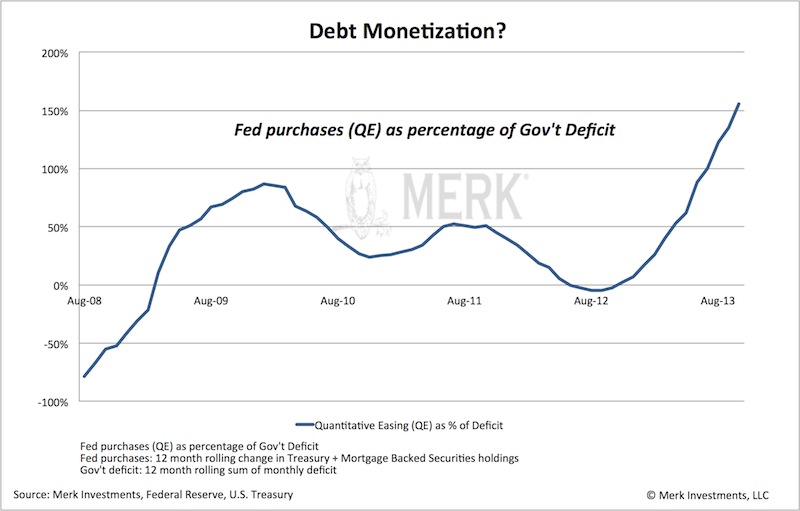
The world seems to have regained confidence in paper money despite the fact that the financial system is now more leveraged than before the financial crisis and the debt problems which caused the financial crisis have simply been papered over with more debt.  Meanwhile, investors in both the stock and bond markets perceive risk to be low and the bulls outnumber the bears by a margin reminiscence of the pre-crash year of 2007.

The only asset class with a preponderance of bears seems to be precious metals.  When the crowd is leaning in one direction, it’s a perfect setup for an eventual price reversal suggesting that long term precious metal investors currently enjoy the opportunity to be greedy when others are fearful.

Despite the constant bearish rants, gold has been relatively stable during 2014.  After starting the year at $1,225 per ounce gold reached a high of $1,385 on March 14 and is currently at $1,244.50 for a gain of 1.6% on the year.

Gold Bullion U.S. Mint Sales Since 2000 as of May 31, 2014
         Year                            Ounces Sold
2000 164,500
2001 325,000
2002 315,000
2003 484,500
2004 536,000
2005 449,000
2006 261,000
2007 198,500
2008 860,500
2009 1,435,000
2010 1,220,500
2011 1,000,000
2012 753,000
2013 856,500
2014 217,500
TOTAL                                                9,076,500

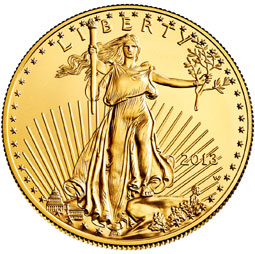
During May the US Mint reported sales of 35,500 ounces of the American Eagle gold bullion coins, down from 38,500 ounces in the previous month.   Gold bullion coin sales plunged from last May when the Mint sold a total of 70,000 ounces.

Since monthly gold bullion coin sales can vary dramatically a look at the average monthly and year to date sales can give a more enlightened view on demand.  As of May 31, 2014 a year to date total of 217,500 ounces of gold bullion coins were sold by the Mint compared to 572,000 ounces in the comparable year ago period, a decline of 61.8%.  Average monthly sales of gold bullion coins during 2014 through May 31 were 43,500 ounces compared to 114,000 ounces last year.

Based on year to date sales, annualized sales of gold bullion coins for 2014 are projected at 522,000 ounces or a decline of 39.1% from the 856,500 ounces sold during 2013.

Why Gold and Silver Could Outperform Every Other Asset Class in 2014

gold-buffaloAfter almost a three year bear market in gold and silver it’s safe to conclude that most of precious metal bears have sold out and moved on.  As gold and silver prices corrected sharply over the past three years, the chorus of bearish sentiment in the mainstream press has become endemic, thus setting the stage for a powerful and unexpected contra rally.

What will set off an explosive rally in precious metals remains to be seen but there are plenty of potential triggers including war in the Ukraine or South Korea as well as the significant financial risk of collapsing asset bubbles engineered by the extremely loose monetary policies of the world’s central banks.

Here’s some of the most interesting recent commentaries on why 2014 could be a big year for gold and silver.

Gold and Silver Are Almost Ready to Rally

While every journey does begin with the first step, we need more evidence than a minor rally day to declare that a bull market has arrived. For the SPDR Gold Trust ETF (ticker: GLD), the April 24 rally was not very remarkable other than the fact that the day started with a loss and ended with a gain.
Now let’s talk about what it was rather than what it wasn’t.

For starters, it was an encouraging hold of short-term support from March. And the failure to set a lower low for the current two-month decline also falls on the bullish side of the ledger.

But more importantly, it was a suggestion that prices will not travel to the bottom of a giant year-long trading range again. In other words, any further strength now would tell us that investors are ready to buy. They will not wait for “better” prices to buy at the bottom of the range, and that means a shift in sentiment for the better.

Finally, the gold market has a “golden cross” in place. This is a condition where the 50-day average crosses above the 200-day average, and while it is really a stock market indicator, the macro look and feel are the same to me. After a long decline and period of sideways movement, this is the market’s first sign it has had enough healing. As long as the sideways trading range is not so long that the averages are completely flat, I think the signal is worthy of respect.

We can also we look at rising momentum indicators as bullish. Weekly charts show the relative strength index (RSI) setting higher lows between June and December even as prices set equal lows. This means the bears were tired as 2013 ended, and the fact that this indicator continued to rise this year suggests the bulls are starting to wake up.

Silver also had a bullish short-term reversal last week, but it has a lot more technical damage to repair. It does not have a moving average golden cross in place, and has already fallen rather close to its previous major lows from last year. Generally, that’s not a good sign, but in this case it’s not so clear cut.

When we look at the bigger picture using the iShares Silver Trust (SLV), we will see something really interesting. Recall 2010, when both gold and silver shot higher, but silver moved at a much faster pace than gold did. On the charts, we can see the technical launching point and breakout in August of that year.

As we see in many markets that appear to be bubbles, with such steep gains and ever-accelerating trends, the “bubble” part of the rally is often completely erased before conditions stabilize and then improve. Silver’s rally is now erased, which means the market is likely washed out and left for dead. Even so, there is a bullish RSI condition in place for the white metal, just as there is for gold.

 The Long Goodbye – by Andy Xie

The recent tumbling of Internet and biotech stocks may indicate that the speculation in such stocks has peaked. But, unlike in 2000, the bursting will occur in slow motion. The financial market structure has radically changed in the past 15 years. Too many money managers have a one-sided incentive to long such stocks.

The global financial system has experienced one bubble after another because major central banks have kept monetary policy loose. Prolonged loose monetary policy has made the financial system extraordinary large relative to the real economy. This change forces central banks to respond to negative shocks, like the bursting of a bubble, from the financial system. Such responses make the financial system even bigger. This vicious cycle explains why speculation has become such a powerful force.

A bubble cannot expand forever, even in an environment of loose monetary policy. The balance between fear and greed can tip over when the price of an asset becomes too high, like Internet stocks now relative to the average. The subsequent deflating bubble, in a continuing environment of loose money, just shifts air into other assets.

The talk of monetary tightening in the United States or China will not be followed up with strong enough actions. Real interest rates will remain negative until another crisis, like high inflation or hyperinflation or political crisis, force the hand.

Gold is the safe asset in today’s environment. As paper currencies lose credibility, the demand for gold will surge. The alternative digital currencies are fool’s good, really scams to take advantage of people’s fear over the potential collapse of paper currencies.

Two changes in the past 15 years have made bubble formation a constant feature of financial markets around the world. The inefficiencies in capital allocation and income redistribution to finance are the main reason for today’s sluggish global economy.

At the macro level, globalization has made inflation slow to emerge, as multinational companies can shift production around the world in response to cost pressure. This force has given central banks more room in increasing money supply without facing the inflation consequences for years. Hence, central banks around the world have become more active in response to economic fluctuations. The consequence is a rising ratio of money supply or credit to GDP. By definition, this means a bigger and bigger financial system, which needs more and more income to survive.

The real economy, as the previous analysis indicates, can only bear so much. Bubble formation has become central to supporting a bloated financial system. A large and bubbly financial system is unstable. Its periodic collapse brings down the economy, which triggers more monetary stimulus. Hence, constant monetary stimulus and an ever-expanding and bubbly financial system have formed a vicious cycle.

What’s Up With Gold and Silver? (Market Anthropology)

Anecdotally, we are seeing and hearing from those anxiously long the precious metals sector and contentiously short. With gold and silver down sharply in the early morning session – then reversing violently higher, the emotional spectrum in the market is likely diverged at or near another extreme. Over the past 10 months, both bulls and bears alike have been waiting for the next leg to commence. Instead, the market has played the jester – traversing a narrowing range and taking turns at frustrating both sides.

When will the argument resolve itself ?

Although it’s felt like a standing room only performance of Waiting For Godot, we expect long-term yields still hold the key to the next chapter for precious metals and the broader market story. We continue to view the move in 10-year yields as historically stretched to a relative extreme (see chart), a notion apparently lost on many participants as the Fed tapers their way to the end of QE and through an esoteric Fed cycle.
Just this week we saw that a Bloomberg survey of 67 economists unanimously expected 10-year yields to rise over the next six months (see Here). From a contrarian point-of-view, this should wake up participants that underlying sentiment is dangerously listing towards one side and the downstream and kinetic effects could be severe in many markets. The ratio chart below depicts the relationship between gold and 10-year yields, which as we noted last December had also reached a historic extreme. If and when long-term yields breakdown, we suspect a much stronger tailwind to develop behind precious metals.

As the Nikkei was breaking down at the start of the 1990’s, risk appetites changed and developed a palette for the Nasdaq. After the Nasdaq cracked going through the Millennium, investors turned to precious metals. The cycle can also come full circle, as we believe the performance and seasonal presentments of the current risk du jour describes. As the biotech index now turns down just past its zenith, we expect silver and the precious metals sector to begin making their way materially out of the trough they have trended towards over the past three years.

The Reformed Broker

Jeff Gundlach looks at the gold market. He’s not a big gold guy, but says that if you’ve held it this long (and through this much pain), “for god’s sake don’t sell it here!” He thinks the holders who remain are the quintessential, proverbial “strong hands” and that gold miner equities are completely underpriced for the potential of the metal running back up again. He’s more positive on commodities now in general, given how uninterested the investment community seems to be.

http://www.thereformedbroker.com/wp-content/uploads/2014/04/25.jpg

Silver Bullion Coin Sales Soar In March, Gold Coin Sales Slump – Are Coin Buyers Stupid?

2014-proof-gold-eagleThe March sales report of American Eagle bullion coins by the U.S. Mint showed a large drop in gold bullion coins while sales of the ever popular silver bullion coins soared.

Sales of the American Eagle gold bullion coins in March totaled 21,000 ounces, down by 32% from February’s total of 31,000 ounces and down by a dramatic 66% from March 2013 when 62,000 coins were sold.  Year to date sales through March of 143,500 ounces of the American Eagle gold bullion coins plunged 51% from the comparable period last year when the U.S. Mint sold 292,500 ounces.

The decline in sales of gold bullion is in marked contrast to last year when sales boomed despite an almost 30% decline in gold prices, the worst performance since 1981.  Investors in physical gold across the globe viewed the decline in gold as a buying opportunity.  Sales of gold coins in 2013 by The Perth Mint soared over 40% while sales by the Royal Canadian Mint surged over 80%.  Sales of American Eagle gold coins by the U.S. Mint in 2013 jumped by 6.3% to 800,500 ounces.

Are Gold and Silver Bullion Coin Buyers Stupid?

While gold rebounded in 2014 from a low of $1221 to as high as $1385 before pulling back to a current price of $1284, perhaps buyers are waiting to see if the rally in gold will continue or if gold will decline again in 2014 as predicted by the likes of Goldman Sachs.  Long term it does not matter since the entire concept of fiat money has never ended well over the long term.  According to Bloomberg, the “long term” may be upon us sooner than many think.

Sound money and sound banking policies of governments have always been suspect but since the financial crisis of 2008, the entire concept of sound money has been utterly abandoned on a global basis as central banks printed trillions of dollars to support a financial system that imploded due to over indebtedness.  “Curing” the problem of too much debt with more debt and printed fiat money has in many people’s mind saved the world financial system, a tenuous theory at best.

1881-CC-Morgan-Dollar

According to the Bank for International Settlements, the amount of global debt (primarily government borrowings) has soared by a staggering 40 percent to $100 trillion since 2008 with the U.S. in the lead increasing the national debt to $12 trillion from $4.5 trillion at 2007 year end.  Fast forward to the next recession which could have its roots in a variety of events from the collapse of Japan’s epic empire of debt to the start of a serious military conflict over Ukraine driven by the warmongering military industrial complex in the U.S.  Another serious economic crisis, whatever its genesis, will result in money printing on an unimaginable scale as central banks do the only thing they can do which is to print more money.

Buyers of physical bullion are long term investors who understand what’s happening and are buying the only true money that cannot be debased by government profligacy and rapacious tax policies.  In the meantime, fluctuations in the price of gold caused by speculators such as hedge fund operators who can push around the price of physical gold without ever owning it through the use of futures contracts or options merely provide fantastic buying opportunities when they slam down gold prices.  Long term gold and silver are the only protection to preserve wealth against governments determined to debase fiat money to keep the highly leveraged financial system from imploding.  Current gold buyers will at some point will be holding an asset that soars in value as confidence in central banks completely evaporates as the value of paper money collapses.

American Eagle silver bullion coins meanwhile continue to soar and are a much more affordable option for many buyers compared to gold.  March sales of American Eagle silver bullion coins soared in March to 5,354,000 ounces, up by 43% from the prior month’s sales of 3,750,000 ounces and up by 60% from the March 2013 sales of 3,356,500 ounces.   Sales of silver bullion coins also increased dramatically in 2013 to a new record high of almost 42 ounces, up from almost 34 million ounces in 2012.  Based on annualizing the year to date sales of silver bullion coins, 2014 could turn out to be another block buster year with sales approaching another record of over 55 million ounces compared to 42 million ounces in 2013.

Buyers of physical gold and silver are long term investors who are intelligently protecting their wealth against governments hell bent on inflation and debasement of the currency in order to keep the house of debt cards from collapsing.  Accordingly, short term declines in the sale of gold bullion coins is totally irrelevant.

Gold’s Next Big Move Is Up – Every Bull Market Has Pullbacks

gold generalBy: GE Christenson

Gold peaked in August of 2011 and fell erratically into December 2013.

Was that the end of the collapse, or is there more downside coming in gold prices?

Bearish Scenario: Listen to the banks who are forecasting weak prices in 2014 and thereafter. “Nothing to see here folks, the dollar has weakened drastically since 1971, gold sells for 30 times its 1971 price, but it’s all good. Just move on and pretend… Gold will drop below $1000 before you can say 2016 elections…”

I’m not a fan of:

The bearish gold scenario when decades of Federal Reserve “printing” and US government budget deficits have all but guaranteed continued destruction of the purchasing power of the dollar.

Belief that even though dollar debasement practices have accelerated since the 2008 crash, gold prices will fall because bankers say so.

Propaganda that gold is useless and that unbacked debt based fiat currencies are solid and stable.

Large High Frequency Trading companies that short the gold market, loudly proclaim that gold prices will fall, dump a huge number of paper contracts on the Comex, quietly cover their shorts after the gold price crash, book huge profits, and then reverse the process as they push prices up. These traders are in the business of making profits so none of this is surprising.

Instead of listening to self-serving banker opinions, let’s examine the data. The following chart shows monthly prices for gold since 2000. Note that highs and lows as listed in the monthly data are slightly different from actual hourly highs and lows. For this analysis over 14 years, the differences are immaterial.

This table shows the price and approximate number of years.

table3102014

Summary: The price of gold bottomed in 2001, rallied for 3.0 years, fell for 1.1 years, rallied for 2.8 years, fell for 0.6 years, rallied for 2.8 years, and fell for 2.4 years. Lows were about 4 years apart, highs were about 3.5 years apart, and the rallies lasted, on average, about 3 years.

Gold in December of 2013 had dropped to the lower logarithmic
trend line after falling for 2.4 years. The patterns suggest that the next move should be a rally that lasts approximately 3 years to new highs near the top of the trend channel well above $3,500.

roosevelt

But there is more: (If you distrust Technical Analysis, skip this section.)

  • Gold prices made a double-bottom in June and December 2013 thereby indicating a successful test of the lows formed in June.
  • The MACD – a technical indicator (first chart) which tracks the difference between two moving averages – registered a very low reading in December 2013. Further, the moving averages in the indicator have turned up. This is strongly supportive of the analysis that December marked a major low in gold prices.
  • The TDI-Trade-Signal line – another technical indicator (first chart) – registered its lowest reading in 15 years at the June 2013 low and has also turned up. This is another strong indication that gold bottomed in December.
  • The RSI – Relative Strength Index – as shown on the second chart was at a 15 year low at the June 2013 gold price lows. It has turned upward.
  • The disparity index, which is simply the deviation between the monthly prices and the 12 month simple moving average (second chart), was at a 30 year low and flashing a buy signal after the June 2013 gold price lows.

For those who have no faith in technical analysis:

Consider this GEM – Gold Equilibrium Model (thanks to Nick Migliaccio for the name). I summarized the model in this short article. The model is based on three variables and calculates the equilibrium gold price with no reference to oscillators or technical indicators. The GEM model projects a “fair” or equilibrium price for gold in March 2014 of approximately $1,580. Gold prices, based on this long-term model, are currently low and are likely to move much higher over the next several years. This long-term model produced an excellent statistical correlation with the smoothed price of gold over the 42 years from 1971 – 2013.

Conclusions

  • The GEM indicates that, over the next several years, gold prices are headed much higher.
  • The chart of gold prices since the year 2000 (log scale) shows a “megaphone pattern” of higher lows and higher highs. Currently the gold price is near the bottom of the exponentially up-trending pattern.
  • Technical oscillators indicate important bottoms in June and December – at levels not seen in more than a decade.
  • The disparity index shows that gold prices in June were well below the 12 month moving average. Similarly daily and weekly prices were well below their moving averages. Prices tend to regress to the mean – another indication that prices are likely to rise from the deep lows in June and December.
  • Short term prices could rise or fall a little from here – I’m offering no opinion – but gold prices should be much higher in 2015 and 2016.
  • Gold is for savings and investing, not trading. Dollars buy groceries while gold buys safety, insurance, and peace of mind.
  • As Darryl Robert Schoon always says, “Buy gold, buy silver, have faith.” It is good advice.

GE Christenson, aka Deviant Investor

Monetizing Government Debt – Bernanke Says No, Common Sense Says Yes

2013-w-gold-eagleBy: Axel Merk

Fed Chair Bernanke vehemently denies Fed “monetizes the debt,” but our research shows the Fed may be increasingly doing so. We explain why and what the implications may be for the dollar, gold and currencies.

What is debt monetization? A central bank is said to monetize a government’s debt if it helps to finance its deficit. The buying of Treasuries by the Federal Reserve is a clear indication that the Fed is doing just that, except that Bernanke argues the motivation behind Treasury purchases is to help the economy, not the government.

The no-taper decision increased the Fed’s monetization of US debt. Gold may be more than insurance. Brace yourself for an escalation of Currency Wars.

To what extent does the Fed monetize the debt? The below chart shows that since the onset of the fall of 2008, the Fed has purchased enough Treasuries and Mortgage-Backed Securities (MBS), together, “quantitative easing” or (QE) to finance a substantial part of the government deficit. Indeed, by deciding not to “taper” off its purchases, the Fed is engaging in sufficient QE to purchase all debt issued and then some.

Shouldn’t one exclude MBS purchases in analyzing debt monetization? Buying MBS may provide the appearance that the Fed is not monetizing the debt when in fact it is. Don’t take our word for it, but the market’s: in a recent presentation to the CFA society in Melbourne, Merk Senior Economic Adviser and former St. Louis Fed President Bill Poole points out that the spread between 30-year fixed-rate mortgages and 10-year U.S. Treasury bonds have been virtually unchanged as a result of MBS purchases; from 1976 to 2006 the average spread was 1.74%. From May 2011 to April 2012 it averaged 1.76%. As such, the direct impact of QE on spreads has been extremely limited. If it sounds surprising, consider that investors have an array of choices that are highly similar: aside from currency risk, how different are German Treasuries versus U.S. Treasuries? Highly rated U.S. corporate issues versus U.S. Treasuries? They all have distinct risk profiles, but there’s a good reason why absent of issuer-specific news, these securities tend to trade in tandem. As such, the Fed is really just sipping with a straw from the ocean: setting rates may be more a result of communication (the “credibility of the Fed”) rather than the actual purchases.

gold-bullionIf rates are set by words rather than action, doesn’t that prove the point the Fed is not monetizing the debt? We agree that talk is cheap. But talk doesn’t always move the market; as confidence in the Fed’s ability to control rates erodes, policy becomes ever more expensive: cutting rates, emergency rate cuts, Treasury purchases, Operation Twist, and moving to an explicit employment target are all escalations of a policy to “convince” the market to keep rates low. And along the way, the Fed has to spend more money. Ask the Fed, and they’ll tell you their operations are profitable. Clearly, as the Fed creates money out of thin air to buy income-generating fixed income securities, the more the Fed “prints”, the more profitable it is. Except that there’s no free lunch and pigs still can’t fly. By all means, no central bank in their right mind would start out with a policy to monetize debt. But as the chart above shows, the Fed now spends over 150% of government deficit to hold rates down, suggesting that its firing power is eroding. If and when we come to the stage that the Fed were to explicitly monetize the debt, it may need to buy a high multiple of what it currently does and might still fail to keep rates low. It’s a confidence game.

What happened when the Fed decided not to “taper” its bond purchase program? As the chart above shows, something went wrong, very wrong. As tax revenue has picked up throughout the year, government deficits have come down. As such, reducing QE would have been warranted. By choosing not to “taper,” one can argue that QE has actually increased, as the Fed is buying above and beyond newly issued debt. Note the Fed will push back yet again, arguing it cannot buy debt directly from the government only in the secondary market. But that may well be semantics. As a large bond manager has pointed out: in the absence of QE, we might have to sell debt to one another, rather than to the Fed.

rooseveltWhere’s debt monetization heading? The way we see the dynamics playing out, this confidence game will go on for some time, yet we may increasingly be seeing cracks. Lower government deficits may be a short-term phenomenon as over the long-term the cost of entitlements and interest payments may rise substantially, highlighting that deficits may not be sustainable. In 10 years from now, the Congressional Budget Office (CBO) estimates the U.S. government may be paying $600 billion more a year in interest expense alone; indeed, if the average cost of borrowing went back up to the average cost of borrowing since the 1970s, the government may need to pay $1 trillion more per year in interest expense alone. To us, this suggests the biggest threat we are facing may be economic growth. That’s because the bond market has been most sensitive to good economic data; yet, should the bond market sell off (increasing the cost of borrowing), the cost of financing U.S. government deficits may escalate. We already have a Fed that has indicated interest rates will stay low for an extended period. In some ways, the Fed has all but guaranteed that it will be slow in raising rates. We interpret that as the Fed being slow to rising inflationary pressures that are likely to increase should the economy ever pick up again.

This is all too abstract – how will this play out? If you think this is abstract, think Japan. Let the Japanese be successful with their policies, let them achieve sustained economic growth. What do you think will happen to Japanese Government Bonds (JGBs)? JGBs might plunge, making it difficult, if not impossible, to finance Japan’s massive government debt burden. Few observers doubt that the Bank of Japan (BoJ) may step in to help finance government deficits. That’s debt monetization. We think the valve for Japan will be the yen that won’t survive this. When we discuss this with investors, most agree that this is a real risk for Japan. But don’t kid yourself: even if we may be able to kick the can down the road for longer in the U.S., we think it may be hazardous to one’s wealth to ignore the risks posed to the dollar due to a toxic mix of monetary and fiscal policy.

paper moneyHow do I prepare as an investor? The way we look at the world is in terms of scenarios: if a scenario is sufficiently likely, we think investors should take it into account in their portfolio allocation; professional investors may even have it as their fiduciary duty. To us, the short answer is that there is no such thing anymore as a risk free investment and investors may want to take a diversified approach to something as mundane as cash. Investors may want to consider throwing out the risk free component in their asset allocation. That’s because the purchasing power of the U.S. dollar may be at risk.

Is gold the answer? Gold has performed rather poorly this year and is increasingly being written off. Yet, those writing off gold should think twice about where they see the economy and the Fed heading. If one believes we will return to a “normal” environment and we’ll live happily ever after, maybe those gold naysayers have a point. But keep in mind that incoming Fed Chair Janet Yellen stated during her confirmation hearings that we shall return to a normal Fed policy once the economy is back to normal. To us, that’s an oxymoron: we cannot return to a normal economy when the Fed prevents risk being priced by market forces. To us, gold is more than “insurance” to adverse scenarios as some say, as we find it difficult to see how we’ll be facing positive real interest rates for an extended period over the coming decade.

Is a basket of currencies the answer? The Chinese government diversifies its reserves to a basket of currencies, clearly adding currency risk to their portfolio. Conversely, U.S. investors may want to consider diversifying to a basket of currencies if they believe we ultimately have the better “printing press” than the rest of the world?

But isn’t it more complex than that? In some ways, yes. Governments won’t give up without a fight. We believe policy makers want to do the right thing, except that the road to hell might be paved with good intentions. Just consider if Japan truly has a problem: Japan is no Cyprus, meaning that shockwaves of a Japanese government in turmoil might be felt around the world. Aside from cash not being “safe,” political stability may also continue to erode throughout the world, as citizens worldwide dissatisfied that their wages don’t keep up with an increasing cost of living elect ever more populist politicians. The only good news we can see is that our policy makers may be predictable and an investment strategy based on staying a step ahead of policy makers might be worth considering. Think currency wars, and think diversifying on a more pro-active basis. We are not suggesting investors become day traders, but we think the currency markets may be well suited to take positions on how one believes these dynamics may play out.

Axel Merk
Axel Merk is President and Chief Investment Officer, Merk Investments,
Manager of the Merk Funds.

U.S. Mint Runs Out of Silver Bullion Coins – Gold and Silver Coin Sales Hit Record Levels in November

rooseveltLong term proponents of sound money cannot seem to get enough of U.S. Mint produced gold and silver bullion coins.  Ever since the financial crash of 2008 many Americans remain profoundly skeptical of the paper dollar system backed by the “full faith and credit” of a nation that has borrowed itself into poverty and promised more in social benefits than the economy can possible provide.

From 2000 to 2007 sales of the U.S. Mint American Eagle gold bullion coins averaged about 341,000 ounces annually.  After the crash of 2008 exposed the risk of paper assets, sales of the gold bullion coins have averaged about 1,011,300 ounces annually from 2008 to 2013.

Year to date sales of the American Eagle gold bullion coins as of the end of November totaled 800,500 ounces, surpassing total 2012 sales of 753,000 ounces.  For November the U.S. Mint sold 48,000 ounces of gold bullion coins, slightly below the sales figures of 48,500 for the previous month.  Since 2000 investors have stashed away 8.8 million gold bullion coins currently worth about $11 billion.

Gold has retained its value throughout human history and strong demand for gold over the ages has resulted in the depletion of most gold deposits on the planet.  As noted in a previous post, about 75% of all gold deposits have already been mined which forebodes a future gold shortage.

american-silver-eagleAs noted in a previous post, sales of the U.S. Mint American Eagle silver bullion coins hit record annual sales volume in  November.  The U.S. Mint sold a total of 41,475,000 silver bullion coins as of November 30th, surpassing the previous record sales year of 39,868,500 coins in 2011.

Sales of the American Eagle silver bullion coins for November came in at 2,300,000, a decline of 787,000 coins compared to 3,087,000 in the previous month.  The lower sales figures for November do not reflect a drop in demand for silver bullion coins but rather the opposite due to the fact that the U.S. Mint has run out of coins due to unprecedented demand.

This same shortage situation existed last year when the Mint ran out of silver bullion coins in mid December  with orders for the new 2013 silver bullion coins not being accepted until January 7, 2013.  This situation resulted in a three week period during which the American Eagle silver bullion coins were simply not available.

The period of time during which silver bullion coins will be unavailable from December 2013 to January 2014 will be even longer than last year.

peace dollar

According to coinupdate.com silver bullion coins will not be available for investor purchase for over a month and supplies will be rationed when available.

The United States Mint recently provided authorized purchasers with information on year end ordering procedures and the availability of 2014-dated releases for the American Eagle and American Buffalo bullion programs. Based on the details provided, it seems that the American Silver Eagle bullion coins will experience roughly one month of unavailability between the final allocation of 2013-dated coins and the release of the first 2014-dated coins.

The situation for American Silver Eagle bullion coins differs from the prior year. Authorized purchasers will be offered the last weekly allocation of 2013-dated coins on Monday, December 9, 2013. With demand continuing to run ahead of the available supplies, the allocation will likely be quickly depleted.

The 2014-dated Silver Eagle bullion coins will not be available to order until Monday, January 13, 2014. The initial release will be subject to the US Mint’s allocation program, which rations supplies amongst the authorized purchasers.

With such a severe shortage of silver bullion coins, expect buyer premiums to increase significantly over the next two months.

Why Gold Stocks Are Not a Substitute for Gold

gold & barAn investor who was correctly bullish on gold in late 2004 had three basic investment options to capitalize on an increase in the price of gold:

  1. Invest in physical gold
  2. Invest in a proxy for physical gold such as the SPDR Gold Shares (GLD)
  3. Invest in gold mining companies

The investor who picked option three does not have a lot to be cheerful about even after gold’s historic increase in value since 2004.  Why did gold stocks do so poorly in spite of a 500% increase in the price of gold bullion?  Merk Investment takes a look at gold versus gold stocks and explains why Gold Stocks Ain’t Gold.

A frequent mistake made by investors
is to invest in gold mining companies
(both juniors and majors) as a substitute
for gold. There are a couple of reasons
why this may be a mistake. Firstly, gold
mining company’s stock price does not
precisely track the price of gold. That’s
because lots of other factors influence the
share price of a company: management,
cost pressures, mining diversification,
stage of the mining process, to name just
a few.

This problem is generally more
acute for juniors than majors, because
juniors often have yet to “strike gold,”
therefore the stock price often trades more
like an option. Moreover, many mining
companies don’t only mine gold, many
also mine silver, palladium, diamonds
etc.

This dynamic also holds for baskets
of mining companies – baskets of miners
have significantly underperformed the
price of gold over recent years.  Some investors believe gold mining stocks may provide more attractive
investment exposure to gold than gold
itself. The investment thesis is as follows:
gold mining companies are able to take
advantage of an increase in the price
of gold through enhanced operational
leverage; as the gold price goes up, mining companies’ margins widen, ultimately increasing the bottom line.

However, this theory is predicated on fixed costs staying
relatively constant. Unfortunately, recent
performance does not support this
investment idea. Indeed, gold mining
stocks, on aggregate, have significantly
underperformed the price of gold.

The reality is that mining is a highly energy-
intensive undertaking, and therefore
many of the costs are closely linked to
energy prices, such as oil, which has also
experienced significant increases in price.
As a result, many mining companies
have not produced the anticipated
high level of profits. Additionally,
governments may demand higher taxes
and employees higher wages from mining
companies should profitability increase,
further limiting the upside potential for
shareholders.

The results for each investment option are shown below for physical gold, the GLD and the Vanguard Precious Metal and Mining Fund (VGPMX) used as a stock proxy.  Note that despite the horrible long term performance, a nimble investor in the VGPMX could have reaped  considerable gains by selling in early 2008 and then getting back into gold stocks after the crash of 2008.

PHYSICAL GOLD

PHYSICAL GOLD

SPDR GOLD SHARES TRUST (GLD)

GLD

VANGUARD PRECIOUS METALS FUND (VGPMX)

VGPMX

Gold and Silver Are in Long Term Uptrends

mount-rushmore1By: GE Christenson

The BIG Perspective: Examine the following “Point & Figure” chart from Ron Rosen. This type of chart plots price on the “y” axis while the “x” axis shows time but without uniform distance between years. The long term trend has been up since 1970 and 2001, while the intermediate trend has been down for the past 26 months.

Gold and silver will outlast hope, change, paper money, treasury debt, and political promises. Most people do not and will not understand why!

The following are logarithmic charts of the official U.S. national debt, gold, silver, and crude oil for the past three to four decades.

Clearly the long term trends are up. Why?

  • A debt based paper currency system must expand to survive!
  • The Fed needs an increasing money supply and more debt.
  • Congress and the administration aggressively spend money, borrow money, and increase the national debt. It will take a real crisis to change this – much worse than a phony debt ceiling crisis.
  • The financial industry wants to churn more paper assets, debt, derivatives, and volatility to increase their profits.

The inevitable conclusion is that, over the long term, money supply, debt, and prices will increase until there is a systemic reset or crash. What will endure throughout the inevitable inflation, deflation, and crash? Gold and silver will endure. Paper assets are only as good as the collateral backing them, and many of those assets could vaporize in a systemic reset. Gold and silver will survive and maintain their value, while the dollar and Treasury Debt may lose a good portion of their value and purchasing power.

maple-leaf-442x450

Hope & Change

Hope is not a good basis for an investment plan. Hope is not a viable foundation for a political philosophy or for the actions of a government. Hope will not pay the bills, reduce the debt, or return sanity to an out-of-control spending process.

Ask yourself how well these are working:

  • We spent the rent money on lottery tickets and booze. We hope something good happens soon.
  • We spent a few $Trillion on useless wars in the middle-east. We hope it helped.
  • We spent $17,000,000,000,000 more than our revenue. We hope it is not a problem.
  • We sold or “leased” much of our accumulated gold and sent it to China. We hope nobody noticed and that it will not matter.
  • We hope we don’t have another stock market or bond market crash.
  • We hope to increase taxes and reduce benefits while increasing consumer prices and we hope to keep the people happy and voting for the incumbents. (This is also change.)
  • We hope to actually pass a budget real soon. (Congress has not passed a budget in the past five years. Did anyone notice or care?)
  • We hope to reduce the deficit real soon.
  • We hope the Federal Reserve and the politicians will make it all better.
  • We hope that hope and change will begin to work real soon.

As for “CHANGE” – it can be positive or negative. Not all change is good. We “HOPED” for better government and we received Obamacare. Was that a positive change?

Gee, we hope that the 10 Million or so people whose insurance plans will be cancelled and who will be forced to purchase new health insurance policies at much higher rates are okay with the change, increased deductibles and the increased costs. We hope they don’t get upset or angry or think someone lied to them.

Liberty-Eagle
Gold and Silver!

Dr. Phil says that the best predictor of future behavior is relevant past behavior. Using that thought it seems clear that:

  • The official national debt will continue to exponentially increase like it has for more than four decades.
  • The dollar will continue to decline in purchasing power like it has for the past 100 years.
  • Gold and silver will continue to (erratically) increase in price like they have for the past 40 years.
  • Gold and silver will hold their value and purchasing power like they have for 5,000 years.
  • Government deficit spending and borrowing will continue.
  • There will be another budget crisis, and another, and another.
  • Politicians will talk, make promises, and become much wealthier while the middle and lower classes find their expenses increasing far more rapidly than their incomes. We will re-elect those politicians.
  • Hope and change will continue to produce what they have so far – nothing but more debt.

Gold and silver will outlast hope, change, paper money, treasury debt, and political promises. Most people do not and will not understand why!
So, place your bets!

  • Paper currency or gold and silver.
  • Debt based paper assets or real money – gold and silver.
  • Political promises or something of lasting value.
  • Futures contracts on a corrupt exchange or land.
  • Credit card debt or stacked silver in a safe.
  • Social security income in a decade or gold in hand now.
  • Obamacare or good health.
  • Nutritionally empty fast food or healthy nutritious food.
  • Artificial and phony or real and valuable.
  • Reality television or the Holy Bible.

Most people will stick with what they know – paper currency, debt based paper assets, political promises, hope and change, and reality television. The choice is yours, but you will have a better financial future and more peace of mind if you invest in something real and valuable.

GE Christenson
aka Deviant Investor

U.S. Mint Gold Coin Sales Soar 273% in October

gold-bullionAlthough sales totals vary from month to month, annual sales of the U.S. Mint American Eagle gold bullion coins are running at triple the levels prior to 2008 when the wheels came off the world financial system and central banks began an orgy of money printing.

From 2000 to 2007 the average yearly purchases of the American Eagle gold bullion coins totaled 341,500 ounces per year.  From 2008 to 2013 annual purchases of the gold coins have spiked by 300% to an average annual rate of 1,011,000 ounces.

After lackluster sales of gold coins in the slow months of August and September sales soared in October as investor demand for physical gold surged.  Total sales of the American Eagle gold coins for October 2013 came in at 48,500 ounces, an increase of 273% over the September total of 13,000 ounces.   October sales of gold bullion coins for the comparable prior year period totaled 59,000.

The U.S. Mint American Eagle gold bullion coins remain the premier method of building wealth through periodic purchases.  The American public can’t seem to get enough of the bullion coins and the desperate actions of global central banks to keep the financial system afloat with a deluge of paper money can only cause more financial anxiety and more gold purchases going forward.

2013 sales through October 2013

With two months still remaining in 2013, investors have already purchased almost the same amount of gold bullion coins that were sold for all of 2012.   Year to date sales of the American Eagle through October total 752,500 ounces compared to 753,000 ounces for all of 2012.


Gold Bullion U.S. Mint Sales Since 2000
         Year                           Total Ounces
2000 164,500
2001 325,000
2002 315,000
2003 484,500
2004 536,000
2005 449,000
2006 261,000
2007 198,500
2008 860,500
2009 1,435,000
2010 1,220,500
2011 1,000,000
2012 753,000
2013 752,500
 TOTAL                               8,755,000
(above 2013 totals through October 2013)

The American Eagle gold bullion coins cannot be purchased by individuals directly from the U.S Mint.  The coins are sold only to the Mint’s network of authorized purchasers who buy the coins in bulk based on the market value of gold and a markup by the U.S. Mint.  The authorized purchasers sell the gold coins to coin dealers, other bullion dealers and the public.  The Mint’s rationale for using authorized purchasers is that this method makes the coins widely available to the public with reasonable transaction costs.

gold-buffalo

The public is allowed to purchases numismatic versions of gold coins directly from the U.S. Mint.   One of the most popular numismatic gold coins is the American Buffalo, available in both one ounce gold reverse proof and one ounce gold proof.

US Mint Gold and Silver Bullion Coin Sales Decline in September

silver, gold
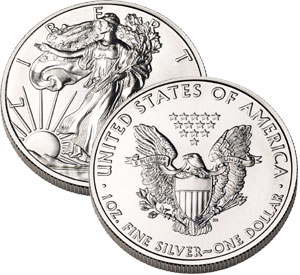
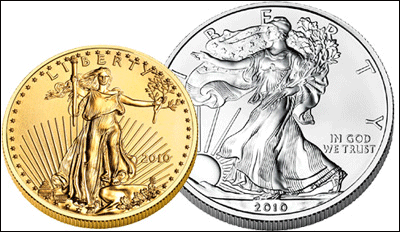
Demand for American Eagle gold and silver bullion coins remained sluggish in September according to the latest figures from the U.S. Mint.

Sales of the American Eagle gold bullion coin totaled 13,000 ounces in September, off a considerable 77% from the previous year but up 13% from last month.  Sales of the gold bullion coin in August were only 11,500 ounces, the lowest monthly sales of the year.

The slowdown in gold coin sales marks a turnaround from the beginning of the year when demand for physical gold seemed insatiable.  April sales of the American Eagle gold coins came in at 209,500 ounces which was the largest sales month since December 2009 when 231,500 ounces were sold.

Despite the frenzy of money printing by banks around the world, gold bullion coin sales have declined every year since 2009 as the financial system stabilized.  Gold sales soared during the financial panic in 2009 to an all time high as nervous buyers sought safe haven in gold.

Yearly sales of the gold bullion coins are shown below.  The 2013 total is through September 3o.

Sales of the American Eagle silver bullion coins declined for the second month in a row.  During September the U.S. Mint sold 3,013,000 silver coins, down 7.4% from last year and down 16.9% from August.

Despite the soft sales in September, demand for the silver bullion coins has been robust this year.  If sales continue at the 3 million coins per month rate through year end, 2013 will turn out to be a record sales year with annual estimated silver bullion coin sales of 45 million.

Sales of the American Eagle silver bullion coins by year are shown below.  The 2013 sales total is through September 30.