April 26, 2024

No Silver Manipulation Says CFTC After Five Years and 7,000 Hours of Work

proof-silver-eagleThe case has been conclusively settled.  All those paranoid people who have been claiming manipulation of the silver market are wrong according to the Commodities Futures Trading Commission (CFTC).

After a five year investigation and 7,000 hours of investigativing silver trading the CFTC says there is no “viable case” for charging anyone with manipulating the silver market.  To prosecute a case the CFTC must prove the intention to manipulate prices along with proof of the actual trades involved in the manipulation.

Casting doubt on the CFTC’s decision was none other than CFTC Commissioner Bart Chilton who implied that even if there was manipulation, the standards for proving manipulation are so difficult that a lot of the bad guys are escaping justice.

CFTC Commissioner Bart Chilton, a vocal backer of the probe, said the decision shows it remains difficult to mount a case even after the Dodd-Frank financial overhaul eased some restrictions.

“It’s been the most frustrating and disappointing non-policy related item since I joined the CFTC in 2007,” Mr. Chilton said. “Our manipulation standard remains too high a hurdle for regulators to overcome; not enough bad actors are being punished.”

The CFTC has won recent acclaim for aggressive enforcement efforts in markets including interest rates, crude oil and platinum. But even with expanded powers to police derivatives markets stemming from Dodd-Frank, the agency has successfully concluded just one case–In the power market–from trial through appeal in its 39-year history.

The conclusion comes as policy makers reassess the banking industry’s role in commodity markets. The participation by firms such as J.P. Morgan and Goldman Sachs Group Inc. in businesses such as aluminum warehousing and power marketing have been the subject of congressional hearings and enforcement actions this year. The Federal Reserve is expected before 2013 ends to issue new rules governing banking companies’ participation in these markets.

Translation:  Even though the too big to fail banks such as JP Morgan have been found guilty of manipulating everything from the LIBOR rate to the price of aluminum the CFTC can’t find any evidence to prove that they manipulated the price of silver.

For an alternate view on silver market manipulation see How the COMEX Crashed the Silver Market and How Wall Street Pros Made Huge Profits On Silver ETF Crash As Small Investors Sold

In Four Years the Amount of Money Printed By the Fed Will Exceed the Value of All Gold Ever Mined

paper moneyMost people can’t begin to comprehend how much a trillion dollars is.

Try asking someone how much $1,000,000,000,000 (one trillion) is and you are likely to get a blank stare.

To put things into perspective, when the government spends one trillion dollars and pays for it with taxes, the government would have to seize the entire wealth of one million millionaires.  Since the government would very soon run out of millionaires, government spending has become largely financed through borrowings and printed money.

Money printing or QE as the Fed likes to call it has reached levels that bring back visions of the Weimar Republic and unlike the average citizen, the Fed has no problem dealing with dollars in the trillions.

Money printing by the Federal Reserve has gotten so out of hand that within four short years (probably less) the amount of dollars conjured out of thin air will exceed the value of all gold ever mined in human history.

The world’s entire gold stock is about 170,000 metric tons currently valued at about $7.7 trillion.  The Fed is currently holding $3.7 trillion of securities purchased with printed money and the run rate of $85 billion per month weighs in at another $1.02 trillion dollars per year.  If the economy tanks, expect the monthly money printing to really ramp up.

gold-demandFed’s money printing to date stands at $3.7 trillion.  Another four years of money printing at the current rate would pile up another $4.1 trillion for a total of $7.8 trillion printed dollars compared to the value of all gold at $7.7 trillion.

When all of this starts to sink into the public consciousness, the safe bet is that people will start to avoid dollars (which the Fed is manufacturing in almost unlimited quantities) and turn to gold which has been used as a currency and store of value since the dawn of human history.  Another safe bet is to ignore short term price corrections in gold and use the opportunity to increase positions.

Fed’s Inflate or Die Monetary Policy Guarantees A Monumental Financial Crisis

economic collapseBy: GE Christenson

The U.S. economy is being overwhelmed by a loss of faith and trust in politicians, government, and bankers, excessive debts, artificially low interest rates, unsustainable deficit spending, expensive wars, QE (money printing) to infinity, “Inflate or Die” monetary policy, potential derivatives implosion, Obamacare and so much more.

If you believe that total government debt can grow FOREVER and more rapidly than the underlying economy, this article is NOT for you.

If you believe that governmental deficit spending, QE, and bond monetization can continue FOREVER without major consequences, this article is NOT for you.

But if you are sane enough to know that our current economic policies will produce a “train wreck,” read on…
A slow-motion collapse is occurring and most of us do not see it.

Consider these thoughts from insightful writers: –
Collapse Indicated by Stalling Growth in Global Financial Reserves

Hugo Salinas Price:

“As it is, the US can only continue to monetize government debt. Higher dollar interest rates are inevitable and will cause further government deficits; the debt overhang in both the US and Euro Zone is so great that a rise of a few points in interest rates will explode the deficits, and so on and so forth.

Bottom line: Stalling growth in International Reserves tells me that a world financial collapse is in the offing.”

Collapse Indicated by Loss of Trust in Western Economic Systems

David Stockman:

“There is no honest pricing left at all anywhere in the world because central banks everywhere manipulate and rig the price of all financial assets. We can’t even analyze the economy in the traditional sense anymore because so much of it depends not on market forces, but on the whims of people at the Fed.”

“The Blackberry Panic of September 2008, in which Washington policy makers led by former Goldman Sachs CEO Hank Paulson, panicked as they saw Wall Street stock prices plummet on their mobile devices, had very little to do with the Main Street economy in the United States. The panic and bailouts that followed were really about protecting the bonuses and incomes of very wealthy and politically well-connected managers at banks and other heavily leveraged businesses that were eventually deemed too big to fail. What followed was a massive transfer of wealth from the taxpayers and middle-class savers, in the form of bailouts and zero interest rates on bank deposits imposed by the Fed, to the so-called One Percent.”

“I think the political realities of the situation make the most likely scenario one in which there will be some kind of real financial collapse and disorder that will require a total reconstruction of the system.”

The Burning Platform:

“Despite the frantic efforts of the financial elite, their politician puppets, and their media propaganda outlets, collapse of this aristocracy of the moneyed is a mathematical certainty. Faith in the system is rapidly diminishing, as the issuance of debt to create the appearance of growth has reached the point of diminishing returns.”

“We are witnessing the beginning stages of political collapse. The government and its leaders are being discredited on a daily basis. The mismanagement of fiscal policy, foreign policy and domestic policy, along with the revelations of the NSA conducting mass surveillance against all Americans has led critical thinking Americans to question the legitimacy of the politicians running the show on behalf of the bankers, corporations and arms dealers.”

“We are supposedly five years past the great crisis. Magazine covers proclaimed Bernanke a hero. If we are well past the crisis, why are the extreme emergency measures still in effect? If the economy is growing and jobs are being created, why do we need $85 Billion of government debt to be monetized each and every month?”

“Just the slowing of debt creation will lead to collapse. Bernanke needs a Syrian crisis to postpone the taper talk. Those in control need an endless number of real or false flag crises to provide cover for their printing presses to keep rolling.”

Bill Fleckenstein:

“Since April, the 10-Year has gone from about 1.6% to as high as 3% recently. Now we have to see when this rally in bonds stops. The bond market will then roll over and then the Fed won’t have the tapering as an excuse. It means the bond market has ceased to price in the scenario that the Fed wants, and the bond market is not responding to the Fed’s moves in the short-run. In the old days we would call that ‘losing control of the bond market.’ And if that starts to happen, all hell is going to break loose.”

Michael Pento:

“The 10-Year went from 1.4% to 3%, and that made Mr. Bernanke panic. The average on that (10-Year) yield is 7% in the modern era since 1971 when we closed the ‘gold window.’ So, if the average is 7%, and the United States of America, this once great land, can’t (even) tolerate a 3% yield on the 10-Year Note, that means the Fed can never unwind QE.

That’s enough to cuff Mr. Bernanke’s hands. So the Fed is indeed trapped as you indicated. They cannot significantly bring down QE. That means a perpetual increase in the Fed’s balance sheet. That (also) means an inexorable rise in asset bubbles like stocks, bonds, and real estate, and it’s going to end (very) badly.”

Hank Paulson Interview:

“Paulson believes there will be another financial crisis.”

“It’s a certainty. As long as we have markets, as long as we have banks, no matter what the regulatory system is, there will be flawed government policies. Those policies will create bubbles.”

Alternate Interpretation: As long as we have Treasury Secretaries who represent the interests of Goldman Sachs and Wall Street bankers instead of the US economy, then we can be certain of another financial crisis.
Collapse in Retirement Income

Dennis Miller:

“While the Federal Reserve holds down interest rates and floods the banking system with money, it’s destroying the retirement dreams of several generations. The Employee Benefit Research Organization reports that 25 – 27% of baby boomers and Generation Xers who would have had adequate retirement income – under return assumptions based on historical averages – will run out of money if today’s low interest rates are permanent.”

In addition to the problem of low yielding investments caused by the historically low interest rates created by the Fed, even more retirees will run out of money, much sooner, when the inevitable inflation in food and energy prices smacks the U.S. economy, and especially retirees.
Discussion

It seems clear that we are losing faith in our politicians, our leaders, and our financial systems. Approval levels for congress and the President of the United States are low. Too-Big-To-Fail banks and “banksters” are despised and openly criticized.

The Federal Reserve is losing credibility; more and more people are realizing that QE is good for the bankers and the wealthy, but that it does little for “Main Street” people except drive up the prices they pay for food and energy.

The American public is generally opposed to war in the Middle East but that seems to matter little to the political and financial elite who will profit from the war.

Most people, so it appears, know that inflation is much higher than officially stated, and that inflation will become far worse than it is today. (When was the last time you saw a cup of premium coffee or a gallon of gasoline for less than $1?)

Read: Going Dark! Economic Cycles Point Downward

GE Christenson
aka Deviant Investor

Physical Gold Bar and Coin Sales Soar 78% To All Time High

1988-olympic-goldPurchases of physical gold have been hitting new all time records.  Demand has been fueled by the recent pullback in gold prices and the massive amount of money printing being conducted by central banks in Europe, Japan and the United States.  The recent decision by the Federal Reserve to postpone any curtailment of its $85 billion per month of money printing could mark the end of the correction in gold and silver.  The Fed’s refusal to reduce the ongoing program of securities purchases signals that QE has morphed from an emergency measure to a permanent Fed policy.

The demand for gold has been particularly intense in Asia as Thai Gold Buyer Doubles Imports After Bear Slump.

YLG Bullion International, Thailand’s biggest domestic gold importer, expects to more than double purchases this year after the bear market in prices spurred a surge in demand for physical metal.

The company may import as much as 200 metric tons in 2013, from 92 tons last year, Chief Executive Officer Pawan Nawawattanasub said in an interview yesterday. First-half shipments advanced to 112 tons, accounting for 60 percent of the country’s total, she said. A ton is valued at $42.6 million.

Gold tumbled 21 percent this year, heading for the first annual retreat since 2000, as some investors lost faith in the metal as a store of wealth. With prices now 32 percent below the record reached in September 2011, the rout is boosting demand for bullion bars and coins, global sales of which surged 78 percent to an all-time high in the second quarter, according to the London-based World Gold Council.

“Cheaper prices are attracting customers to buy bullion bars as they see it as money better spent than on something like a Hermes bag,” said Pawan, whose Bangkok-based company supplies retailers and investors in Southeast Asia’s second-biggest economy. “Demand in Thailand can continue to grow, partly because collecting gold is in our culture.”

Golden Buddha of Bangkok, World’s Largest Gold Statue -estimated gold value $250 million

Gold demand in Thailand is exceeded only by China and India.  Total gold demand in China and India in the form of jewelry, bars and coins is expected to reach 1,000 tons this year and gold demand in Thailand should reach 200 tons.  Total Asian gold demand from China, India and Thailand could amount to half of total world gold production of approximately 2,400 tons in 2013.

Even more astonishing is the fact that the entire world’s production of gold this year will be purchased by only three sources.  According to King World News, total gold buying by central banks, China and India is “almost equivalent to the annualized gold production of the entire world.”  It is only  a matter of time before a shortage of physical gold based on huge demand results in significantly higher prices.

Will The Fed’s “Beautiful Money Printing” Lead to Economic Recovery?

The End GameBridgewater’s Ray Dalio, one of the world’s most successful hedge fund investors, has put out a neat video explaining how the economic system works and how the suffocating burden of unmanageable debts can be reduced without propelling the world into uncontrollable inflation or a deflationary depression.

According to Dalio, every deleveraging  in history has involved a combination of cutting spending, reducing debt through defaults and restructuring, redistributing wealth and the printing of money by central banks.

Each method of deleveraging must be done in just the right amount to avoid tipping the economy into either deflation or inflation.  For example, spending cuts, also know as austerity, leads to falling incomes as less money is spent and debt burdens becomes even more untenable as deflation sets in.  Fewer jobs and higher unemployment from spending cuts require even further spending cuts and this vicious cycle of lower incomes and higher debts ultimately leads to a severe economic contraction known as a depression.  Increased taxes on the wealthy to redistribute spending power to the poor and debt write offs must also be conducted in measured amounts to avoid social unrest between the “haves and have nots.”

Money printing by the central bank is also essential in Dalio’s view since interest rates are already at zero and printed money is necessary to make up for disappearing credit.   If money printing along with spending cuts, wealth distribution and debt restructuring are done in just the right proportions, a “beautiful deleveraging” occurs resulting in declining debts and strongly positive economic growth.  If the four factors of develeraging are done properly, money printing will not cause inflation since the printed money merely offsets the credit destruction triggered by reduced lending and borrowing and debt restructurings.

Dalio does not explain how the central bank and central government can accurately determine how to precisely apply his four develeraging factors to get the economy back on track.  In addition, Dalio admits that the whole system winds up falling apart if incomes do not grow faster than debt.  If debts continue to grow at 4% and incomes increase by only 2%, the debt burdens continue to grow, the economic problems compound and banks continue to cut back on lending until incomes increase.

Income growth can outpace debt growth, according to Dalio, if the Fed prints “just the right amount of money.”  Good luck with that – the members of the Fed can’t even agree on whether or not money printing is causing more harm than good and the Fed’s money printing efforts have been totally counterproductive in attempting to increase incomes as Household Incomes Remain Flat.

Over a longer perspective, the figures reveal that the income of the median American household today, adjusted for inflation, is no higher than it was for the equivalent household in the late 1980s.

For all but the most highly educated and affluent Americans, incomes have stagnated, or worse, for more than a decade. The census report found that median household income, adjusted for inflation, was $51,017 in 2012, down about 9 percent from an inflation-adjusted peak of $56,080 in 1999, mostly as a result of the longest and most damaging recession since the Depression. Most people have had no gains since the economy hit bottom in 2009.

Government programs remain a lifeline for millions. Unemployment insurance, whose eligibility the federal government expanded in response to the downturn, kept 1.7 million people out of poverty last year. Food stamps, if counted as income, would have kept out four million.

Since the recession ended in 2009, income gains have accrued almost entirely to the top earners, the Census Bureau found. The top 5 percent of earners — households making more than about $191,000 a year — have recovered their losses and earned about as much in 2012 as they did before the recession. But those in the bottom 80 percent of the income distribution are generally making considerably less than they had been, hit by high rates of unemployment and nonexistent wage growth.

The Fed’s money printing rampage has done nothing but inflate the cost of living for the average American even as wages continue to spiral downward.  What will the Fed do next?  There is every reason to believe that the money printing will continue to expand as it did in the Weimar Republic as explained in The Economic Collapse.

There is a reason why every fiat currency in the history of the world has eventually failed.  At some point, those issuing fiat currencies always find themselves giving in to the temptation to wildly print more money.  Sometimes, the motivation for doing this is good.  When an economy is really struggling, those that have been entrusted with the management of that economy can easily fall for the lie that things would be better if people just had “more money”.  Today, the Federal Reserve finds itself faced with a scenario that is very similar to what the Weimar Republic was facing nearly 100 years ago.  Like the Weimar Republic, the U.S. economy is also struggling and like the Weimar Republic, the U.S. government is absolutely drowning in debt.  Unfortunately, the Federal Reserve has decided to adopt the same solution that the Weimar Republic chose.  The Federal Reserve is recklessly printing money out of thin air, and in the short-term some positive things have come out of it.  But quantitative easing worked for the Weimar Republic for a little while too.  At first, more money caused economic activity to increase and unemployment was low.  But all of that money printing destroyed faith in German currency and in the German financial system and ultimately Germany experienced an economic meltdown that the world is still talking about today.  This is the path that the Federal Reserve is taking America down, but most Americans have absolutely no idea what is happening. It is really easy to start printing money, but it is incredibly hard to stop.  Like any addict, the Fed is promising that they can quit at any time, but this month they refused to even start tapering their money printing a little bit.

Long term investors in gold and silver should continue to accumulate positions at current bargain prices as part of a long term wealth preservation strategy.

Collapse of Bernanke’s Credit Bubble Will Destroy the Global Financial System

collapseBy: GE Christenson

The U.S. stock market is near all-time highs, while politicians and economists are blathering about recovery, low inflation, and good times, but instability and danger are clearly visible in our debt based monetary system. To the extent we rely upon the fantasies of ever-increasing debt, money printing, and credit bubbles, we are vulnerable to financial collapses. Perhaps a collapse is not imminent, but it would be foolish to ignore the possibility. Consider what these insightful writers have to say:

The Fantasy of Printing Money To Solve Problems

Bill Fleckenstein:

“Money-printing cannot solve problems. It doesn’t really give us much gross domestic product growth, as we have seen. It hasn’t really helped on the employment front either, as job growth is meager (of course, it is also hampered by other government policies). What money-printing has accomplished is to push the stock market high enough to cause people to once again become delusional in their expectations.”

Egon von Greyerz:

“Debt worldwide is now expanding exponentially. With absolutely no possibility of stopping this debt explosion, we will soon enter a period of unlimited money printing leading to a total destruction of paper currencies. The consequence will be a hyperinflationary depression in most major economies.”

Andy Hoffman:

“No, Larry Summers won’t be able to save the day… The damage is already done; and thus, NOTHING can turn the tide of 42 years of unfettered, global MONEY PRINTING – which as I write, has entered its final, terminal phase.”

Bullion Bulls Canada:

“So the ending is already clear. The U.S.S. Titanic is about to be intentionally sunk (again), and B.S. Bernanke’s ‘fingerprints’ will be planted all over the crime scene.”

CREDIT BUBBLE IN THE GLOBAL ECONOMY WILL EVENTUALLY COLLAPSE

John Rubino:

“…nothing was fixed after 2008, just as nothing was fixed after the housing, tech stock, and junk bond bubbles burst. The response has been the same each time, only progressively more aggressive and experimental. That the financial, economic and political mainstream think that the system has been reset to ‘normal’ because asset prices are back where they were just before the 2008 crash is, well, crazy. With financial imbalances bigger than ever before – and continuing to expand – the only possible outcome is an even bigger crash.”

Bill Holter:

“THIS is where THE REAL BUBBLE is! The biggest bubble in all of history, (larger than the Tulip mania, South Sea, the Mississippi Bubble, 1929, current global real estate and global stock bubble combined then cubed) is the current and total global financial system. EVERYTHING EVERYWHERE is based on credit. In fact, over 60% of this credit is dollar based and ‘guaranteed’ by the U.S. government. The minor little problem now is that we have reached ‘debt saturation’ levels everywhere. There are no more asset classes left able to take on more credit (air) to inflate the balloon. The other minor detail is that the ‘asset’ that underlies the value of everything (the dollar and thus Treasury securities) is issued by a bankrupt entity. What could possibly go wrong?”

Discussion

Growing and healthy economies mean more people are productively employed. It appears that much of the “growth” in the U.S. economy over the last five years has been in disability income, food stamps (SNAP), unemployment, student loans, welfare, debt, and government jobs – none of which are productive. Examine the following graph of Labor Force Participation Rate – the actual percentage of the populace that is employed. Does this look like a healthy economy experiencing a recovery or a collapse in productive employment?

The damaging effects of 100 years of Fed meddling in the U.S. economy, many expensive wars, 42 years of unbacked debt based currency, and unsustainable growth in credit and debt have left the Western monetary system in a precarious position.

Using common sense, ask yourself:

  1. Can total debt grow much more rapidly than the underlying economy which must support and service that debt? FOREVER?
  2. Can government expenditures grow much more rapidly than government revenues? FOREVER?
  3. Will interest rates remain at multi-generational lows? FOREVER?
  4. Will a fiscally irresponsible congress rein-in an out of control spending system that our fiscally irresponsible congress created?
  5. Is another and larger (than 2008) financial collapse likely and inevitable?
  6. Do you still believe in the fantasies of ever-increasing debt, printing “money” and credit bubbles? Are you personally and financially prepared for a potential financial collapse?
  7. Have you converted some of your digital currencies into real money – physical gold and silver? Is it safely stored outside the banking system and perhaps in a country different from where you live?

Read: The Reality of Gold and the Nightmare of Paper
Read: What You Think is True Might Be False and Costly

GE Christenson
aka Deviant Investor

Gold and Silver Soar As Fed Rejects Tapering and Revs Up The Printing Presses

Physical-GoldThe months long guessing game on whether or not the Fed would start tapering its $85 billion per month of treasuries and mortgage securities came to a conclusion today as the Fed promised to keep the printing presses going full blast.

Many analysts had come to the conclusion that the economy had strengthened enough for the Fed to begin reducing monetary stimulus but they were wrong as Fed, in Surprise Move, Leaves Bond-Buying Intact.

The Federal Reserve postponed any retreat from its long-running stimulus campaign Wednesday, saying that it would continue to buy $85 billion a month in bonds to encourage job creation and economic growth.

As Congressional Republicans and the White House hurtle toward another showdown over federal spending, the Fed said it was concerned that fiscal policy once again “is restraining economic growth,” threatening to undermine what the Fed had described just months ago as a recovery gaining strength.

Proponents of aggressive asset purchases, including Mr. Bernanke, also face mounting pressure from internal critics who argue that the modest benefits of bond-buying are increasingly outweighed by the risk that the Fed is encouraging excessive speculation or interfering with normal market function.

Some critics inside and outside the Fed have even begun to argue that the central bank’s bond-buying is preventing a return to normalcy.

“The economy is positioned to benefit from modestly higher longer-term interest rates,” Ms. George said earlier this month. She noted that higher rates could increase the income of retirees and bolster bank profits without a commensurate increase in risk-taking.

Despite the growing criticism of his securities purchase program the Fed decided that the time was not yet right for reducing the one trillion dollar securities purchase program which is financed by the Fed’s money presses.  According to the FRB press release:

Taking into account the extent of federal fiscal retrenchment, the Committee sees the improvement in economic activity and labor market conditions since it began its asset purchase program a year ago as consistent with growing underlying strength in the broader economy. However, the Committee decided to await more evidence that progress will be sustained before adjusting the pace of its purchases. Accordingly, the Committee decided to continue purchasing additional agency mortgage-backed securities at a pace of $40 billion per month and longer-term Treasury securities at a pace of $45 billion per month.

The Fed has already blown up its balance sheet to $4 trillion and the federal government has almost tripled its debt load to $17 trillion from $6 trillion in 2002.  After this massive stimulus of $15 trillion into the economy, the Fed now tells us that more is needed.

US Debt

Today’s actions tell us that the Fed will never find an opportune time to reduce its money creation and the gold  and silver markets reacted accordingly.  After the Fed’s announcement gold skyrocketed by over $50 per ounce and silver shot up by almost $1.50 per ounce.

The reasons for holding gold and silver have never been stronger despite the recent pullback in prices and today’s announcement by the Fed serves to further prove this assertion.

gold soars

silver soars

Higher Gold and Silver Prices Are Guaranteed By the Endless Creation of Paper Currency

bernanke's paperBy: GE Christenson

Step into the “Wayback Machine” and journey back in time to:

1932: Silver was selling for about $0.25 per ounce (average annual price per Kitco.com). Our $100 bill would buy about 400 ounces.
1962: Silver was selling for about $1.20 per ounce. Our $100 bill would buy about 83 ounces.
1982: Silver was selling at about $10.60 per ounce. Our $100 bill would buy about 9 ounces. (Early in 1980 silver spiked to about $50 per ounce for a day or so and then crashed.)
2012: Silver was selling for about $31 per ounce. Our $100 bill would buy about 3 ounces.
Today: Silver prices have been volatile. Our $100 bill will buy perhaps 4 ounces of silver.

Over the course of the last 100 years, during which we have been blessed with the Federal Reserve and massive government spending, our $100 bill no longer buys 400 ounces of real physical silver; now it will purchase only about 4 ounces.

What have we learned from our quick survey of the history of silver prices?

Prices are volatile – they can go drastically higher and then crash.

On average, $100 buys less silver with each passing decade because the currency is worth less each decade.

What can we expect for the price of silver? It seems obvious that:

All paper currencies eventually decline in value to their intrinsic value – approximately zero. Voltaire understood this concept almost three centuries ago. Several hundred unbacked paper currencies have become worthless since the time of Voltaire.

Governments and banks represent the status quo so very little will change without a crisis or collapse. Governments spend more than their revenues and borrow the difference, thereby increasing total debt and the money supply. The status quo involves the creation of more and more currency, all of which is backed by debt, not assets.

US Government Revenue, Expenses, Official Debt (rounded in $Billions):

Year                       1971    2012
Expenses                210     3,500
Revenues               187     2,400
Official Debt           408    16,100

Inflation and debt are “hardwired” into our monetary system. Don’t expect government spending or total debt to decrease unless there is a massive financial crisis.

Official debt is shown but it does not include unfunded liabilities for Social Security, Medicare, Pensions and so forth. The total debt including unfunded liabilities has been calculated in the $100 – $200 Trillion range and rapidly rising.

As the money supply and total debt increase, average prices increase. Hence silver has increased from a few cents to many dollars per ounce. Five cent coffee and $0.19 gasoline are ancient history.

The process will continue until it no longer can – perhaps a few years, perhaps a decade. Don’t bet on the imminent demise of a system that enriches banks and the political elite while it increases governmental power.

Plan on reduced purchasing power of unbacked fiat currencies.

Bet on the inevitability of higher silver and gold prices – because the value of the paper currencies is decreasing every year.

For the Future


Eighty years ago $100 purchased 400 ounces of silver while today that $100 purchases about 4 ounces. Someday soon $100 will purchase only one ounce of silver.

Depending on how rapidly the money supply is increased and how quickly confidence in paper money evaporates we may see the day when it takes ten, or more, $100 bills to purchase a single ounce of silver. Hyperinflation has happened in many countries in the past 100 years and many good analysts believe that it COULD occur again in Europe and the United States. If hyperinflation occurs, your silver and gold will be worth much more in nominal dollars and will, to some extent, protect your purchasing power. Unfortunately, life in a hyperinflationary economy is likely to be exceedingly difficult for most people.

Prepare by purchasing physical silver and gold and storing it outside the banking system.

Read: Gold, Silver and Sins of the Past

By GE Christenson, aka Deviant Investor

GE Christenson

Gold To Silver Ratio Says Silver Is A Screaming Buy

washington-quarterBy: GE Christenson

Six of eight significant silver market lows in the past 23 years occurred when the GSR (gold to silver ratio) was > 64 and the RSI (Relative Strength Index of the GSR was < 35.

Silver, in late June and early July 2013, met the above criteria, along with a near record low RSI of the GSR, and a record low in the TDI Trade Signal Line. These are strongly bullish conditions.

Previously, two other important lows occurred about 4.7 years ago, and 9.2 years ago. Both of those lows were followed by explosive rises that took silver prices much higher. The June/July 2013 low looks similar to the 2004 and 2008 lows. We will see if the upcoming rally is similarly explosive or not.

October 2008: $8.53 to nearly $50.00

May 2004: $5.50 to about $21.00

The Analysis:

Much has been made of the gold to silver ratio. It is currently (August 8, 2013) about 64, with gold about $1312 and silver about $20.41. After examining the data for the GSR for the past 23 years, we find that:

• The highest ratio was about 102 in February of 1991. (silver very low) • The lowest ratio was about 32 in April of 2011. (silver quite high) • The average ratio (weekly closes) since 1/1/1990 has been about 65. • The average ratio for the past 10 years has been lower at about 58.

All significant price lows in the past 23 years occurred at (GSR) ratios greater than 64. However, a better indicator of significant lows is the Relative Strength Index of the GSR based on 21 weekly closes combined with the GSR.

Not all significant lows were marked by HIGH ratios and a LOW RSI of the ratio. But, a high ratio along with a low RSI were strongly indicative that a significant price low had just passed (typical) or was due very soon. The low in the RSI usually occurs about two weeks after the actual price low. Think of this as confirmation of the price low.

Gold/Silver Ratio Courtesy kitco.com

Gold/Silver Ratio
Courtesy kitco.com

Further:

July 05, 2013 had a silver low of $18.73 (weekly close – actual low was in June). Silver had fallen 46% in 9 months since a temporary high of $34.57 in October of 2012.

about 4.7 year earlier:

October of 2008 marked a silver low of $9.29 (weekly close – actual low was $8.53). Silver had fallen 55% in 7 months since a high of $20.94 in March of 2008.

about 4.5 year earlier:

May of 2004 marked a silver low of $5.60 (weekly close – actual low of $5.50). Silver had fallen 33% in 1.5 months since a high of $8.31 in April of 2004. The rapid price collapse (only 1.5 months) did not allow the RSI of the ratio to reach a low value. The TDI Trade Signal Line Indicator (an overbought / oversold oscillator) made its lowest (most oversold) reading in July 2013 in the past 39 years – the entire range of my data. Many other oscillators were also deeply oversold and similarly bullish.

The near future for silver prices is uncertain, especially with the increasing use of High Frequency Trading (HFT) and the post 2008 “managed” markets. Perhaps the good people at JP Morgan or Goldman Sachs have another crash planned, which we will find out in due time. But indications are that the big players (JP Morgan etc.) are more long and less short in the paper gold market than in many years, or perhaps ever. Hence they are nicely positioned to profit from a large rise in the price of gold.

Silver seems likely to rally, shoot ahead of gold with a larger percentage increase, and thereby decrease the ratio below 40.

CONCLUSIONS:

Six of eight significant silver market lows in the past 23 years occurred when the GSR (gold to silver ratio) was > 64 and the RSI (Relative Strength Index) of the GSR was < 35.

Silver, in late June and early July 2013, met the above criteria, along with a near record low RSI of the GSR, and a record low in the TDI Trade Signal Line. These are strongly bullish conditions.

Previously, two other important lows occurred about 4.7 years ago, and 9.2 years ago. Both of those lows were followed by explosive rises that took silver prices much higher. The June/July 2013 low looks similar to the 2004 and 2008 lows. We will see if the upcoming rally is similarly explosive or not.

October 2008: $8.53 to nearly $50.00
May 2004: $5.50 to about $21.00

Read: Back to Basics – Gold, Silver and the Economy

GE Christenson
The Deviant Investor

Silver Soars On Strong Physical Demand and Bargain Prices

proof-silver-eagle3
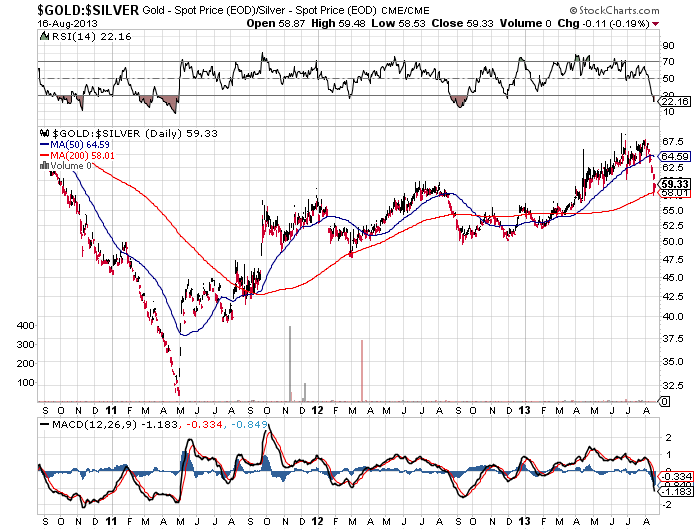
There is no denying that it has been a really tough year for silver investors with silver dropping from $32.23 in January to a yearly low of $18.61 in June.  Is the silver price correction finally over?  The ridiculously low price of silver has resulted in a strong surge of demand worldwide and the price of silver has soared by 23% since the June low.

No one knows if the three year bear market in silver is finally over but investors seem to have made up their minds that the current price of silver is at give away levels.  The World Gold Council reported last week that bar and coin purchases rose to record levels last quarter.  Silver demand in India and China remains very strong and U.S. investors have been buying American Eagle silver bullion coins at a record pace.

Sales by the U.S. Mint of the American Eagle silver bullion coin may hit an all time record this year based on year to date sales data.  The all time record year for sales of the silver bullion coins was in 2011 when the Mint sold almost 40 million one ounce coins.

Sales of the silver bullion coins since 2000 are shown below with sales for 2013 as of July 31st.

American Silver Eagle Bullion Coins
YEAR OUNCES SOLD
2000    9,133,000
2001    8,827,500
2002   10,475,500
2003    9,153,500
2004    9,617,000
2005   8,405,000
2006   10,021,000
2007    9,887,000
2008   19,583,500
2009   28,766,500
2010   34,662,500
2011   39,868,500
2012   33,742,500
2013   29,450,000

TOTAL 261,593,000

With sales of almost 30 million coins through July, annualized sales based on monthly sales to date would result in a record smashing year with investors purchasing over 50 million American Eagle silver bullion coins.  With governments worldwide printing money to prop up a financial system overwhelmed by debt it’s probably a very safe bet that the price of silver will continue to increase in price.

Since 2000 investors have bought over a quarter of a billion silver eagle bullion coins with a current estimated value of over $5.7 billion.  The U.S. Mint American Eagle bullion coin program has been one of the most successful mint products ever produced.