March 29, 2024

An Audit of U.S. Gold Holdings Last Done Over 50 Years Ago

Fort KnoxDoes anyone really think that gold is unencumbered, unleased, and actually physically there? Yes, I know…

  • They would not lie to us, right?
  • The official numbers must be true, right?
  • They seem like trustworthy people, right?
  • Why wouldn’t it be there?

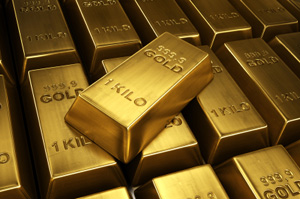
The official gold holdings ( rounded numbers) of the US Treasury Department are as follows:

Fort Knox 147,000,000 ounces, West Point 54,000,000 ounces, Denver 44,000,000 ounces, Federal Reserve of NY 13,000,000 ounces, other 3,000,000 ounces –  Total – 261,000 ounces.

Glad you asked that question. Why wouldn’t it be there? Gold is a bit like an “anti-dollar.” The Federal Reserve creates new dollars by the trillions – dollars are their product. Wal-Mart sells snow shovels and a few other things, Wall Street sells stocks and everything paper, Hollywood sells dreams and entertainment, but the Fed sells dollars, and they don’t like competition. Gold has been real money for 5,000 years world-wide. Federal Reserve notes have been passed off as money for a few decades, and in that time they have lost most of their value as measured against commodities such as wheat, gasoline, and cigarettes.

It could have been worse! Western central banks (officially) and governments sold a considerable sum of gold during the 1990s to help repress the price of gold and to slow the apparent decline in the value of paper money. They also “leased” an unknown amount of gold to bullion banks who also sold that gold into the market. The leases are still “on the books,” so the central banks officially still own the gold, even though it is probably long gone – likely to China, Russia, India, and the Middle East.

Yes, central banks and governments have motive, means and opportunity to suppress the price of gold. They want to support their product (dollars, euros, etc.) and to defeat the competition – gold. If you were a central banker or treasury official who was inflating his currency and consequently reducing its purchasing power, wouldn’t you want to suppress the price of gold to delay recognition of your involvement in the devaluation process?

So why not just do an audit? This is a simple question with a complex set of answers. Here are a few.

    • The US gold has not been audited in over 50 years. This must seem strange to any thinking person, but it appears unlikely to change.
    • If the Treasury agrees to an audit and the gold is not there, the result will be much unpleasantness – possible indictments, damaged reputations, social unrest, chaos, disillusionment, and destroyed trust – and there is plenty of disillusionment and destroyed trust already.
    • If the Treasury performs an audit and the audit claims the gold is actually there, will anyone believe the results of the audit? Is it truly unencumbered – not sold, leased, or hypothecated? Would we even believe an audit had been actually performed?
    • If the Treasury acknowledges the lack of a credible audit for over 50 years and then says “we don’t think it is necessary,” will anyone take them seriously?
    • The Treasury might claim an audit would be too expensive, but the US government probably wastes the cost of an audit every few hours, so that explanation is likely to sound hollow and stupid.Bottom line: The whole subject of an audit is fraught with potential trouble for both the Treasury and the Fed. The simple solution is to stonewall the audit question and “extend and pretend.”

The problem is that the questions just won’t die. GATA has researched the subject thoroughly and suggests that much of the Treasury gold is probably gone. Eric Sprott has examined the export numbers (official US government export data) and concluded that somehow the US exported about 4,500 tons of gold more than can reasonably be accounted for.

Germany asked for their gold back – a measly 300 tons – and was told it would take seven years to return their gold. It the gold was physically in the vault and unencumbered, it should have taken a few weeks at most. Seven years – really? This must seem strange to any thinking person.

From Bill Holter: “I would like to address the biggest (in my mind) conspiracy theory (fact) of all. It has been “said” for nearly 60 years that the U.S. has 8,400 tons of gold left. First off, there has been no audit done since 1956, not even Senators or Representatives (except for one time in the ’70?s for glance) have been allowed to actually see the gold. “Trust us” is what the population has heard, “trust us” is what foreigners are told…trust us, trust us, trust us. The problem is that so much anecdotal evidence has been dug up by GATA and others. Eric Sprott just last month looked at the U.S. gold export numbers going back 10 years or more and found that 4,500 tons OVER AND ABOVE what are reported as production has been shipped out. Where did that gold come from? When looked at with your 3rd grade mind in gear, there is no way that the gold is really there.

… Forget about all of the past official memos uncovered. Forget all of the evidence that GATA has uncovered over the last 15 years. Forget that Germany asked for their gold and were told “wait 7 years.” Forget that gold and silver prices have not acted like any other market since the mid 90′s and those prices have now crashed 3 times in the face of massive demand. Forget that 2 of the smash downs occurred WHILE the CFTC was supposedly “investigating” the silver market. Forget that 40% of the world’s total gold production was sold in reckless fashion in less than 12 trading hours (who would, could, do this?) FORGET IT ALL! …trust us. … All of this “conspiracy stuff” when put together rather than separately makes sense.”

I don’t know how much gold is left, but I have two (only slightly serious) suggestions:

A very large number of readers on the Deviant Investor site have voted over the past several months regarding what % of the gold they think remains in the US Treasury. The choices were all of it, most of it (>75%), about half (40% to 75%), some (20% – 40%) or very little (<20%). Readers clearly do not believe the official story – about 60% believe very little remains and another 21% believe less than 40% remains. Only 3% think it is all there. A weighted average suggests that the voters on this site believe approximately 20% of the gold physically remains and is unencumbered.

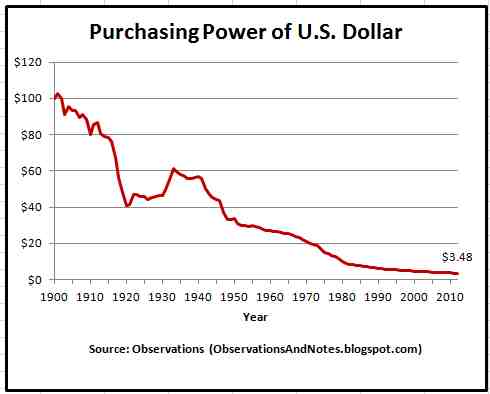
Nixon temporarily closed the “gold window” almost 42 years ago. Since that time, the official CPI shows that the dollar has lost about 83% of its value. For simplicity, let’s assume that 17% of the dollar’s purchasing power remains and assume that 17% of the gold remains.

We don’t know how much of the gold remains. Does it really matter?

Do any of the following matter?

  • Government promises
  • Central bank promises
  • Integrity of politicians
  • Integrity of hundreds of present and past Treasury employees
  • Backing for $Trillions in debt besides “full faith and credit”
  • A possible solution to the massive debt problem of the US government. If the gold is still there, value it at some large number, say $15,000 – $30,000 per ounce, and then back the dollar with gold. This is not my idea – some very intelligent people have advocated it. If the gold is mostly gone, this option is less likely.

Summary

  • Fort Knox: Per the voting and dollar devaluation “method” – assume about 20% of the official gold remains – physically in the vaults, unencumbered, not hypothecated or leased to bullion banks. Yes, I know, this is not defensible, scientific, statistically significant, or verifiable. But it sounds about right to me.
  • Denver: Assume about the same
  • West Point: Assume about the same
  • Federal Reserve Bank of New York: Ask the Germans! Assume very little remains.

How much physical gold do you have? How much do you want when you contemplate nearly $17,000,000,000,000 in official US government debt, another $100 – $200 Trillion in unfunded liabilities, and nothing backing that unbelievable amount of debt except the “full faith and credit” of what is clearly a government that won’t balance a budget and must resort to printing dollars to pay its bills?

How much gold do you have stored in a secure (off-site) facility?

GE Christenson
aka Deviant Investor

Will John Paulson Cut His Losses On Gold?

gold1Hedge fund investor John Paulson, who made billions shorting mortgage securities ahead of the financial crash,
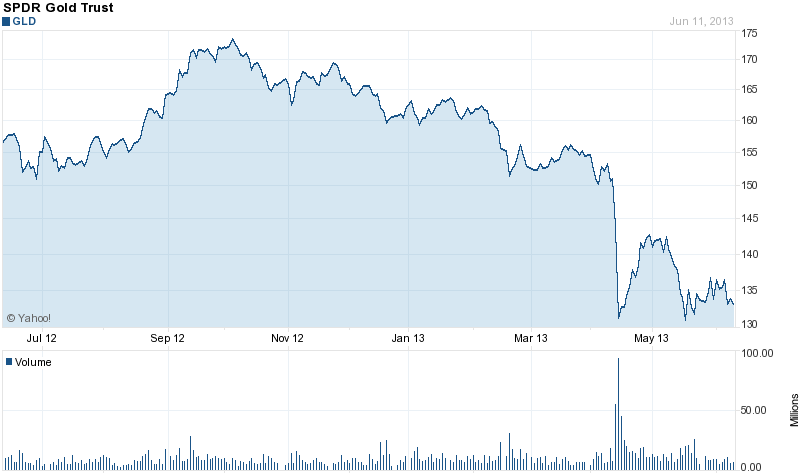
 lost 13% on his gold holdings in May after taking a blood bath in April. 

Billionaire John Paulson, the hedge-fund manager trying to recover from losses related to bullion this year, posted a 13 percent decline in his Gold Fund last month, according to a letter to investors.

The drop brings losses in the strategy to 54 percent since the start of the year, the firm said in the letter, a copy of which was obtained by Bloomberg News. The Gold Fund is the smallest strategy of the $19 billion money manager, with about $360 million, or 2 percent of assets, most of it Paulson’s own money.

Gold fell 5.4 percent and gold equities declined 3 percent in May on speculation the Federal Reserve will scale back its bond purchases, reducing the attractiveness of bullion and related securities as a hedge against inflation.

Paulson holds most of his massive gold positions in the SPDR Gold Trust (GLD) and had increased his position in mid 2012, bringing his total holdings to 21.8 million shares.  The  April 2013 gold crash resulted in losses on Paulson’s gold positions of over $600 million.   Even as other large hedge fund traders such as George Soros  liquidated large gold positions, Paulson remained committed to his gold positions and has told investors to remain invested in gold since current valuations provide a “significant upside.”

At December 31, 2012, Paulson’s position of 21.8 million shares in the GLD was valued at $3.4 billion.  Based on yesterday’s closing price of $133.25, the value of Paulson’s GLD shares would be worth $2.9 billion for a decline of $500 million, a serious loss even for a billionaire.

Seasoned stock traders know that “cutting your losses short”  is the most important rule of investing and often the toughest rule to follow.  Does Paulson know something about the gold market that no one else knows or will he wind up closing his gold positions to avoid further losses?   Since Paulson is the largest investor in the SPDR Gold Trust with an ownership position of 6.5%, liquidation of such a large position is almost certain to put additional downward pressure on the price of gold.

Maybe gold investors should hope that Paulson dumps his entire position in the SPDR Gold Trust.  Even brilliant investors like John Paulson can pull the trigger at exactly the wrong time.  After holding a massive position in both Bank of America and Citigroup for almost two years, Paulson liquidate his entire position in the stocks at the end of 2011 right before both stocks soared.  Since the end of 2011 Bank of America is up almost 300% and Citigroup is up around 100%.  Bottoms are made when the last seller capitulates.  Since gold is incredibly oversold at this point, a Paulson capitulation could be the trigger for an explosive move up in the SPDR Gold Trust.

gld

Courtesy yahoo finance

Will Silver Plunge Below $15 or Rally Back Over $50?

1881-CC-Morgan-DollarBy: GE Christenson

Silver prices peaked in April 2011 and dropped about 60% over the next 25 months. Sentiment by almost any measure is currently terrible. Few are interested in silver; most have lost money (on paper) if they bought in the last two and one half years, and the emotional pain seems considerable. It reminds me of the years after the NASDAQ crash in 2000.

So will silver drop under $15 or rally back above $50?

To help answer that question, I examined the chart of silver for the last 25 years and identified several long-term cycles. Then I constructed a spreadsheet that attempted to model the price of weekly silver based on those cycles and a few assumptions.

Assumptions

  • Use only long-term cycles – a year or longer.
  • The weight assigned to each cycle is approximately proportional to its length. A 200-week cycle should be approximately twice as heavily weighted as a 100-week cycle.
  • This is NOT a trading vehicle but a long-term indication of reasonable price projections based on past relationships. Those past relationships may or may not continue, even if they have been valid for over 20 years.
  • Keep it simple. Do not over-complicate the model or aggressively “curve-fit” it.
  • Prices are assumed to rise more slowly than they fall, so 62% of the cycle is related to the rising portion of the cycle, and 38% of the cycle is related to the falling portion of the cycle.

Data

Low-to-Low cycles: 65 weeks, 72 weeks, and 234 weeks
High-to-High cycles: 102 weeks
Exponential growth: 1/1/1990 – 6/30/2002: no growth – 0.0%/year
6/30/2002 – present: 21% per year, calculated weekly

Process

Find the beginning dates (lows) for the 65, 72, and 234 week cycles, and assign those beginning dates an index value of -1.0. Proportionally increase those index values from -1.0 to +1.0, and then reduce those index values from +1.0 to – 1.0, and repeat for each low-to-low cycle. Use the beginning index value on the 102-week high to high cycle as + 1.0. Extend the proportional increases on all time cycles from -1.0 to + 1.0 so that period takes 62% of the cycle length.

Assign each cycle a weight approximately proportional to the cycle length. Use a beginning value and calculate the exponential increase (0% or 21% per year) for each week, and then add or subtract the percentage changes for each weekly time cycle. Adjust the cycle index weights to obtain the best visual fit on a graph of actual silver prices versus the calculated price of silver.

What Could Go Wrong?

  • The exponential increase might not continue from 2013 forward. I doubt it, but it is possible.
  • The cycles, although relevant for over 20 years, might be less relevant from 2013 forward.
  • The calculated price was “curve-fit” to the actual prices, and that “curve-fit” result might be less accurate from 2013 forward.

Results

Statistical correlation over the last 20 years is about 0.95. The calculated silver price is generally consistent with the actual silver price, even though occasional large variations are clearly evident.

Click on image to enlarge.

Highlights

Calculated low: 2/4/05 at $4.96
Actual low: 5/7/04 at $5.60

Calculated high: 3/17/06 at $13.33
Actual high: 5/12/06 at $14.24

Calculated high: 5/4/07 at $18.13
Actual high: 3/14/08 at $20.66

Calculated low: 12/12/08 at $8.15
Actual low: 10/24/08 at $9.30

Calculated high: 3/2/12 at $42.98
Actual high: 4/29/11 at $48.59

Calculated low: 5/10/13 at $23.32
Actual low: 5/17/13 at $22.25 (actual weekly low, so far)

The Future

This simple model, which uses only four cycles and an exponential increase, indicates that a low in the silver price was expected approximately February – July 2013 and that the next high is expected approximately Mar – October 2014 in the $50 – $60 range. Further, the model suggests that a silver price of $90 – $110 is possible in the September 2015 – March 2016 time period.

Caveats!

There are many. This is not a prediction, it is simply a projection based on the entirely reasonable, but possibly incorrect, assumption that silver prices will continue to rise about 20% per year, on average, and that these four cycles will push actual prices well above and below that exponential growth trend.

Why will silver prices continue to increase? Our current monetary system depends upon an exponentially increasing debt and money supply. It seems likely that the US government will continue to run massive budget deficits and thereby increase total debt. In addition, the central banks of Japan, the EU, and the US will continue to monetize debt and increase the money supply to promote asset inflation and to overwhelm the deflationary forces in their respective economies. Silver supply increases slowly, the demand increases much more rapidly, while each Dollar, Euro, & Yen purchase less, on average, each year. It seems quite reasonable to expect that silver (and gold) prices will increase substantially from their current low level. Read: Silver – A Bipolar Roller Coaster.

Timing

The model was basically correct (over the last decade) on timing and price with some large variations. Clearly there are more factors driving the price of silver than four simple cycles. Those political, emotional, and economic factors will push the price higher or lower, sooner or later, than the model indicates. Regardless, it has some value indicating the approximate price and timing for long-term highs and lows in the price of silver.

Use it while appreciating its limitations. Read: Back To Basics: Gold, Silver, and the Economy.

GE Christenson
aka Deviant Investor

Gold and Silver Investors Need to Ask Themselves 10 Basic Questions

1933-double-eagle1Rick Rule listed 10 key questions regarding today’s economy. They are:

10 Questions for Precious Metals Investors

  • Is the financial crisis in the Western world over?
  • Have the G20 countries balanced their budget?
  • Did the commercial banks manage to become solvent?
  • Are (real) interest rates positive or negative?
  • Is a global competitive devaluation to increase exports still ongoing?
  • Is the European periphery still financially challenged?
  • Do the Asian countries still have a cultural affinity with precious metals?
  • Which are the US budgetary issues and solutions?
  • Are the derivatives from large banks still a problem for economies and client portfolios?
  • Can liquidity solve the issue of insolvency?

If these are the questions, then gold and silver are two good answers.

But, let’s approach these questions from a different direction.

  • Have gold or silver ever defaulted?
  • Do gold or silver have counter-party risk like EVERY paper investment?
  • On January 1, 2000 the Dow was about 11,500, gold was priced at $289, and silver was priced at $5.41. As of May 24, 2013, those numbers were: Dow: 15,303, gold $1,386, silver $22.49. Which was the best investment?
  • Gold fell (in 21 months) from over $1,900 to about $1,320. Does that mean the gold bull market is over? The Dow crashed from 14,100 (October 2007) to about 6,500 (March 2009), and then rallied back to new highs. Don’t exclude the possibility of new highs for gold and silver in the coming months.
  • Why are Chinese businesses, individuals, and their central bank buying gold as rapidly as possible? Why does the Chinese government refuse to allow any gold to be exported? Why does China (world’s largest gold producer) additionally import a massive amount of gold every year?
  • Ask the same for Russia, India, and much of Asia. What do they know about the VALUE of gold that the EU and the USA (who are selling gold) don’t understand?

Further:

  • Gold and silver have gone up and down, when priced in unbacked paper currencies. The same is true for trucks, diamonds, the Dow Index, laundry detergent, gasoline, cigarettes, and wheat. Price increases and volatility will continue.
  • Gold, silver, and the national debt have increased exponentially since Nixon severed the link between the dollar and gold in 1971. All three will continue to rise. Gold and silver will occasionally rally too far and crash, while the national debt will increase until politicians no longer enjoy spending other people’s money.
  • Goldman Sachs (and many others) have said gold is in a bubble. The same individuals and groups probably did not see the bubble in Internet stocks and housing. Do you trust them or the 3,000 years of history during which gold and silver have been real money and a store of value?
  • If JP Morgan (and others) can make huge profits using computers, complex mathematical algorithms, and High-Frequency-Trading, then they will. Often their trading temporarily drives the prices for gold and silver down. After the markets have been driven far enough down, the same trading process is used to drive the prices higher. Expect it!
  • Silver has dropped from about $49 (April 2011) to just above $20 (May 2013) – almost a 60% drop in price. Does that mean it will continue to drop more – perhaps to $10? Silver has retained its value, on average, for 3,000 years but has fallen in price for two years. On the basis of price action in those two years, most individuals (based on sentiment measures) have chosen to trust unbacked paper currencies issued by an insolvent central bank and an insolvent sovereign government instead of silver. This is typical of market bottoms, even if it is not sensible.
  • About 4.5 years ago (October 2008) silver crashed to a price bottom where “everybody felt” like it was hopeless to expect silver to rally again. About 4.5 years before that (May 2004), silver also crashed to a price bottom where “everybody felt” like it was hopeless to expect silver to rally again. But, in fact, the silver rally off the low in 2008 was over 450%, and the rally off the 2004 low was over 175%. Silver will rally again.
  • We may not trust bankers and politicians to effectively run the country, but we can trust them to “print money” and to spend in excess of their revenues. Consequently, we should trust them to drive the prices, as measured in unbacked paper currencies, for gold and silver – MUCH higher.

GE Christenson
aka Deviant Investor

Why All Governments Hate Gold

bars-of-goldMOTIVE: The various governments of the world and their central banks produce and distribute a product – paper currencies. Those currencies are backed by confidence, faith, and credit, but not by gold, oil, or anything real. Those currencies are digitally printed to excess, since almost all governments spend more than their revenues. The UK, Japan, and the USA are prime examples.

Politicians want to spend more money, but they also need to maintain the illusion that the money is still valuable, that it will retain most of its purchasing power over time, and that inflation is under control. The illusion weakens when food, gasoline prices, and other consumer goods are wildly rising in price. At a more abstract level, gold indicates the same lack of confidence in the printed pieces of paper that our central banks distribute.

Hence, central banks and governments have a strong motive to “manage” the inevitable price increases in gold. They have a motive to suppress the price and to allow it to rise gradually over time, while occasionally smashing it down and temporarily destroying confidence in gold as an alternative to unbacked paper currencies. The press helps by regularly claiming gold is in a “bubble.”

Yes, there is a clear and compelling motive.

MEANS: This brings up a heavily debated topic – do governments and central banks have the means to manage the price of gold? Ask yourself these questions:

  • Did banks manipulate rates in the LIBOR market?
  • Does the Federal Reserve (and other central banks) set (manage – manipulate) interest rates in the credit markets?
  • Do banks exercise considerable influence over regulators and Congress?
  • Are the various central banks of the world centers of power and wealth?
  • Do they use their wealth and power to achieve their policy objectives?
  • If the Fed can create and lend/loan/swap/give away over $16 Trillion dollars after the 2008 crisis, is it possible that some of that $16 Trillion was used to influence the gold market?
  • Did Greenspan, when he was Chairman of the Federal Reserve, make a statement in 1998 that central banks were ready to lease gold if the price of gold rose? Link is here.
  • If central banks lease gold to bullion banks and those banks SELL that gold into the market, would that have any influence on price?
  • Are central banks allowed to claim leased gold, which they no longer physically possess, as an asset on their balance sheet? (Lease it into the market but still claim they have it – this works until they run out of gold or the physical gold is audited.)

Yes, central banks and governments have the MEANS to suppress the price of gold.

OPPORTUNITY: As long as:

  • Governments spend more than their revenues
  • Central banks and governments control their gold in secrecy
  • Physical gold is not audited (last real audit of the USA gold was about 60 years ago)
  • Gold can be leased out while being listed as owned,

then there is opportunity.

Further, if a few billion dollars can be created and then used by a futures trader, and that trader sells (naked shorts) a large number of gold contracts on the futures exchange, that will drive the gold price down rapidly. Look at the chart of gold prices for April 11 – April 16 and ask yourself if that looks like a managed market.

Yes, central banks and governments have the OPPORTUNITY to suppress the price of gold.

But there is more to the story!

Central banks and governments have, to one degree or another, the motive, means, and opportunity to manage the price of gold. Clearly, their bias is to hold the price of gold low and to restrict its upward movement. Similarly, they want bond and stock markets to move higher, but that is another story.

YOU have motive, means, and opportunity to protect yourself and to profit from this process.

You know that unbacked paper currencies are declining in purchasing power. The path is erratic but clearly lower over the last four decades. You want to protect your purchasing power – you have a MOTIVE to own gold instead of owning devaluing currencies that pay next to nothing in interest.

You probably have paper dollars that are “invested” in stocks, bonds, IRAs, and other savings. You have the MEANS to protect yourself. Sell some paper and buy gold. The Chinese and Russians are doing it as rapidly as they can. What do they see that you might not fully understand?

You have the OPPORTUNITY to buy gold and silver at a huge discount to their real value – just my opinion – but both are “on sale” at current prices. (Gold is currently priced about the same as in late 2010.) “But can’t they go lower?” Yes, of course, gold could drop to $1,000, the Middle East could be transformed into a region of tranquility, peace, and cooperative people, and the US Congress could balance the budget. But as long as governments and central banks are “pushing paper,” digitally printing unbacked currencies, and overspending their revenues, the price of gold will increase – just my opinion – to much higher than it is today.

Gold and silver are in long-term bull markets. One of the objects of a bull market is to arrive at the peak with very few long-term participants. The “bull” wants to buck you off periodically. It usually happens. Basic human nature – fear and greed – makes it difficult to ride the bull most of the way up and exit at the proper time. Fortunately for gold and silver bulls, there are many more years of deficit spending and increasing debt that will push metals prices much higher.

Read from the DI: Why Buy Gold?

GE Christenson
aka Deviant Investor

How To Buy Physical Silver With A Zero Chance Of Loss

silverAnything that sound too good to be true, well, you know how that ends.

But there actually is a way to purchase physical silver with a zero chance of loss, courtesy of the Royal Canadian Mint (RCM).

For the first time ever, the RCM is offering a coin with a face value of $100 at a price of $100.  Here are the details courtesy of the mintnewsblog.

Following the success of their “$20 for $20″ silver coin program, the Royal Canadian Mint has launched a new series which uses the same concept for a larger face value.

Orders are now being accepted for the first “$100 for $100″ silver coin, which is the initial release for the Wildlife in Motion series. The RCM indicates this is the first time in history that $100 can buy a coin worth $100.

Buffalo $100 Silver Coin

The reverse of the coin designed by Claudio D’Angelo features three members of a herd of stampeding bison racing across the grassy prairie. The bison are pictured in profile, illustrating the movement and momentum of the massive creatures. The background shows foothills which are backed by a jagged mountain with clouds above. The inscriptions read “Canada 2013″ and the legal tender face value of “$100 Dollars”.

The obverse of the coin features the portrait of Queen Elizabeth II designed by Susanna Blunt.

The 2013 $100 for $100 Bison Silver Coin is struck in 99.99% pure silver with a weight of 31.6 grams (1.016 troy ounces) and diameter of 40 mm. The maximum mintage is limited to 50,000 pieces with a limit of three coins per household.

These coins are available for sale priced at their face value of $100 CAD. The product page can be found here.

This is about as close to a sure thing as you can find in life.  The coin will always have a value of $100. If silver prices increase to $200 per ounce, the coin would be worth about $200 based on the silver content of 1.016 troy ounce.

Will the Fed’s “Grand Experiment” To Reignite The Economy With Unprecedented Monetary Accomodation Result in Economic Chaos?

Purchasing Power of U.S. DollarRichard W. Fisher, president and CEO of the Federal Reserve Bank of Dallas gave a very interesting speech today, acknowledging that the Federal Reserve policy’s are experimental.  No one, including the Federal Reserve, knows how this unprecedented monetary accommodation will affect the economy and the value of the dollar.

Fortunately, there is a defense to the Fed’s schemes to inflate the economy and debase the dollar.  That defense is known as gold – the only store of wealth which cannot be inflated away by profligate governments.

This is a long and rather dense speech, but well worth the read to understand just how tenuous our current economic situation is.

Current Predicament of Monetary Policy: A Grand Experiment

I’ll begin with a summary of the current predicament of monetary policy.

The Federal Reserve has undertaken a grand experiment to reignite the economy through unprecedented monetary accommodation. We cut to zero the base rate that anchors the yield curve and have pursued a policy aimed at driving rates throughout the curve to historic lows by buying Treasuries and mortgage-backed securities (MBS). Our portfolio totals about $3 trillion, which we have recently been expanding at a rate of $85 billion per month.

Here is a picture of the domestic securities of the current System Open Market Account (SOMA) portfolio. [1]


The sea change in the balance sheet in recent years is immediately visible: In sharp contrast to the past, we now hold almost no Treasury notes of less than three years’ duration—the dark blue space. We have purchased in the secondary markets some $1.7 trillion in longer-term Treasuries—the light blue area—and, as denoted by the green, more than $1.1 trillion of securities backed by the Federal National Mortgage Association (commonly known as Fannie Mae), the Federal Home Loan Mortgage Corp. (Freddie Mac) and the Government National Mortgage Association (Ginnie Mae). We live in an age of big numbers when I can say, “Ignore the purple space, for it is only $70 billion in remaining Fannie and Freddie debentures, aka ‘agency debt.’” Before the crisis, when we didn’t have any agency debt, $70 billion would have represented 8 percent of our balance sheet.

As to the duration of these purchases, here is a picture from year-end 2012:


Including securities purchased since then, the total SOMA portfolio has an average duration of seven years, with Treasury securities at eight years and MBS having risen to four years.

According to dealers’ forecasts at year-end and as of March, the probability distribution of the expected size of the SOMA portfolio is as follows:

So, you now have a snapshot of where we are. The Federal Open Market Committee (FOMC) has cut the short-term rate to zero. Being “zero bound,” we instructed our traders to embark on a buying spree of Treasuries and MBS, and they have done so, ballooning our balance sheet from its precrisis level of less than $900 billion to about $3.3 trillion. Presently, the committee is adding to its holdings at a rate of $85 billion in longer-term securities each month, in addition to reinvesting principal payments from holdings of agency MBS and agency debt securities into agency MBS. And the predominant sentiment of the “market,” as measured by our dealer surveys, presently posits that we will build our holdings further, to between $3.5 trillion and possibly $5 trillion by the end of 2014.

The Economy’s Dashboard

As to the status of the economy, here is the dashboard our Research Director (and former NABE President) Harvey Rosenblum uses as a simple graphic to describe the current economic predicament:

You will note that the data compiled at the end of the first quarter on real gross domestic product (GDP) growth and inflation—as measured by the Trimmed Mean Personal Consumption Expenditure (PCE) Index, the Dallas Fed’s preferred indicator—show that both increased less than 2 percent year over year. The dashboard also indicates that at quarter’s end, we were cruising along at near stall speed—note the “Engine stall” red warning light. The unemployment-rate gauge is not red because it declined to 7.5 percent in April. And, as indicated by the odometer box, we have traveled some distance in job creation, even though we have not seen the job creation we might have hoped for in a typical recovery: 70.4 percent of jobs lost in the recent recession have been recovered, up from about 50 percent only a year ago. The indicator for the yield curve, if anything, is robust. Junk-bond spreads are below 5 percent; nominal yields for even the lowest-grade bonds (CCC-rated credit that is one notch above default) have fallen to below 7 percent from double digits only a year ago. Further, covenant-light lending is on a tear. The “oil gauge” indicates the Fed has supplied plenty of lubrication for the engine of job creation.

Professional Forecasters Have Been Disappointed Thus Far…

Over the four years since the recession ended in June 2009, GDP growth has averaged just 2.1 percent, hewing to a narrow year-over-year range of 1.5 to 2.8 percent. It is noteworthy that the fraternity of professional economic forecasters has been consistently disappointed: Forecasts made at the beginning of 2010, 2011 and 2012 all overpredicted growth. At the onset of this year, the median forecast for 2013 called for 2.4 percent GDP growth, and that, too, has been challenged by first-quarter data that came in below expectations, raising fears of “déjà vu all over again.”

…But April Could Signal Improvement

However, the April jobs report and revisions of previous jobs data have put some spring back in economists’ steps. Initial claims for unemployment insurance are now back on a downward trend, retreating to prerecession levels, and Monday’s retail sales numbers were a nice upside surprise. This indicates that consumers may have digested delayed tax rebates and the increase in payroll taxes, and are reaping the benefits of lower gasoline and food prices. So the recovery presently appears to be strong enough to propel hopes that employment growth will continue improving over the near term.

As to Inflation…

Of course, the Fed’s most sacred duty is to see to the maintenance of price stability. Today, inflation is benign. With a jobless rate still well north of 7 percent, labor compensation rising at less than 2 percent per year, an outlook for abundant food crops and expanding energy sources, and near-record profit margins among operating businesses, there appears to be little risk that we will see significant cost-push pressures in 2013. In addition, slower growth around the globe is putting the damper on demand-pull inflation. Provided that the public remains confident in the Fed’s commitment to long-run price stability, anchored by the FOMC’s stated commitment to a target of 2 percent, my reading of the entrails of the Trimmed Mean PCE inflation rate currently indicates we will likely end this year somewhere between 1.5 percent and our 2 percent long-run goal. [2]

As a hawk in the aviary of policymakers, I have for some years now said that the issue at present is not a meaningful threat to price stability in the immediate future. The issue is job creation. And the questions I keep raising at FOMC meetings regard our ability to affect it.

Time to Reset the Fed’s Sails?

Having spent the happiest of my formative years preparing for and attending the U.S. Naval Academy, then paying my way through Harvard sailing oceangoing yachts as a hired hand, I am given to seafaring analogies. Here is how I would summarize our most recent journey:

The current chairman, Ben Bernanke, took the wheel at the Fed just as we sailed into a tempest that nearly capsized our economy. He and his able crew kept the ship of the economy from floundering and navigated it past the rocks of depression and deflation. The Bernanke-led FOMC steered clear of the shoals of economic collapse by jury-rigging the vessel of monetary policy in an unconventional and unprecedented manner. Now the ship of the Fed is in more benign waters and is sailing forward. The question before us is this: Are we moving forward at sufficient speed to allow the Fed to reset our rigging and our sails, eventually going back to a more conventional configuration?

The answer lies in the economic outlook. I am wary of giving pinpoint forecasts of economic growth. As I mentioned earlier, professional forecasters, including the very capable staff of the Federal Reserve, have fallen short on this front, time and again, during the recovery and on numerous occasions before that. I am always mindful of the memorable comments of Ken Arrow. You may recall them:

During World War II, Arrow served as a weather officer in the Army Air Corps. He and his team were charged with producing month-ahead weather forecasts. Being a disciplined analyst, Arrow reviewed the record of his predictions and, sure enough, confirmed statistically that the corps’ forecasts were no more accurate than random rolls of dice. He asked to be relieved of this futile duty. Arrow’s recollection of the response from on high was priceless: “The commanding general is well aware that the forecasts are no good. However, he needs them for planning purposes.”

With that caveat in mind, my staff and I think there is a better-than-even chance that the present GDP growth consensus forecast of 2.4 percent by professional economists may be underestimating the underlying pace of growth. The housing market is in resurgence, contributing significant impetus to the economy. The Fed’s senior loan officer surveys indicate that commercial banks are becoming more accommodative lenders, albeit remaining cautious. [3] The snapback in housing and the harnessing of cheap and abundant money by the business sector have made for more manageable financial obligations. State and local governments, not just in Texas but elsewhere in the nation, are on a better financial footing and no longer appear to be a major drag on growth. As this audience knows better than anybody, new technologies are providing for cheaper and more abundant energy. Consumers continue consuming. Monetary policy is hyper-accommodative, driving interest rates to historic lows and equity markets to historic highs; if anything, it may be giving rise to excessive speculation and risk taking. (In addition to the pricing of CCC debt and the surge in low-covenant lending, margin debt is climbing rapidly.)

I have advocated that we begin to reef in the sails, beginning with our MBS purchase program. In my view, the housing market is on a self-sustaining path and does not need the same impetus we have been giving it. In recent months, under its balance-sheet expansion program, the Fed has bought about 50 percent of gross issuance of agency MBS, partly to replace prepayments of our MBS holdings. When refinancing activity eventually shifts down, the Fed could soon be buying up to 100 percent of MBS issuance if the current purchase program continues. I believe buying such a high share of gross issuance in any security is not only excessive, but also potentially disruptive to the proper functioning of the MBS market. I have never been comfortable with our investing in anything but Treasuries, being wary of a central bank engaging in credit allocation and favoring specific sectors of the economy. It brings to mind the fears Thomas Jefferson and James Madison had about the slippery slope of Alexander Hamilton’s First Bank of the United States, recently recalled in Jon Meacham’s brilliant book on Jefferson: “They feared that the Hamiltonian program would enable financial speculators to benefit from commercial transactions made possible by government funds.”[4]

Yet I admit that given the crucial role housing plays in our economy and the dire straits the housing market was in at the time, I did hold my nose and vote for the first tranche of MBS purchases. I believe that initiative was helpful in jump-starting the housing market. But now I believe the efficacy of continued purchases is questionable. And I consider holding $1.1 trillion and counting of MBS as a possible impairment to our ability to maneuver our balance sheet with the nimbleness and alacrity we might need. I think we can rightly declare victory on the housing front and reef in (or dial back) our purchases, with the aim of eliminating them entirely as the year wears on.

Enter Fiscal Policy. Oy!

Even if we at the Dallas Fed are right and the overall outlook for the economy is better than the current dashboard or the conventional prognostications of economists, there exists a formidable brake on growth. It was referred to point-blank in the last statement issued by the FOMC: “…fiscal policy is restraining economic growth.”[5]

Fiscal policy is inhibiting the transmission of monetary policy into robust job creation.

As it is early in the morning and a little levity is always helpful in making a point, here is my favorite spoof on the historical behavior of fiscal policy makers:

This would be funny if it were not so sad. The propensity of members of Congress has been to spend in excess of revenues to give pleasure to their constituents and garner their affection. They just didn’t get the memo that Jefferson wrote to Madison:“We are ruined, Sir, if we do not overrule the principles that ‘the more we owe, the more prosperous we shall be,’ [and] ‘that a public debt furnishes the means of enterprise.’” [6] The good news is that, some 200-plus years later, the memo seems to have finally been received; there are numerous plans to rein in Congress’ spendthrift ways and there have been improvements that have brightened the short-term outlook for the level of federal debt. [7] But, as yet, there has been little more than passive action. Until the Congress and the president provide a clear road map as to how fiscal rectitude will be implemented, this lack of credible details for limiting the debt-to-GDP ratio and reengineering fiscal policy to stimulate rather than constrain growth is creating undue uncertainty about future tax rates, future government purchases, future retiree benefits and all manner of factors that impact employment and economic growth. Meanwhile, the divisive nature and petty posturing of those who must determine the fiscal path of the nation is further undermining confidence and limiting the effectiveness of monetary policy.

Here is the rub: Even if the arguments of those who wish for greater fiscal stimulus prevail, expansion in government purchases will have reduced effectiveness if it is thought that those purchases will be financed with higher future marginal tax rates. If you are an operating business, you have to discount this risk before adding significantly to payrolls and before undertaking capital expansion. In a similar vein, you need to consider how the opposite approach of cutting government expenditures might impact your top line if the cuts are in areas that affect the markets you sell into. Add to that the enormous uncertainty about how health care reform will impact your cost structure. And add to that the fact that community bankers—providers of the lifeblood of loans to small businesses, which are the impetus for new job creation and economic rejuvenation—are hamstrung by burdensome regulations and fees imposed in response to the misbehavior of their too-big-to-fail brethren. If you consider the economy from this perspective, you can see where brakes of our own government’s making are being applied to a realization of our growth potential.

Decisionmaking under conditions of uncertainty is always a challenge for businesses; decisionmaking in a thick fog of uncertainty is well-nigh impossible. It negates the power of hyper-accommodative monetary policy to propel our economic vessel forward. The restraining influence of rudderless fiscal policy is readily seen in the piling up of excess reserves on the balance sheets of banks and in the coffers of operating businesses.

I argue that the Fed has no hope of moving the economy to full employment unless our fiscal authorities get their act together. Those economic agents with the wherewithal to expand payrolls and put the American people back to work must have confidence that our fiscal authorities and regulation makers—the legislative and the executive—will reorganize the tax code, spending habits and the regulatory regime so that the cheap and abundant money we at the Fed have made available to invest in job-creating capital expansion in the United States is put to use. Until then, I argue that the Fed is, at best, pushing on a string and, at worst, building up kindling for a massive shipboard fire of eventual inflation.

All the World’s a Stage (and All the Policymakers Merely Players)

It is thus as-yet unclear whether the benefits of the strategy the Fed has taken outweigh its costs. Only time will tell. The Federal Open Market Committee will have to wait for the verdict of history. Scholars know that Shakespearian plays all have five acts. I would suggest that we are but in the third act of a play—we had the tempest in Act 1; the jury-rigging of monetary policy and radical maneuvers by the Fed to save the ship in Act 2; and in the present act, we are back on course but somewhat becalmed, sailing at less-than-desired cruising speed even as we have cranked up an auxiliary motor of large-scale asset purchases. Act 4 will involve the travails and challenges of adjusting our policy course, fine-tuning the motor and rearranging the rigging. And not until the final act will we know whether we have achieved the felicitous outcome that is the hallmark of most romantic plays, or whether the melancholy that defines a tragedy awaits us.

The romantic outcome ends, as most all Shakespearian comedies do, in a marriage—in this case, a marriage of sensible fiscal and monetary policy that lifts employment and carries the American economy to new heights.

The tragic outcome is one in which the fiscal authorities—the Congress and the president—are unable to provide incentives for risk takers to make use of the cheap and abundant capital the Fed has made available, and the play ends in a debasement of the central bank and the ruination of our economy and lifestyle.

The former outcome is that envisioned by the theoreticians that lead the Fed: According to this plot, by driving rates to historical lows along the entire length of the yield curve, investors will rebalance their portfolios and reach out to riskier assets, providing the financial wherewithal for businesses to increase capital expenditures and reengage workers, expand payrolls and regenerate consumption. Rising prices of bonds, stocks and other financial instruments will bolster consumer confidence. The CliffsNotes account of this play has the widely heralded “wealth effect” paving the way for economic expansion, thus saving the day.

The latter outcome posits that the wealth effect is limited, for two possible reasons. One is that our continued purchases of Treasuries are having decreasing effects on private borrowing costs, given how low long-term Treasury rates already are. Another is that the uncertainty resulting from fiscal tomfoolery is a serious obstacle to restoring full employment. Until job creators are properly incentivized by fiscal and regulatory policy to harness the cheap and abundant money we at the Fed have engineered, these funds will predominantly benefit those with the means to speculate, tilling the fields of finance for returns that are enabled by historically low rates but do not readily result in job expansion. Cheap capital inures to the benefit of the Warren Buffetts, who can discount lower hurdle rates to achieve their investors’ expectations, accumulating holdings without necessarily expanding employment or the wealth of the overall economy.

I hold no vendetta against the Buffetts of the world, having once been a junior member of that class—I made a nice living during the 1980s and ’90s buying operating assets for nickels and dimes and turning them into dollars by rationalizing and downsizing them. And like legions of others, I have for countless years read the Oracle of Omaha’s annual statement with admiration for his prowess as an investor and profit-seeker. But my role as a policymaker is different from my previous role as an investor: I have sworn fealty to a dual mandate of conducting monetary policy so as to maintain price stability AND create the monetary conditions for full employment and prosperity for all, not just for the rich and the quick. This, I fear, we will fail to do unless Congress and the president develop and deliver on a strategy that complements ours at the Fed.

This may be a sour ending to a somber song, but, after all, economics is not called “the dismal science” for nothing. Have a nice day!

Now, in the best tradition of central bankers, I would be happy to avoid answering your questions.

The Bull Market In Gold Is Dead

Gold coinsApril was a brutal month for precious metal investors.  Gold ended the month down almost 8% and silver prices tumbled almost 13%.   The sell off continued in May with gold down another $60 per ounce to $1,412 and silver down $1.55 to $22.87 per ounce at mid month.

With investors already nervous, two mainstream news organizations today did the equivalent of yelling fire in a theater crowded with gold and silver investors.

Both Bloomberg and The Wall Street Journal published extremely bearish articles on gold which essentially proclaimed the death of the gold bull market.

“Gold is going to get crushed”

Gold will trade at $1,100 an ounce in a year and below $1,000 in five years, according to Ric Deverell, head of commodities research at the bank. Lower prices are unlikely to lure more central-bank buying, said Deverell, who worked at the Reserve Bank of Australia for 10 years before joining Credit Suisse in 2010.

“Gold is going to get crushed,” Deverell told reporters in London today. “The need to buy gold for wealth preservation fell down and the probability of inflation on a one- to three-year horizon is significantly diminished.”

Investors are losing faith in the world’s traditional store of value even as central banks continue to print money on an unprecedented scale. Bullion slumped into the bear market last month after a 12-year bull market that saw prices rise as much as sevenfold. Gold is a “wounded bull,” Credit Suisse said in a Jan. 3 report.

“When gold is going up, it looks like a great idea to buy more gold,” Deverell said. “And when it’s going down, do you really think risk-averse central bankers are going to try and catch the knife? No.”

A surge in demand for bars, coins and jewelry following gold’s drop to a two-year low in April is temporary, Deverell said. The U.S. Mint said April 23 it ran out of its smallest gold coins and Australia’s Perth Mint said volumes jumped to a five-year high. India’s bullion imports may surge 47 percent to 225 tons in the second quarter to meet consumer buying, according to the All India Gems & Jewelery Trade Federation.

“This is bargain-buying,” Deverell said. “It’s like when you have cash for clunkers in autos, you bring forward activity, but it’s not a massive addition to buying.’

Courtesy: kitco.com

Courtesy: kitco.com

“The bears are mauling gold”

The metal fell for a sixth consecutive trading session on Thursday, as investors continue to flee toward assets that promise higher returns.

The characteristics beloved of “gold bugs,” the sizable army of large and small investors who swear by the metal, are precisely what bears are feasting on. Unlike most other assets, gold doesn’t offer a steady return, or yield, and it is often seen as protection against inflation or currency devaluations.

At present, however, global economic growth is sluggish, interest rates in many developed countries are at or near record lows, and investors of all stripes are scrambling to find higher-yielding assets.

“There’s basically no inflation, equities are taking off, and we’ve got a strong dollar,” said Fain Shaffer, president of Infinity Trading Corp. in Medford, Ore. “All of those are just eroding away the investment value of precious metals.” Mr. Shaffer this week recommended his clients bet on lower gold prices.

On Thursday, bears seized on a World Gold Council report showing that total demand for gold fell 13% in the first quarter, to a three-year low of 963 tons in the period.

Other investors are taking the opposite view. John Workman, chief investment strategist with Convergent Wealth Advisors, said the firm late last year recommended that clients trim their gold holdings by about 25%. He cited gold prices that have stagnated despite more stimulus from the Federal Reserve in the form of asset purchases, the same money printing that galvanized gold bugs after the financial crisis. Falling prices were a signal that many investors just weren’t concerned anymore that the stimulus measures would stoke inflation and weaken the dollar.

To sum things up –

  • it no longer matters that central banks everywhere are printing money on an unimaginable scale,
  • the world economy is doing fine and will continue to improve,
  • gold, used as a currency and safe haven for 5,000 years, is inferior to fiat paper currency,
  • returns are better in stocks and bonds,
  • monetary stimulus via central bank asset purchases will propel the world into sustained economic growth,
  • there is no inflation and
  • investors want assets with yields.

Price fluctuations may not make much sense in the short term, but long term precious metal investors know where things are headed – see Why I Will Always Own Gold.

Why I Will Always Own Gold and Silver

What I Know for Certain –  By:  GE Christenson

gold-dollar

      • Death and taxes!
      • Fear and greed are powerful motivators.
      • Individuals, businesses, and governments do what they think is beneficial for them.
      • Businesses and governments protect their products and territory and resist competition and enemies.
      • Concentrated wealth creates power and corruption. The greater the concentration of wealth, the larger and more pervasive the power and corruption.
      • Gold and silver have been money for over 3,000 years.
      • Unbacked paper money systems have always failed.

What I Think is True

      • The basic product of a central bank is the unbacked paper currency it prints in ever-increasing quantities.
      • Central banks will fight all competitors to their currencies. The oldest competitor to unbacked paper currencies is gold, ancient money.
      • Politicians want to spend money and increase their power.
      • Bankers want to create money, lend it to governments, and thereby secure a permanent and increasing revenue stream.

What I Think the Consequences Are

      • Bankers use their wealth to “influence” politicians. Politicians respond with favorable legislation. It has worked for centuries.
      • Central banks want an expanding money supply and ever-increasing debt. The consequence is that consumer prices inevitably increase.
      • A currency collapse is like a bank run – everyone scrambles to remove his/her wealth from the currency (or the bank) due to a loss of confidence. In fractional reserve banking systems, bank runs are inevitable. Even though they may last for many decades, unbacked paper currencies inevitably devalue and eventually collapse.
      • Bank runs and currency collapses are feared by bankers and politicians; they do what they can to support confidence in their products and to squash their competitors.

In the United States

      • Debt and government spending seem likely to increase until a crash-reset occurs.
      • The crash-reset will involve a dollar collapse.
      • Gold and silver will eventually reach much higher prices due to the loss of value and confidence in the dollar, the banking system, and the sustainability of the current financial system.
      • “Paper gold” will be seen for what it is – a promise that might not be paid.
      • Physical gold will be seen for what it is – real wealth.
      • The USA and Europe are sending their real wealth – gold – to China, India, Russia, and the Middle East. China, India, and Russia are buying aggressively and know that exchanging paper dollars and euros for gold will strengthen their economies and governments tomorrow.
      • It is openly speculated that much of the sovereign government and central bank gold supposedly owned by the USA and Europe is either gone, leased, or otherwise committed.

Read: The Crash Before the Climb

Accept what you cannot change and act based on facts, not our current financial and economic fictions. Protect your financial well-being with physical gold and silver safely stored in a secure location.

GE Christenson
aka Deviant Investor

Gold Demand Drops By 13% In First Quarter Due to ETF Outflows

tenth oz gold-eagles
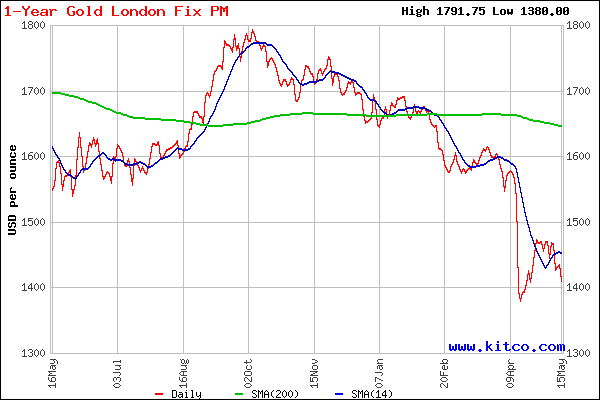
Large scale liquidation of gold backed exchange-traded products (ETP) sent gold prices into a tailspin during April.  Billionaire investor George Soros, who had sold 55% of his holdings in the SPDR Gold Shares (GLD) during the last quarter of 2012, further reduced his gold positions during the first quarter.  Soros is a legendary trader and investor who has made billions moving ahead of the crowd.

In an interview published by the South China Morning Post on April 8, Soros said that gold was no longer a safe haven after the metal failed to rally last year despite fears of a euro collapse.  Shortly after Soros made his comments, other investors  began to sell and within days gold had tumbled by $200 per ounce.  Northern Trust Corp and BlackRock Inc also made large cuts in their holdings of ETPs, while John Paulson lost about $165 million by maintaining his stake in the GLD.

According to Bloomberg, assets held by ETPs declined in value by $42 billion as gold prices tumbled.

Global ETP holdings have tumbled 16 percent in 2013 after rising every year since the first product was listed in 2003, according to data compiled by Bloomberg. Assets in SPDR have plunged 22 percent, and they will probably drop by an additional 2 million to 4 million ounces after slumping 9.7 million ounces since mid-December, Deutsche Bank AG said in a report on May 14.

Further Drop

While the selloff has been faster than expected, a further drop in ETP holdings will probably mean more price declines, Goldman Sachs Group Inc. analysts including Jeffrey Currie wrote in a report dated May 14.

Northern Trust cut its SPDR stake by 57 percent to 6.9 million shares, according to a filing dated May 1. The asset-management company, as a custodian, holds assets without discretion over how they are invested, Doug Holt, the head of global corporate communications, said yesterday in an e-mail.

“We made one change to our global tactical asset allocation policy this month: eliminating our tactical position in gold,” Jim McDonald, chief investment strategist in Chicago at Northern Trust, which oversees about $810 billion, said in a report on March 13.

BlackRock, the world’s biggest money manager, trimmed its holdings by half to 4.1 million shares, a filing dated April 12 showed. On May 9, Robert Kapito, president of the New York-based company, said that he would still buy the metal.

The large scale liquidation of gold exchange traded funds was confirmed today in the latest quarterly demand and supply statistics published by the World Gold Council.  Overall gold demand for the first quarter declined by a considerable 13% with outflows from gold ETFs accounting for the bulk of the decline.  During the first quarter there were outflows of 177 tonnes from global gold ETF holdings.

The sale by large speculators of the gold ETPs seem to be the trigger that set off last month’s decline in gold prices.  The drop in gold could turn out to be a temporary factor as other buyers eagerly absorb supply by adding to their gold holdings at lower prices.

Aside from the sale of gold by holders of exchange traded products, demand for gold in the first quarter remained robust.  The World Gold Council noted that almost every other category of gold demand increased even as supplies are being constrained by lower mine output.

  • Mine production of 1,052 tonnes during the first quarter showed no growth and supply from scrap gold declined due to the drop in gold prices.
  • Jewelry demand surpassed the previous quarter and hit a new record with sales of $28.9 billion.
  • Demand from India and China, who collectively consume 62% of global gold jewelry sales, increased by 15% and 19% respectively.
  • Physical bar and coin demand during the first quarter increased by 8% and 18% respectively.  Demand for gold bar and coins in China exploded to 110 tonnes, double the average of the last five year quarterly sales.
  • Central banks added 109 tonnes of gold to their reserves in the first quarter, accounting for 11% of total gold demand.  Central banks have increased their purchases of gold for nine consecutive quarters.

Wholesale liquidation of gold positions by very large and wealthy speculators adversely impacted gold prices this year.  As gold demand from virtually every other sector continues to grow, the increased gold outflows from ETFs will eventually be absorbed.  In addition, as central banks continue to print money on an unprecedented scale, it would not be surprising to see large investors once again pour money into the gold ETFs.