March 19, 2024

The Price Correlation Between Silver and Crude Oil

1881-CC-Morgan-DollarBy: GE Christenson

Crude Oil bottomed (weekly data) about 12/25/1998 at $10.75. It rose erratically for several years, hit another low on 8/24/2007 at $68.70, and then rallied dramatically to an all-time high of $147.20 on 7/11/2008. Subsequently, crude collapsed to $35.35 on 12/26/2008.
High to Low Ratio: 147.20 / 10.75 = 13.69
Total time: 12/25/98 to 7/11/08 = 9.55 years
Final blow-off Ratio: 147.20 / 68.70 = 2.14
Time for Blow-off: 8/24/07 to 7/11/08 = 0.88 years
Collapse Ratio: 35.35 / 147.20 = 0.24
Collapse time: 7/11/2008 to 12/26/2008 = 0.46 years

Silver bottomed (weekly data) about 11/23/2001 at $4.01. It rose erratically for several years, hit another low on 2/5/10 at $14.78, and then rallied dramatically to a nearly all-time high of $48.58 on 4/29/2011. Subsequently, silver collapsed to $18.53 on 6/28/2013.
High to Low Ratio: 48.58 / 4.01 = 12.11
Total time: 11/23/01 to 4/29/11 = 9.44 years
Final blow-off Ratio: 48.58 / 14.78 = 3.29
Time for Blow-off: 2/05/10 to 4/29/11 = 1.23 years
Collapse Ratio: 18.53 / 48.58 = 0.38
Collapse time: 4/29/11 to 6/28/13 = 2.17 years

So What?

Both crude and silver took about 9.5 years to rally from a significant low to an important high. The high to low ratios were similar – over 13 and over 12. Both collapsed after their blow-off highs and fell 76% and 62% from their highs. Crude rallied during the next four years and is now over triple its crash low. Silver, a much smaller and more volatile market, seems likely to do something even more dramatic.

Questions

Assume market prices for crude oil are based on supply and demand of physical crude oil. Do you think supply and demand for physical crude oil changed sufficiently between the crude low in August of 2007 to the high in July 2008 to the low in December 2008 to justify a rise from $68.70 to $147.20 and then a fall to $35.35?

Answer one: Obviously it did; the market price changed and the market price is always correct.

Answer two: Perhaps politics, High Frequency Trading (HFT), and derivatives also affected the supply and demand of paper contracts for crude such that the price of crude more than doubled and then collapsed by 76% in about 1.3 years.

You choose the best answer.

Assume market prices for silver are based on supply and demand. Do you think supply and demand for physical silver metal changed sufficiently between the silver low in February 2010 to the high in August 2011 to the low in June 2013 to justify a rise from $14.78 to $48.55 and then a fall to $18.53?

Answer one: Obviously it did; the market price changed and the market price is always correct.

Answer two: Perhaps politics, High Frequency Trading, and derivatives also affected the supply and demand of paper contracts for silver such that the price of silver more than tripled and then collapsed by 62% in about 3.4 years.

You choose the best answer.

Why Discuss This Parallel?

Sentiment for silver and gold was (June 2013) exceptionally low – at multi-year or multi-decade lows depending on who is measuring sentiment. As of the end of June 2013 there seemed to be “no light at the end of the tunnel” for silver bulls and there was no joy in “silver-ville.” Most people I know wanted nothing to do with silver or gold.

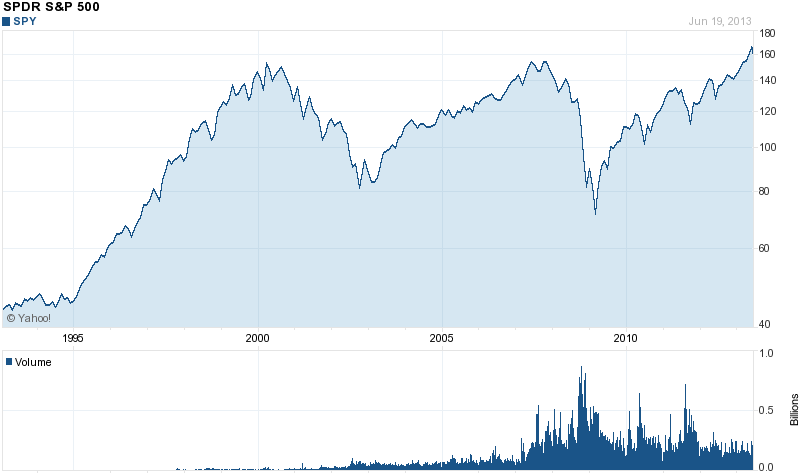
It was about the same with the crash low in crude 4.5 years ago in December of 2008 and the S&P500 crash low in early 2009. But the world economies demanded crude oil while the supply was flat or declining. Consequently the price rallied back to over $105 this month – about triple its collapse low price.

I think it is quite reasonable to expect that silver will also rally substantially from here. In fact an explosive rally would not be surprising. What seems likely is a multi-year rally (that culminates in another price blow-off) to four or six (or ten) times the low price in June, the inevitable price collapse, and then some months or years in a trading range at prices that make sub-$20 silver look like an absolute bargain. I suppose that if the US congress balances the budget AND world peace is confirmed, then silver prices are unlikely to rally… but I would rather bet on higher silver prices.

How are crude oil and silver similar?

Both had a nine plus year rally to a blow-off peak, collapsed, and rose again. Crude began its rally about three years before silver, and peaked about three years earlier. Both are essential for modern economies and their prices on the paper exchanges are heavily influenced by politics, HFT, and derivatives. The supply of crude is probably declining and the supply of silver is growing quite slowly. The world-wide demand for crude is likely to increase, even with slowly growing economies. The world-wide demand for silver is likely (my opinion) to dramatically increase due to increasing industrial demand and potentially explosive investor demand. There is good reason and good historical precedent to expect the price for both commodities to increase substantially, with great volatility.

Do you remember when crude was priced under $5.00 per barrel and silver was priced under $2.00? Given the penchant for governments around the world to run huge deficits, amass unpayable debt, and increase the money supply (monetize bonds) in seemingly unlimited quantities, do you think either $250 crude or $100 silver is unlikely in the next several years?

Neither do I!

We will see $250 crude, $10 gasoline, and $100 silver, unless the world’s economies and governments become responsible and accountable.

Have you purchased your Silver Eagles today?

Read: Silver – Keep It Simple
Read: Gains In Silver Will Be Historic

GE Christenson
aka Deviant Investor

Silver Market Incredibly Oversold – Technicals Flashing Buy Signal

silverBy: GE Christenson

For the umpteenth time (actually the 3rd since June 2012), silver has given a buy signal according to my reading of the technical indicators.

Problem: How valuable is technical analysis (moving averages, oscillators, over-sold conditions, etc.) when the silver and gold markets are dominated by computers (High Frequency Trading – HFT) and not human beings?

GATA had this to say: “Technical analysis of a manipulated market like gold has been tedious nonsense for years, but these days, with virtually infinite paper dropped on the gold futures market at illiquid times to drive the price down even as the physical market remains strong, technical analysis has become insulting.

The only analysis worth anything anymore is the identification of the source of all the paper.

The suspects are obvious — Western central banks.”

Gold and silver bottomed in June of 2012, dollar printing moved into high-gear, and the metals “should” have rallied from there. Instead, they did a brief rally and fell to extraordinary lows in April 2013 and even lower lows in June of 2013.

How Extraordinary?

Technical indicators are still somewhat valid (in my opinion) at indicating how much a market is over-bought or over-sold, even if those indicators are less useful (thanks to HFT) at indicating future moves and timing.

Silver RSI (Relative Strength Indicator – 14 period): On a weekly basis, it is the lowest in 40 years of data and nearly that low on a daily basis. This timing indicator suggests that silver is extremely over-sold on both a daily and weekly basis. Gold is similarly oversold.

Gold stocks % bullish Index ($DPGBM): This indicates the % of gold stocks above their 200 day moving average. It currently ranks at zero – gold stocks have been hammered. This indicates gold stocks are very low and hopefully ready to rally. Sentiment toward gold among independent financial advisors, as reported by The Hulbert Financial Digest, is at all-time lows. Prices usually rebound after such lows in sentiment.

COT Net long: The Commitment of Traders data provided by the CFTC indicates the long and short positions of the non-commercials and commercials. Yes, I know, the data is somewhat suspect, but it still has value. Take the net of non-commercial longs less shorts and the net of commercial longs less shorts. Then subtract the net commercial longs from the net non-commercial longs. This difference correlates quite well over a long period of time with the price of silver. When the net long difference (as described above) is low, silver is low and due to rally. As of Friday, June 28, 2013 that net long difference was the LOWEST since the beginning of my data in January 2001 and probably for several decades. This indicates that the large bullion banks (JPM, etc.) are in a position to profit from a rally in the silver (and gold) markets.

The weekly TDI – Trade Signal Line (a technical oscillator) for silver as of June 28, 2013 registered the lowest reading since my data began in 1974. On a daily basis, the April reading was the lowest since 1980, and the June low was only slightly higher. Silver is ready to rally.
My risk/reward index is a weighted blend of COT data, moving averages, relative strength timing oscillators, and disparity between the current price and a long-term moving average. This weekly index has been quite accurate at indicating bottoms in the silver market. What it cannot do is indicate if a lower low is coming in another few months or if the current low is likely to indicate a multi-year bottom. This indicator is currently the most oversold since the beginning of my data in January 2001 and is even more oversold than at the bottom after the 2008 crash in the silver market. The indicator is currently suggesting a major rally is ahead for the silver market – perhaps a multi-year continuation of the bull market. Please examine the graph of silver prices and this risk/reward index.
silver-risk-reward-june

There are many other technical indicators, oscillators, and sentiment measures that suggest a similar story. For all practical purposes, it appears that the large bullion banks and traders (the JPMs, etc.) are now net long in gold and probably net long in silver. The stage is set for a JPM managed rally to take advantage of their net long position, having dumped their shorts in the last two engineered declines in gold and silver.

However, it is possible that their agenda is to generate further support for the dollar and additional declines in gold and silver. With essentially unlimited financial backing, their ability to create and sell huge quantities of PAPER silver and gold and a “free pass” from the regulators, they are the elephants in the room, and they can overwhelm technical indicators, oversold conditions, and sentiment if they so choose. That would not be the case if we had an honest physical market where a company has to have physical product to sell it.

Conclusio

  • The stage is set for the large bullion banks to profit from a rally. Expect a rally.
  • The silver and gold markets are deeply oversold and sentiment in both markets is very low. Are silver and gold investors currently disgusted and disappointed or happy and excited? Right! Rallies occur when practically everyone is disappointed, disgusted, or frightened out of the market. It was the same with the S&P (March 2009, October 1987) and crude oil (December 2008) and gold (October 2008).
  • Now is a time to buy gold and silver, not sell them.
  • Listen to the national media and consider doing the opposite.
  • Silver and gold sentiment and indicators are at multi-year, multi-decade, or all-time lows. The indicators and sentiment suggest the high probability of a substantial rally ahead.
  • The cash markets are strong. Individuals and central banks are buying gold and silver in Russia, China, India, and other Asian countries. Individuals who see the big picture are also buying in Europe and the US.

Does a certificate of deposit paying 1%, gold, or silver look more safe and rewarding at this point in time?

Read:
Silver Cycles: What Next?
Back to Basics – Gold, Silver, and the Economy

GE Christenson
aka Deviant Investor

Has The Price of Silver Already Discounted Weak Investment and Industrial Demand?

american-silver-eagle
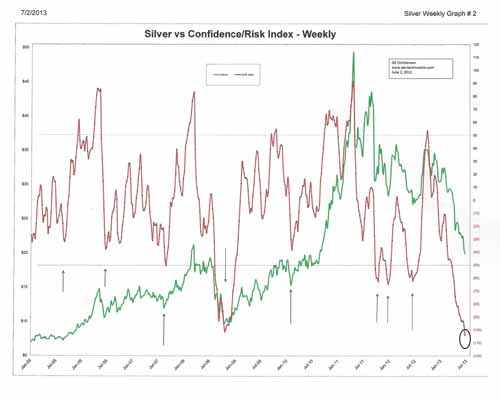
Precious metals analyst Suki Coper at Barclays takes a look at the silver market in an interview with Bloomberg Television.

Silver investors have endured a brutal year as the price of silver declined by $12.20 or 39.5% since  the beginning of the year.   Will the price of silver quickly recover as it did after the 2008 collapse or have the fundamentals changed so significantly that a price recovery may be years away?

Suki Coper notes that silver is struggling to find support from both industrial and investment demand which has turned “quite weak.”  Markets are a discounting mechanism and weak demand seems to already be reflected in the price of silver.  The next price move in silver may hinge on whether or not silver demand recovers from this point or continues to decline.

Ms. Coper notes that imports of silver by China, which had been an area of price support, are at the lowest level since January 2006.  The recent slowdown in economic growth in China along with a looming banking crisis does not bode well for a pickup of industrial demand for silver.

The influence of the Federal Reserve on silver could also be negative if the Fed gets more hawkish in its monetary policies.

Some People Are Celebrating The Gold Collapse – Taking A Long Term View On The Future

American-Gold-EagleMany financial bloggers who never bought into the “yes, it’s important to own some gold” theory have been almost hysterically gloating over the recent divergence between gold and stocks.  An example of this is a recent blog post comparing the performance of the SPDR Gold Trust (GLD) to the Standard & Poor’s 500 (SPY).

Reality cannot be ignored – owning stocks over the past two years has been a black hole for investors compared to stocks

Here’s the ugly chart proving that investors who thought that precious metals had a golden future are wrong.

Courtesy: thereformedbroker.com

Courtesy: thereformedbroker.com

Short term views can be misleading and the biggest gains are made by making the right investment and holding for the long term. The picture of the GLD vs. the SPY looks quite different if we go back to 2005.

courtesy: yahoo finance

courtesy: yahoo finance

In addition, let’s not forget that the stock market as measured by the S&P 500 is just about where it was over a decade ago in 2001.

courtesy: yahoo finance

courtesy: yahoo finance

Considering the perilous state of world economic affairs and notwithstanding the recent significant drop in the price of precious metals, maintaining a position in gold and silver seems like a prudent long term option.

Barclays Sees Gold At $1,500 By Year End

gold buffaloIs there any hope for a recovery in gold and silver prices by year end?
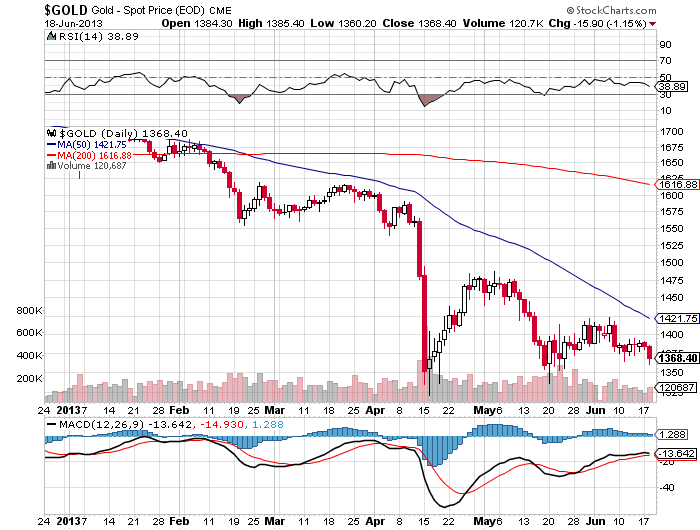
Precious metals analyst Suki Coper discuses the prospects for the gold and silver markets in an interview with Bloomberg Television.

Ms. Coper notes that silver tends to follow the gold market but should show more price weakness relative to gold.  In order for the price of silver to stabilize, the precious metal needs investment support from both the industrial and investment side.   Economic weakness in both China and Europe currently portend weak industrial demand for silver.

Despite the current weakness in both gold and silver, Ms. Coper sees the price of gold approaching $1,500 by the end of the year.

Since the beginning of the year, the price of gold has dropped by $303 per ounce or 18%, to a closing price of $1,378.50 at the close of Tuesday’s trading in London.

courtesy: kitco.com

courtesy: kitco.com

Silver’s price decline has been even steeper than gold with a drop of $9.07 per ounce or 29.4% since the beginning of the year.

courtesy: kitco.com

courtesy: kitco.com

Will Silver Plunge Below $15 or Rally Back Over $50?

1881-CC-Morgan-DollarBy: GE Christenson

Silver prices peaked in April 2011 and dropped about 60% over the next 25 months. Sentiment by almost any measure is currently terrible. Few are interested in silver; most have lost money (on paper) if they bought in the last two and one half years, and the emotional pain seems considerable. It reminds me of the years after the NASDAQ crash in 2000.

So will silver drop under $15 or rally back above $50?

To help answer that question, I examined the chart of silver for the last 25 years and identified several long-term cycles. Then I constructed a spreadsheet that attempted to model the price of weekly silver based on those cycles and a few assumptions.

Assumptions

  • Use only long-term cycles – a year or longer.
  • The weight assigned to each cycle is approximately proportional to its length. A 200-week cycle should be approximately twice as heavily weighted as a 100-week cycle.
  • This is NOT a trading vehicle but a long-term indication of reasonable price projections based on past relationships. Those past relationships may or may not continue, even if they have been valid for over 20 years.
  • Keep it simple. Do not over-complicate the model or aggressively “curve-fit” it.
  • Prices are assumed to rise more slowly than they fall, so 62% of the cycle is related to the rising portion of the cycle, and 38% of the cycle is related to the falling portion of the cycle.

Data

Low-to-Low cycles: 65 weeks, 72 weeks, and 234 weeks
High-to-High cycles: 102 weeks
Exponential growth: 1/1/1990 – 6/30/2002: no growth – 0.0%/year
6/30/2002 – present: 21% per year, calculated weekly

Process

Find the beginning dates (lows) for the 65, 72, and 234 week cycles, and assign those beginning dates an index value of -1.0. Proportionally increase those index values from -1.0 to +1.0, and then reduce those index values from +1.0 to – 1.0, and repeat for each low-to-low cycle. Use the beginning index value on the 102-week high to high cycle as + 1.0. Extend the proportional increases on all time cycles from -1.0 to + 1.0 so that period takes 62% of the cycle length.

Assign each cycle a weight approximately proportional to the cycle length. Use a beginning value and calculate the exponential increase (0% or 21% per year) for each week, and then add or subtract the percentage changes for each weekly time cycle. Adjust the cycle index weights to obtain the best visual fit on a graph of actual silver prices versus the calculated price of silver.

What Could Go Wrong?

  • The exponential increase might not continue from 2013 forward. I doubt it, but it is possible.
  • The cycles, although relevant for over 20 years, might be less relevant from 2013 forward.
  • The calculated price was “curve-fit” to the actual prices, and that “curve-fit” result might be less accurate from 2013 forward.

Results

Statistical correlation over the last 20 years is about 0.95. The calculated silver price is generally consistent with the actual silver price, even though occasional large variations are clearly evident.

Click on image to enlarge.

Highlights

Calculated low: 2/4/05 at $4.96
Actual low: 5/7/04 at $5.60

Calculated high: 3/17/06 at $13.33
Actual high: 5/12/06 at $14.24

Calculated high: 5/4/07 at $18.13
Actual high: 3/14/08 at $20.66

Calculated low: 12/12/08 at $8.15
Actual low: 10/24/08 at $9.30

Calculated high: 3/2/12 at $42.98
Actual high: 4/29/11 at $48.59

Calculated low: 5/10/13 at $23.32
Actual low: 5/17/13 at $22.25 (actual weekly low, so far)

The Future

This simple model, which uses only four cycles and an exponential increase, indicates that a low in the silver price was expected approximately February – July 2013 and that the next high is expected approximately Mar – October 2014 in the $50 – $60 range. Further, the model suggests that a silver price of $90 – $110 is possible in the September 2015 – March 2016 time period.

Caveats!

There are many. This is not a prediction, it is simply a projection based on the entirely reasonable, but possibly incorrect, assumption that silver prices will continue to rise about 20% per year, on average, and that these four cycles will push actual prices well above and below that exponential growth trend.

Why will silver prices continue to increase? Our current monetary system depends upon an exponentially increasing debt and money supply. It seems likely that the US government will continue to run massive budget deficits and thereby increase total debt. In addition, the central banks of Japan, the EU, and the US will continue to monetize debt and increase the money supply to promote asset inflation and to overwhelm the deflationary forces in their respective economies. Silver supply increases slowly, the demand increases much more rapidly, while each Dollar, Euro, & Yen purchase less, on average, each year. It seems quite reasonable to expect that silver (and gold) prices will increase substantially from their current low level. Read: Silver – A Bipolar Roller Coaster.

Timing

The model was basically correct (over the last decade) on timing and price with some large variations. Clearly there are more factors driving the price of silver than four simple cycles. Those political, emotional, and economic factors will push the price higher or lower, sooner or later, than the model indicates. Regardless, it has some value indicating the approximate price and timing for long-term highs and lows in the price of silver.

Use it while appreciating its limitations. Read: Back To Basics: Gold, Silver, and the Economy.

GE Christenson
aka Deviant Investor

Gold and Silver Investors Need to Ask Themselves 10 Basic Questions

1933-double-eagle1Rick Rule listed 10 key questions regarding today’s economy. They are:

10 Questions for Precious Metals Investors

  • Is the financial crisis in the Western world over?
  • Have the G20 countries balanced their budget?
  • Did the commercial banks manage to become solvent?
  • Are (real) interest rates positive or negative?
  • Is a global competitive devaluation to increase exports still ongoing?
  • Is the European periphery still financially challenged?
  • Do the Asian countries still have a cultural affinity with precious metals?
  • Which are the US budgetary issues and solutions?
  • Are the derivatives from large banks still a problem for economies and client portfolios?
  • Can liquidity solve the issue of insolvency?

If these are the questions, then gold and silver are two good answers.

But, let’s approach these questions from a different direction.

  • Have gold or silver ever defaulted?
  • Do gold or silver have counter-party risk like EVERY paper investment?
  • On January 1, 2000 the Dow was about 11,500, gold was priced at $289, and silver was priced at $5.41. As of May 24, 2013, those numbers were: Dow: 15,303, gold $1,386, silver $22.49. Which was the best investment?
  • Gold fell (in 21 months) from over $1,900 to about $1,320. Does that mean the gold bull market is over? The Dow crashed from 14,100 (October 2007) to about 6,500 (March 2009), and then rallied back to new highs. Don’t exclude the possibility of new highs for gold and silver in the coming months.
  • Why are Chinese businesses, individuals, and their central bank buying gold as rapidly as possible? Why does the Chinese government refuse to allow any gold to be exported? Why does China (world’s largest gold producer) additionally import a massive amount of gold every year?
  • Ask the same for Russia, India, and much of Asia. What do they know about the VALUE of gold that the EU and the USA (who are selling gold) don’t understand?

Further:

  • Gold and silver have gone up and down, when priced in unbacked paper currencies. The same is true for trucks, diamonds, the Dow Index, laundry detergent, gasoline, cigarettes, and wheat. Price increases and volatility will continue.
  • Gold, silver, and the national debt have increased exponentially since Nixon severed the link between the dollar and gold in 1971. All three will continue to rise. Gold and silver will occasionally rally too far and crash, while the national debt will increase until politicians no longer enjoy spending other people’s money.
  • Goldman Sachs (and many others) have said gold is in a bubble. The same individuals and groups probably did not see the bubble in Internet stocks and housing. Do you trust them or the 3,000 years of history during which gold and silver have been real money and a store of value?
  • If JP Morgan (and others) can make huge profits using computers, complex mathematical algorithms, and High-Frequency-Trading, then they will. Often their trading temporarily drives the prices for gold and silver down. After the markets have been driven far enough down, the same trading process is used to drive the prices higher. Expect it!
  • Silver has dropped from about $49 (April 2011) to just above $20 (May 2013) – almost a 60% drop in price. Does that mean it will continue to drop more – perhaps to $10? Silver has retained its value, on average, for 3,000 years but has fallen in price for two years. On the basis of price action in those two years, most individuals (based on sentiment measures) have chosen to trust unbacked paper currencies issued by an insolvent central bank and an insolvent sovereign government instead of silver. This is typical of market bottoms, even if it is not sensible.
  • About 4.5 years ago (October 2008) silver crashed to a price bottom where “everybody felt” like it was hopeless to expect silver to rally again. About 4.5 years before that (May 2004), silver also crashed to a price bottom where “everybody felt” like it was hopeless to expect silver to rally again. But, in fact, the silver rally off the low in 2008 was over 450%, and the rally off the 2004 low was over 175%. Silver will rally again.
  • We may not trust bankers and politicians to effectively run the country, but we can trust them to “print money” and to spend in excess of their revenues. Consequently, we should trust them to drive the prices, as measured in unbacked paper currencies, for gold and silver – MUCH higher.

GE Christenson
aka Deviant Investor

How To Buy Physical Silver With A Zero Chance Of Loss

silverAnything that sound too good to be true, well, you know how that ends.

But there actually is a way to purchase physical silver with a zero chance of loss, courtesy of the Royal Canadian Mint (RCM).

For the first time ever, the RCM is offering a coin with a face value of $100 at a price of $100.  Here are the details courtesy of the mintnewsblog.

Following the success of their “$20 for $20″ silver coin program, the Royal Canadian Mint has launched a new series which uses the same concept for a larger face value.

Orders are now being accepted for the first “$100 for $100″ silver coin, which is the initial release for the Wildlife in Motion series. The RCM indicates this is the first time in history that $100 can buy a coin worth $100.

Buffalo $100 Silver Coin

The reverse of the coin designed by Claudio D’Angelo features three members of a herd of stampeding bison racing across the grassy prairie. The bison are pictured in profile, illustrating the movement and momentum of the massive creatures. The background shows foothills which are backed by a jagged mountain with clouds above. The inscriptions read “Canada 2013″ and the legal tender face value of “$100 Dollars”.

The obverse of the coin features the portrait of Queen Elizabeth II designed by Susanna Blunt.

The 2013 $100 for $100 Bison Silver Coin is struck in 99.99% pure silver with a weight of 31.6 grams (1.016 troy ounces) and diameter of 40 mm. The maximum mintage is limited to 50,000 pieces with a limit of three coins per household.

These coins are available for sale priced at their face value of $100 CAD. The product page can be found here.

This is about as close to a sure thing as you can find in life.  The coin will always have a value of $100. If silver prices increase to $200 per ounce, the coin would be worth about $200 based on the silver content of 1.016 troy ounce.

The Bull Market In Gold Is Dead

Gold coins
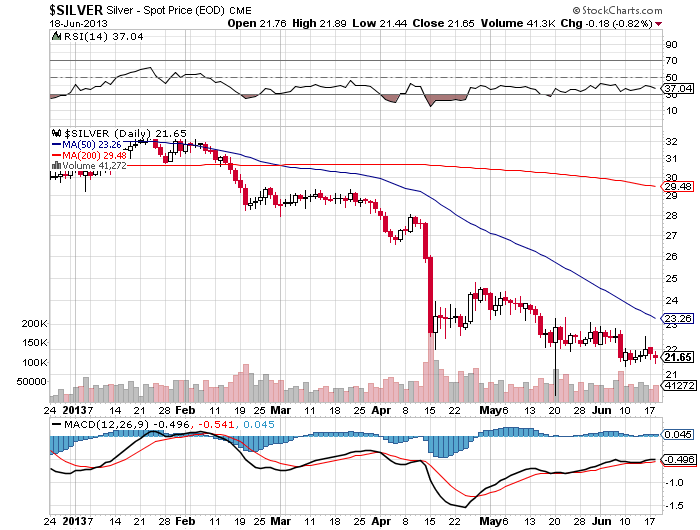
April was a brutal month for precious metal investors.  Gold ended the month down almost 8% and silver prices tumbled almost 13%.   The sell off continued in May with gold down another $60 per ounce to $1,412 and silver down $1.55 to $22.87 per ounce at mid month.

With investors already nervous, two mainstream news organizations today did the equivalent of yelling fire in a theater crowded with gold and silver investors.

Both Bloomberg and The Wall Street Journal published extremely bearish articles on gold which essentially proclaimed the death of the gold bull market.

“Gold is going to get crushed”

Gold will trade at $1,100 an ounce in a year and below $1,000 in five years, according to Ric Deverell, head of commodities research at the bank. Lower prices are unlikely to lure more central-bank buying, said Deverell, who worked at the Reserve Bank of Australia for 10 years before joining Credit Suisse in 2010.

“Gold is going to get crushed,” Deverell told reporters in London today. “The need to buy gold for wealth preservation fell down and the probability of inflation on a one- to three-year horizon is significantly diminished.”

Investors are losing faith in the world’s traditional store of value even as central banks continue to print money on an unprecedented scale. Bullion slumped into the bear market last month after a 12-year bull market that saw prices rise as much as sevenfold. Gold is a “wounded bull,” Credit Suisse said in a Jan. 3 report.

“When gold is going up, it looks like a great idea to buy more gold,” Deverell said. “And when it’s going down, do you really think risk-averse central bankers are going to try and catch the knife? No.”

A surge in demand for bars, coins and jewelry following gold’s drop to a two-year low in April is temporary, Deverell said. The U.S. Mint said April 23 it ran out of its smallest gold coins and Australia’s Perth Mint said volumes jumped to a five-year high. India’s bullion imports may surge 47 percent to 225 tons in the second quarter to meet consumer buying, according to the All India Gems & Jewelery Trade Federation.

“This is bargain-buying,” Deverell said. “It’s like when you have cash for clunkers in autos, you bring forward activity, but it’s not a massive addition to buying.’

Courtesy: kitco.com

Courtesy: kitco.com

“The bears are mauling gold”

The metal fell for a sixth consecutive trading session on Thursday, as investors continue to flee toward assets that promise higher returns.

The characteristics beloved of “gold bugs,” the sizable army of large and small investors who swear by the metal, are precisely what bears are feasting on. Unlike most other assets, gold doesn’t offer a steady return, or yield, and it is often seen as protection against inflation or currency devaluations.

At present, however, global economic growth is sluggish, interest rates in many developed countries are at or near record lows, and investors of all stripes are scrambling to find higher-yielding assets.

“There’s basically no inflation, equities are taking off, and we’ve got a strong dollar,” said Fain Shaffer, president of Infinity Trading Corp. in Medford, Ore. “All of those are just eroding away the investment value of precious metals.” Mr. Shaffer this week recommended his clients bet on lower gold prices.

On Thursday, bears seized on a World Gold Council report showing that total demand for gold fell 13% in the first quarter, to a three-year low of 963 tons in the period.

Other investors are taking the opposite view. John Workman, chief investment strategist with Convergent Wealth Advisors, said the firm late last year recommended that clients trim their gold holdings by about 25%. He cited gold prices that have stagnated despite more stimulus from the Federal Reserve in the form of asset purchases, the same money printing that galvanized gold bugs after the financial crisis. Falling prices were a signal that many investors just weren’t concerned anymore that the stimulus measures would stoke inflation and weaken the dollar.

To sum things up –

  • it no longer matters that central banks everywhere are printing money on an unimaginable scale,
  • the world economy is doing fine and will continue to improve,
  • gold, used as a currency and safe haven for 5,000 years, is inferior to fiat paper currency,
  • returns are better in stocks and bonds,
  • monetary stimulus via central bank asset purchases will propel the world into sustained economic growth,
  • there is no inflation and
  • investors want assets with yields.

Price fluctuations may not make much sense in the short term, but long term precious metal investors know where things are headed – see Why I Will Always Own Gold.

Why I Will Always Own Gold and Silver

What I Know for Certain –  By:  GE Christenson

gold-dollar

      • Death and taxes!
      • Fear and greed are powerful motivators.
      • Individuals, businesses, and governments do what they think is beneficial for them.
      • Businesses and governments protect their products and territory and resist competition and enemies.
      • Concentrated wealth creates power and corruption. The greater the concentration of wealth, the larger and more pervasive the power and corruption.
      • Gold and silver have been money for over 3,000 years.
      • Unbacked paper money systems have always failed.

What I Think is True

      • The basic product of a central bank is the unbacked paper currency it prints in ever-increasing quantities.
      • Central banks will fight all competitors to their currencies. The oldest competitor to unbacked paper currencies is gold, ancient money.
      • Politicians want to spend money and increase their power.
      • Bankers want to create money, lend it to governments, and thereby secure a permanent and increasing revenue stream.

What I Think the Consequences Are

      • Bankers use their wealth to “influence” politicians. Politicians respond with favorable legislation. It has worked for centuries.
      • Central banks want an expanding money supply and ever-increasing debt. The consequence is that consumer prices inevitably increase.
      • A currency collapse is like a bank run – everyone scrambles to remove his/her wealth from the currency (or the bank) due to a loss of confidence. In fractional reserve banking systems, bank runs are inevitable. Even though they may last for many decades, unbacked paper currencies inevitably devalue and eventually collapse.
      • Bank runs and currency collapses are feared by bankers and politicians; they do what they can to support confidence in their products and to squash their competitors.

In the United States

      • Debt and government spending seem likely to increase until a crash-reset occurs.
      • The crash-reset will involve a dollar collapse.
      • Gold and silver will eventually reach much higher prices due to the loss of value and confidence in the dollar, the banking system, and the sustainability of the current financial system.
      • “Paper gold” will be seen for what it is – a promise that might not be paid.
      • Physical gold will be seen for what it is – real wealth.
      • The USA and Europe are sending their real wealth – gold – to China, India, Russia, and the Middle East. China, India, and Russia are buying aggressively and know that exchanging paper dollars and euros for gold will strengthen their economies and governments tomorrow.
      • It is openly speculated that much of the sovereign government and central bank gold supposedly owned by the USA and Europe is either gone, leased, or otherwise committed.

Read: The Crash Before the Climb

Accept what you cannot change and act based on facts, not our current financial and economic fictions. Protect your financial well-being with physical gold and silver safely stored in a secure location.

GE Christenson
aka Deviant Investor