 The precious metal markets, which have been under a constant drumbeat of negative news and bearish price forecasts for months, sold off sharply today. Bearish investors seemed to reach the “give up” stage as gold and silver fell below key technical levels. Panic selling continued to cascade throughout the day as precious metal investors hit the sell button and buyers stepped aside.
By the end of the trading day, gold dropped an astonishing $84 per ounce to close at $1,478, down over 5% on the day and below $1,500 per ounce for the first time since July 5, 2011. Silver had an even worse day with a price decline of 6.5%, closing down $1.81 per ounce at $25.95.
Analysts had multiple reasons for the huge decline in gold and silver prices including the belief that inflation will remain subdued and the Federal Reserve would begin to slow the pace of monetary stimulus later this year. In addition, many trend following investors are repositioning out of precious metals into other investment opportunities such as stocks which have appreciated by over 100% since the depths of the financial crisis. By contrast, gold and silver have been unable to breach highs reached in mid 2011.
Also weighing on investor’s mind was the fear that the proposed sale of over $500 million of Cyprus gold reserves would further pressure gold prices. Comments in the Wall Street Journal suggested that other countries may also be forced to sell their gold reserves.
The news about Cyprus “gets people to wonder: Will there be central-bank liquidation of gold when other countries get into trouble?” said Adam Klopfenstein, senior market strategist with Archer Financial Services in Chicago. “Selling gold might be the new caveat for any future [bailout] deals.”
The match that ignited the explosive move to the downside was struck on Wednesday when Bloomberg reported that Goldman Sachs predicted sharply lower gold prices and suggested that investors actually short the gold market.
The turn in the gold price cycle is accelerating after a 12-year rally as the recovery in the U.S. economy gains momentum, according to Goldman Sachs Group Inc., which reduced forecasts for the metal through 2014.
The bank cut its three-month target to $1,530 an ounce from $1,615 and lowered the six- and 12-month predictions to $1,490 and $1,390 from $1,600 and $1,550. Goldman recommended closing a long Comex gold position initiated on Oct. 11, 2010 for a potential gain of $219 an ounce, analysts Damien Courvalin and Jeffrey Currie wrote in a report today.
“Despite resurgence in euro-area risk aversion and disappointing U.S. economic data, gold prices are unchanged over the past month, highlighting how conviction in holding gold is quickly waning,” the Goldman analysts wrote in the report. “While higher inflation may be the catalyst for the next gold cycle, this is likely several years away.”
Goldman cut its 2013 gold estimate to $1,545 an ounce from $1,610, trimmed its 2014 forecast to $1,350 from $1,490, and set year-end targets of $1,450 in 2013 and $1,270 in 2014. Goldman recommended starting a short Comex gold position, targeting $1,450 with a stop at $1,650, the analysts wrote.
Ironically, the biggest worry for gold and silver investors now comes from the precious metal ETFs, which greatly contributed to the precious metals bull market as investors poured billions of dollars in the SPDR Gold Shares (GLD) and the iShares Silver Trust (SLV). If investors in the GLD and SLV initiate panic liquidations, a sharp rebound in gold prices may be wishful thinking despite today’s huge sell off. According to Goldman Sachs, “The fall in prices could end up being faster and larger than our forecast, as aggregate speculative net long positions across Comex futures and gold ETFs remain near record highs.”
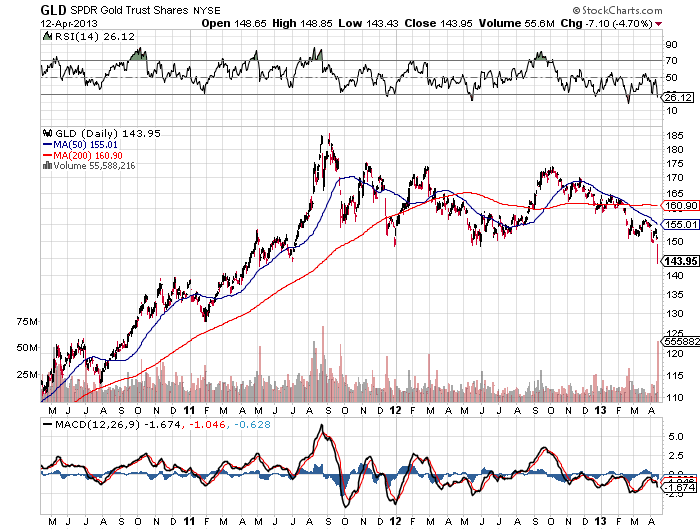
COURTESY: STOCKCHARTS.COM
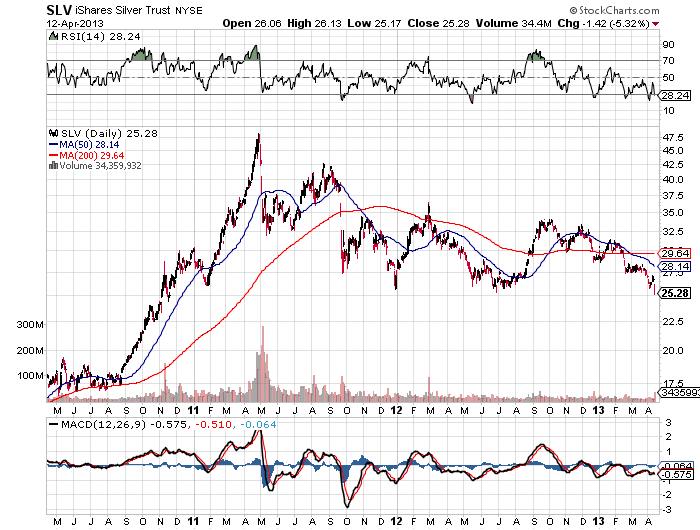
COURTESY: STOCKCHARTS.COM
The bearish sentiment and price action on gold and silver seemed to have reached extreme levels. Does anyone hear a contrarian bell ringing?
 A profound thanks to all the short term fickle speculators in gold and silver who have shifted their portfolio allocations to stocks, bank accounts and
 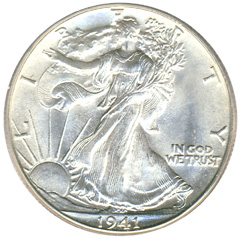 Begin the analysis in 1971 when Nixon dropped the link between the dollar and gold. A pack of Marlboros cost (depending on local taxes) about $0.39. We paid about $0.36 for a gallon of gasoline. The DOW Index was about 850. Silver was priced at about $1.39.


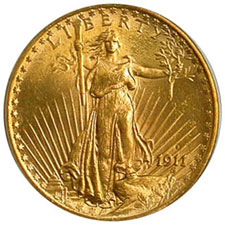
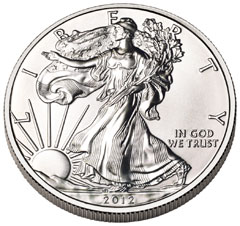 Prior to the financial crisis, sales of the one ounce American silver eagles averaged about 10 million coins per year. The near collapse of the financial system in 2008 raised profound questions about the integrity of the financial system and the rush to precious metals was on. Since 2008, annual sales of the American Eagle silver bullion coins have soared with average annual sales of over 31 million coins.

 Sales of both the American Eagle gold and silver bullion coins soared in February compared to the previous year.
 One of the best methods for protecting wealth against a constantly depreciating paper currency is to own precious metals.


 With two days remaining in the month of January, U.S. Mint sales of the American Silver Eagle bullion coins have already established an all time record high. The latest numbers from the Mint show total sales of 7,420,000 silver bullion coins as January 29, 2013. Total sales during January 2012 amounted to 6,107,000 coins. During January 2011 (the previous monthly record high for silver bullion coin sales) the Mint sold 6,422,000 coins.
 By GE Christenson: