April 19, 2024

November Gold Drop of 5.5% Worst in 35 Years as “Unidentified Sellers” Continue to Dump Gold

tenth oz gold-eaglesNovember was a miserable month for gold investors as prices dropped by 5.5% for the Worst November in 35 Years.  Adding to the misery, gold is almost certain to have its first yearly decline after rising 12 years in a row.

NEW YORK—Gold prices logged their worst November since 1978 as a brighter economic landscape fanned fears of reduced stimulus efforts by the Federal Reserve.

Gold prices dropped 5.5% in November. The declines help put gold on track to end 2013 in negative territory, disrupting a 12-year winning streak that saw the precious metal set price records.

“Nothing goes up forever,” said Frank McGhee, a senior precious-metals dealer with Integrated Brokerage Services LLC. in Chicago.

“You’ve got the beginning of an economic pickup without any inflationary signs…[and] you have the specter of the end of easy money, and that’s bearish for gold,” Mr. McGhee said.

A record-breaking rally in U.S. equities also lured many traders away from the precious-metals market. On Friday, the S&P 500 touched a record high of 1813.

Gold’s losses haven’t been limited to the futures market, analysts at Barclays PLC said. Exchange-traded funds backed by physical gold, which take the hassle out of purchasing and storing physical gold for individual investors, have seen their holdings drop 38.4 metric tons through Nov. 26 as sales picked up from the prior month.

Still, November is far from the worst month for the precious metal—gold prices fell 12% this June and nearly 18% in October 2008.

Investors in both gold and silver are looking at losses as precious metal prices decline despite record demand for physical gold and silver.

money printing

Exactly who is causing the price of gold to drop by indiscriminately dumping gold  remains an intriguing mystery that the major news organizations have essentially ignored.   Zero Hedge recently questioned why a rational seller would dump large amounts of gold at odd hours into illiquid markets unless they were deliberately trying to drive the price of gold down.

Shortly after 1amET this morning, someone with no apparent fiduciary duty to their client’s for best execution or any apparent trade allocation expertise decided it was time to dump 1500 contracts into an entirely illiquid gold futures market. The 150,000 ounce notional sell order ($184.5 million), captured graphically by Nanex, sent the price down $10 instaneously, tripped the exchange’s circuit breakers and halted the market’s trading for 20 seconds (once again). This is now the 4th market halt in the past 3 months (and this time on no news whatsoever), as the manipulative monkey-hammerings from who knows whom (BIS?) is becoming increasingly obvious.

Via Nanex,

This sort of thing is happening far too often: see also the drops on April 12, 2013, September 12, 2013, October 11, 2013 and November 20, 2013 which also resulted in trading halts.

Will the mystery of who hates gold ever be solved?

gold-buffalo

As documented many times by the Gold Anti-Trust Action Committee (GATA), the “fat finger” on the gold manipulation button seems to have its origins at the highest levels of government and central banks; this being the case, no one should hold their breath waiting for an honest explanation of the mystery of pricing in the gold market.

U.S. Mint Runs Out of Silver Bullion Coins – Gold and Silver Coin Sales Hit Record Levels in November

rooseveltLong term proponents of sound money cannot seem to get enough of U.S. Mint produced gold and silver bullion coins.  Ever since the financial crash of 2008 many Americans remain profoundly skeptical of the paper dollar system backed by the “full faith and credit” of a nation that has borrowed itself into poverty and promised more in social benefits than the economy can possible provide.

From 2000 to 2007 sales of the U.S. Mint American Eagle gold bullion coins averaged about 341,000 ounces annually.  After the crash of 2008 exposed the risk of paper assets, sales of the gold bullion coins have averaged about 1,011,300 ounces annually from 2008 to 2013.

Year to date sales of the American Eagle gold bullion coins as of the end of November totaled 800,500 ounces, surpassing total 2012 sales of 753,000 ounces.  For November the U.S. Mint sold 48,000 ounces of gold bullion coins, slightly below the sales figures of 48,500 for the previous month.  Since 2000 investors have stashed away 8.8 million gold bullion coins currently worth about $11 billion.

Gold has retained its value throughout human history and strong demand for gold over the ages has resulted in the depletion of most gold deposits on the planet.  As noted in a previous post, about 75% of all gold deposits have already been mined which forebodes a future gold shortage.

american-silver-eagleAs noted in a previous post, sales of the U.S. Mint American Eagle silver bullion coins hit record annual sales volume in  November.  The U.S. Mint sold a total of 41,475,000 silver bullion coins as of November 30th, surpassing the previous record sales year of 39,868,500 coins in 2011.

Sales of the American Eagle silver bullion coins for November came in at 2,300,000, a decline of 787,000 coins compared to 3,087,000 in the previous month.  The lower sales figures for November do not reflect a drop in demand for silver bullion coins but rather the opposite due to the fact that the U.S. Mint has run out of coins due to unprecedented demand.

This same shortage situation existed last year when the Mint ran out of silver bullion coins in mid December  with orders for the new 2013 silver bullion coins not being accepted until January 7, 2013.  This situation resulted in a three week period during which the American Eagle silver bullion coins were simply not available.

The period of time during which silver bullion coins will be unavailable from December 2013 to January 2014 will be even longer than last year.

peace dollar

According to coinupdate.com silver bullion coins will not be available for investor purchase for over a month and supplies will be rationed when available.

The United States Mint recently provided authorized purchasers with information on year end ordering procedures and the availability of 2014-dated releases for the American Eagle and American Buffalo bullion programs. Based on the details provided, it seems that the American Silver Eagle bullion coins will experience roughly one month of unavailability between the final allocation of 2013-dated coins and the release of the first 2014-dated coins.

The situation for American Silver Eagle bullion coins differs from the prior year. Authorized purchasers will be offered the last weekly allocation of 2013-dated coins on Monday, December 9, 2013. With demand continuing to run ahead of the available supplies, the allocation will likely be quickly depleted.

The 2014-dated Silver Eagle bullion coins will not be available to order until Monday, January 13, 2014. The initial release will be subject to the US Mint’s allocation program, which rations supplies amongst the authorized purchasers.

With such a severe shortage of silver bullion coins, expect buyer premiums to increase significantly over the next two months.

Why Gold Stocks Are Not a Substitute for Gold

gold & barAn investor who was correctly bullish on gold in late 2004 had three basic investment options to capitalize on an increase in the price of gold:

  1. Invest in physical gold
  2. Invest in a proxy for physical gold such as the SPDR Gold Shares (GLD)
  3. Invest in gold mining companies

The investor who picked option three does not have a lot to be cheerful about even after gold’s historic increase in value since 2004.  Why did gold stocks do so poorly in spite of a 500% increase in the price of gold bullion?  Merk Investment takes a look at gold versus gold stocks and explains why Gold Stocks Ain’t Gold.

A frequent mistake made by investors
is to invest in gold mining companies
(both juniors and majors) as a substitute
for gold. There are a couple of reasons
why this may be a mistake. Firstly, gold
mining company’s stock price does not
precisely track the price of gold. That’s
because lots of other factors influence the
share price of a company: management,
cost pressures, mining diversification,
stage of the mining process, to name just
a few.

This problem is generally more
acute for juniors than majors, because
juniors often have yet to “strike gold,”
therefore the stock price often trades more
like an option. Moreover, many mining
companies don’t only mine gold, many
also mine silver, palladium, diamonds
etc.

This dynamic also holds for baskets
of mining companies – baskets of miners
have significantly underperformed the
price of gold over recent years.  Some investors believe gold mining stocks may provide more attractive
investment exposure to gold than gold
itself. The investment thesis is as follows:
gold mining companies are able to take
advantage of an increase in the price
of gold through enhanced operational
leverage; as the gold price goes up, mining companies’ margins widen, ultimately increasing the bottom line.

However, this theory is predicated on fixed costs staying
relatively constant. Unfortunately, recent
performance does not support this
investment idea. Indeed, gold mining
stocks, on aggregate, have significantly
underperformed the price of gold.

The reality is that mining is a highly energy-
intensive undertaking, and therefore
many of the costs are closely linked to
energy prices, such as oil, which has also
experienced significant increases in price.
As a result, many mining companies
have not produced the anticipated
high level of profits. Additionally,
governments may demand higher taxes
and employees higher wages from mining
companies should profitability increase,
further limiting the upside potential for
shareholders.

The results for each investment option are shown below for physical gold, the GLD and the Vanguard Precious Metal and Mining Fund (VGPMX) used as a stock proxy.  Note that despite the horrible long term performance, a nimble investor in the VGPMX could have reaped  considerable gains by selling in early 2008 and then getting back into gold stocks after the crash of 2008.

PHYSICAL GOLD

PHYSICAL GOLD

SPDR GOLD SHARES TRUST (GLD)

GLD

VANGUARD PRECIOUS METALS FUND (VGPMX)

VGPMX

Peak Gold – 75% of All Gold Deposits Have Already Been Mined

1933-double-eagle1The basic law of supply and demand dictates the quantity of goods offered for sale.  If prices are low and goods cannot be sold at a reasonable profit, producers will be unmotivated to increase production.  If prices  increase as demand for a product is soaring and producers can reap high returns, supply will increase as producers increase output to maximize profits.

When it comes to gold, however, the textbook equation for supply and demand can be thrown out the window.  Gold exists in finite quantities and has become increasing more difficult and expensive to mine.  In addition, major new gold deposits discoveries have dropped to zero in the past two years and ore grades have declined significantly to only 3 grams per tonne from 12 grams per tonne in 1950.

Even as gold exploded in price from under $300 per ounce in 2002 to $1,800 per ounce in 2011 gold production trended lower.  Despite much higher prices, gold miners were simply unable to increase supply.  According to the World Gold Council mine production over the past five years has not increased and average annual production has remained stable at approximately 2,690 tonnes per year.

On a long term basis gold production will continue to decline even further for the simple reason that most of the earth’s richest deposits of gold have already been mined and new gold deposit discoveries have declined significantly (see New Gold Discoveries Decline by 45%).

At the end of 2012 it is estimated that all the gold ever mined in history totaled approximately 173,000 metric tonnes.  According to the Perth Mint, a study done by Natural Resource Holdings estimates that there are only about 56,674 metric tonnes of recoverable gold reserves left.  If this bleak assessment is correct, over 75% of the world’s total gold reserves have already been mined as shown in the infographic below.

To keep things in perspective, the total global gold supply (including both mined gold and gold reserves) totals 230,000 metric tonnes worth about $9.2 trillion at the current gold price of $1,239.  By comparison, the U.S. deficit has exploded to over $17.2 trillion and the Federal Reserve has printed $4 trillion to drive down interest rates by purchasing mortgage backed securities and treasury debt.

In the bizarro world financial system created by the Federal Reserve and other central banks, the meaning of money has become distorted to the point where it is almost meaningless.  The recent decline in gold prices should be viewed as a long term opportunity to increase positions in a currency that central banks cannot create at will in infinite quantities.

Gold and Silver Are in Long Term Uptrends

mount-rushmore1By: GE Christenson

The BIG Perspective: Examine the following “Point & Figure” chart from Ron Rosen. This type of chart plots price on the “y” axis while the “x” axis shows time but without uniform distance between years. The long term trend has been up since 1970 and 2001, while the intermediate trend has been down for the past 26 months.

Gold and silver will outlast hope, change, paper money, treasury debt, and political promises. Most people do not and will not understand why!

The following are logarithmic charts of the official U.S. national debt, gold, silver, and crude oil for the past three to four decades.

Clearly the long term trends are up. Why?

  • A debt based paper currency system must expand to survive!
  • The Fed needs an increasing money supply and more debt.
  • Congress and the administration aggressively spend money, borrow money, and increase the national debt. It will take a real crisis to change this – much worse than a phony debt ceiling crisis.
  • The financial industry wants to churn more paper assets, debt, derivatives, and volatility to increase their profits.

The inevitable conclusion is that, over the long term, money supply, debt, and prices will increase until there is a systemic reset or crash. What will endure throughout the inevitable inflation, deflation, and crash? Gold and silver will endure. Paper assets are only as good as the collateral backing them, and many of those assets could vaporize in a systemic reset. Gold and silver will survive and maintain their value, while the dollar and Treasury Debt may lose a good portion of their value and purchasing power.

maple-leaf-442x450

Hope & Change

Hope is not a good basis for an investment plan. Hope is not a viable foundation for a political philosophy or for the actions of a government. Hope will not pay the bills, reduce the debt, or return sanity to an out-of-control spending process.

Ask yourself how well these are working:

  • We spent the rent money on lottery tickets and booze. We hope something good happens soon.
  • We spent a few $Trillion on useless wars in the middle-east. We hope it helped.
  • We spent $17,000,000,000,000 more than our revenue. We hope it is not a problem.
  • We sold or “leased” much of our accumulated gold and sent it to China. We hope nobody noticed and that it will not matter.
  • We hope we don’t have another stock market or bond market crash.
  • We hope to increase taxes and reduce benefits while increasing consumer prices and we hope to keep the people happy and voting for the incumbents. (This is also change.)
  • We hope to actually pass a budget real soon. (Congress has not passed a budget in the past five years. Did anyone notice or care?)
  • We hope to reduce the deficit real soon.
  • We hope the Federal Reserve and the politicians will make it all better.
  • We hope that hope and change will begin to work real soon.

As for “CHANGE” – it can be positive or negative. Not all change is good. We “HOPED” for better government and we received Obamacare. Was that a positive change?

Gee, we hope that the 10 Million or so people whose insurance plans will be cancelled and who will be forced to purchase new health insurance policies at much higher rates are okay with the change, increased deductibles and the increased costs. We hope they don’t get upset or angry or think someone lied to them.

Liberty-Eagle
Gold and Silver!

Dr. Phil says that the best predictor of future behavior is relevant past behavior. Using that thought it seems clear that:

  • The official national debt will continue to exponentially increase like it has for more than four decades.
  • The dollar will continue to decline in purchasing power like it has for the past 100 years.
  • Gold and silver will continue to (erratically) increase in price like they have for the past 40 years.
  • Gold and silver will hold their value and purchasing power like they have for 5,000 years.
  • Government deficit spending and borrowing will continue.
  • There will be another budget crisis, and another, and another.
  • Politicians will talk, make promises, and become much wealthier while the middle and lower classes find their expenses increasing far more rapidly than their incomes. We will re-elect those politicians.
  • Hope and change will continue to produce what they have so far – nothing but more debt.

Gold and silver will outlast hope, change, paper money, treasury debt, and political promises. Most people do not and will not understand why!
So, place your bets!

  • Paper currency or gold and silver.
  • Debt based paper assets or real money – gold and silver.
  • Political promises or something of lasting value.
  • Futures contracts on a corrupt exchange or land.
  • Credit card debt or stacked silver in a safe.
  • Social security income in a decade or gold in hand now.
  • Obamacare or good health.
  • Nutritionally empty fast food or healthy nutritious food.
  • Artificial and phony or real and valuable.
  • Reality television or the Holy Bible.

Most people will stick with what they know – paper currency, debt based paper assets, political promises, hope and change, and reality television. The choice is yours, but you will have a better financial future and more peace of mind if you invest in something real and valuable.

GE Christenson
aka Deviant Investor

The Hard Facts About Gold, the Fed, and the U.S. Government

gold & barLet’s back away from the “smaller” questions like:

  • Will the Fed taper or not?
  • Is Obamacare a disaster or just a huge problem?
  • Is the S&P 500 index due for a correction?
  • Is the U.S. economy improving?
  • Why is most of the rest of the world angry with the U.S.?
  • If inflation is so low, why are my expenses increasing so rapidly?
  • Is the NSA spying on everyone’s cell phone and computer?

Let’s look at the really big picture!

  • The Fed wants higher stock prices. The Fed serves the needs of the wealthy and the wealthy have a large chunk of their wealth invested in stocks.
  • The Fed wants low interest rates, which keep bond prices high, because the wealthy are heavily invested in bonds.
  • The Fed and the U.S. government need low interest rates so the U.S. government’s debt service costs remain low, real estate is attractive, credit is inexpensive, and investors are forced to reach for yield, buy stocks, and maintain the bond and dollar bubbles.
  • The U.S. government wants to spend money, lots of money, and avoid the consequences. Congress lives to buy votes, increase their power, and collect “contributions.” Lobbyists want a piece of the action for themselves. Corporations want to “influence” legislation to increase their profits. Business as usual. Spend. Spend. Spend!
  • Central banks, especially the Fed, and western governments want lower gold prices, so their unbacked paper money still appears valuable, so the U.S. dollar retains relative value against other currencies, and so the world will continue sending goods and commodities to the U.S. in exchange for paper dollars and T-bonds.

Can the Fed and the U.S. government manage the markets to achieve low interest rates, higher stocks, low inflation, low gold prices, and a strong dollar, all while spending much more than revenues support and thereby running the national debt up to insane levels? My assessment is NO!

What does the data indicate?

  1. Assume that the world changed around the 9th month of 2001. Stocks had peaked and crashed, the Twin Towers came down, government expanded, and the U.S. declared a War on Terror. There were bubbles to be inflated, massive debts to be incurred, no-bid contracts to be awarded, huge profits to be generated, and stories to tell.
  2. Assume that the spending, increasing debt, bubble blowing, and military-industrial profit generating machine have been operating more intensely since 2001.
  3. Assume that “this time is NOT different” and that our current fiscal and monetary trends will continue for several more years.

Gold and the S&P 500 Index

american-gold-eagle

Graph 1 shows 25 years of the smoothed* monthly price of gold divided by the smoothed value of the S&P 500 index. The ratio went down from the 1980s to about 2001 and rose thereafter. Until 2001 investors wanted financial assets more than real assets like gold and silver. Since then the price of gold has risen more rapidly than the S&P 500 index. The Fed wants the S&P to keep rising and so we should expect QE will continue in the hope that it will levitate the stock markets. Unless this time is different, gold will continue to rise.

Gold and the National Debt

Graph 2 shows 25 years of the smoothed* monthly price of gold divided by the official national debt in tens of $Billions. The ratio went down from the 1980s to about 2001 and then started rising. Even though debt has been increasing rapidly since 9-11, the price of gold has increased even more rapidly since its bear market lows in 1999/2001. Knowing that politicians, corporations, and banks need the spending and debt to continue increasing, we should expect massive deficits and ever-increasing national debt – growing about 10 – 12% per year. Unless this time is different, gold will also continue to rise.

Gold and the Dollar Index

Graph 3 shows 25 years of the dollar index multiplied by smoothed monthly gold prices. In broad terms a higher dollar usually goes with lower gold prices (when priced in dollars) and vice-versa. The product removes most of the currency variation and shows the big picture trend for gold. Since about 2001 the trend has been upward. Unless this time is different, gold will continue to rise.

The Fed has incentive to continue QE – to levitate the stock and bond markets and keep interest rates low. But QE will eventually weaken the dollar with excess supply, reduced demand and reduced value. Expect gold to rise in price.

The politicians want to spend money, lots of money, and will borrow and print until they can’t. The national debt and the price of gold will increase.

Summary

Unless the financial world has materially changed, we can expect that an increasing S&P index will correlate with higher gold prices, and an increasing national debt will correlate with higher gold prices. Similarly, continued QE will correlate with a lower dollar and higher gold prices.

They say “don’t fight the Fed” and “don’t fight the administration.” Even if it looks like a train wreck during amateur hour, the incentives motivating both the Fed and the government all align with higher gold prices.

Maybe the Fed and the politicians can’t get everything they want, but we expect they will be happy with strong bond prices, higher stock prices, and more spending. Those conditions will co-exist with higher gold prices. Consequently we expect the Fed and the politicians understand that the price of gold must go much higher. Sacrifices, such as higher gold prices, must be made to maintain the “full steam ahead” status of our national train wreck in progress – deficit spending, ever-increasing debt, QE-forever, more wars and currency debasement.

Do you own a sufficient quantity of physical gold and silver?

More Thoughts:
Created Currencies…Are NOT GOLD

GE Christenson
aka Deviant Investor

U.S. Mint Gold Coin Sales Soar 273% in October

gold-bullion
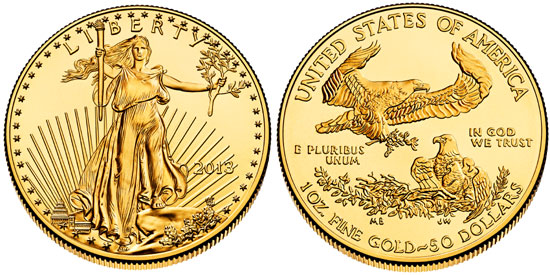
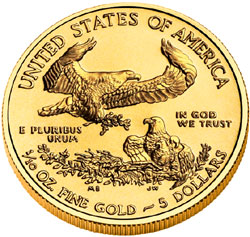
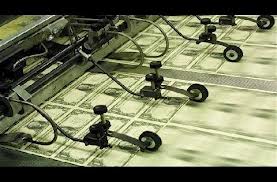
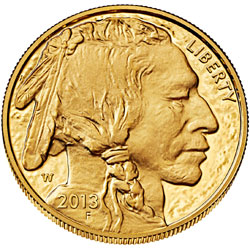
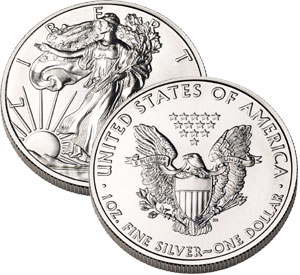
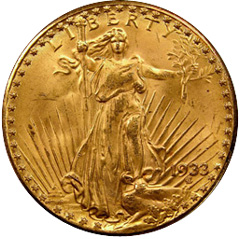
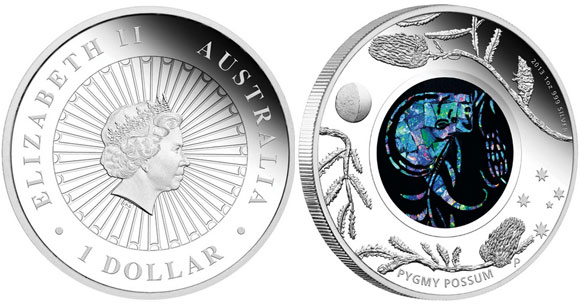
Although sales totals vary from month to month, annual sales of the U.S. Mint American Eagle gold bullion coins are running at triple the levels prior to 2008 when the wheels came off the world financial system and central banks began an orgy of money printing.

From 2000 to 2007 the average yearly purchases of the American Eagle gold bullion coins totaled 341,500 ounces per year.  From 2008 to 2013 annual purchases of the gold coins have spiked by 300% to an average annual rate of 1,011,000 ounces.

After lackluster sales of gold coins in the slow months of August and September sales soared in October as investor demand for physical gold surged.  Total sales of the American Eagle gold coins for October 2013 came in at 48,500 ounces, an increase of 273% over the September total of 13,000 ounces.   October sales of gold bullion coins for the comparable prior year period totaled 59,000.

The U.S. Mint American Eagle gold bullion coins remain the premier method of building wealth through periodic purchases.  The American public can’t seem to get enough of the bullion coins and the desperate actions of global central banks to keep the financial system afloat with a deluge of paper money can only cause more financial anxiety and more gold purchases going forward.

2013 sales through October 2013

With two months still remaining in 2013, investors have already purchased almost the same amount of gold bullion coins that were sold for all of 2012.   Year to date sales of the American Eagle through October total 752,500 ounces compared to 753,000 ounces for all of 2012.


Gold Bullion U.S. Mint Sales Since 2000
         Year                           Total Ounces
2000 164,500
2001 325,000
2002 315,000
2003 484,500
2004 536,000
2005 449,000
2006 261,000
2007 198,500
2008 860,500
2009 1,435,000
2010 1,220,500
2011 1,000,000
2012 753,000
2013 752,500
 TOTAL                               8,755,000
(above 2013 totals through October 2013)

The American Eagle gold bullion coins cannot be purchased by individuals directly from the U.S Mint.  The coins are sold only to the Mint’s network of authorized purchasers who buy the coins in bulk based on the market value of gold and a markup by the U.S. Mint.  The authorized purchasers sell the gold coins to coin dealers, other bullion dealers and the public.  The Mint’s rationale for using authorized purchasers is that this method makes the coins widely available to the public with reasonable transaction costs.

gold-buffalo

The public is allowed to purchases numismatic versions of gold coins directly from the U.S. Mint.   One of the most popular numismatic gold coins is the American Buffalo, available in both one ounce gold reverse proof and one ounce gold proof.

Gold and Silver Are the Answer to Endless Fed Printing

gold-buffaloBy: GE Christenson

THE SETUP

A century ago bankers created the plan for a U.S. central bank, bought enough votes to get it passed into law, encouraged deficit spending, government debt, and extracting the interest payments from taxpayers. The process has worked well for the bankers.

After several expensive wars and the expansion of social programs the U.S. had created considerable debt. In fact, debt and the money supply had increased so much that inflation became a serious problem in the 1960s. Further, the U.S. trading partners no longer wanted dollars but wanted gold instead since they could see that dollars were being created indiscriminately and were losing their value. Nixon (August 15, 1971) did what was good for the financial industry, severed the remaining connection between the dollar and gold, allowed the money supply and debt to increase to never-seen-before levels, and planted the seeds of self-destruction for the dollar and the US economy.

THE CRASH

The process continued until 2008 when the debt and derivatives bubbles had grown so massive that the economy could no longer sustain them. The economy and stock market crashed and financial and political leaders stared “into the abyss” of deflationary collapse, reduced Wall Street income and bonuses, loss of votes, and did what they perceived as necessary: printing money, Quantitative Easing (QE), injecting liquidity, bond monetization, extend and pretend, and so on.

Courtesy: coinupdate.com

Courtesy: coinupdate.com

THE “SOLUTION”

The choice was made to “solve” an excessive debt problem by creating more debt – Quantitative Easing (QE) and increased deficit spending. Deficits were increased to a $Trillion or so per year while the government bailed out the bankers and politicians and the public watched Reality TV. It appeared to work, somewhat, for a while.

So the economy (financial industry) and government are desperate for QE, and similar to being hooked on “meth,” they find it difficult to kick the habit and get off the “drugs” of QE, money printing, and central banking. As Gold Stock Bull says,

The economy is addicted to QE and reliant on central bank stimulus to stay afloat. The world now understands that the FED cannot end the bond-buying program and has no intention of doing so anytime soon. If anything, we are likely to see increased quantitative easing in the future, just as a drug addict must up their dosage in order to have the same impact. This monetization of debt increases the bullish outlook on gold, as the gold price has historically trended higher along with the FED balance sheet.

Marc Faber and Deepcaster:

“The question is not tapering. The question is at what point will they increase the asset purchases to say $150 [billion], $200 [billion], a trillion dollars a month…”

“The Fed has boxed itself into a position where there is no exit strategy (and created) a colossal asset bubble…”

Continue QE and you get hyperinflation…”

“Halt, or even taper, QE and the markets crash.”

The picture, sans Fed propaganda, is increasingly clear. QE is necessary to supplement the financial industry and the voracious appetite of the U.S. government for more spending. Merely slowing QE will probably cause markets to crash, interest rates to rise, the government’s expense for interest on past debt will increase while tax revenues decline, and consequently the government needs more, not less, QE.

US debt to gdp

Of course there is always a way out – the “nuclear” option – let it crash and burn! But no one wants a crash as everyone will be hurt by that choice. Consequently the Fed and the U.S. government (the powers that be – TPTB) scramble desperately. What are the options?

  • More QE buys time. Less QE might well cause a crash. So TPTB choose more QE.
  • More spending keeps the big corporations (who make LARGE donations to congress) happy. If the government spends less, “everyone” complains. So TPTB choose more spending, more deficits, and more QE.
  • Higher interest rates mean that the interest expense for the U.S. government increases. More interest expense means larger deficits and so TPTB are forced to choose more QE.
  • Foreign purchases (China, Japan, Russia, etc.) of newly issued U.S. treasury debt are decreasing while some countries are actually reducing their current holdings of treasury debt. This forces the Fed to be the “buyer of last resort” and purchase, via more QE, the debt that normally would have been purchased by China, Japan, Russia and others. Fewer foreign purchases necessitate more QE.
  • A weaker economy and fewer people employed means less economic activity, diminished tax receipts and larger deficits. Those larger deficits guarantee more borrowing and more QE.
  • Obamacare will create more government expenses and less disposable income for average Americans, which means less consumer spending and therefore less tax revenue for federal, state, and local governments. There is no choice here – it is already law and we are going DOWN that road to much higher consumer costs, lower government revenue, and more government control. The result will be a government desperate for more revenue and more QE.

It does indeed look like a “QE trap.” So ask yourself:

  • More QE will weaken the dollar, on average, because more supply indicates less value for each dollar. What will that do to consumer prices for food and energy when the inevitable inflation works its way into the consumer economy?
  • What will happen to the prices for gold and silver when the realization finally hits the populace that interest rates are rising, QE is here forever, congress will never balance the budget, and the dollar will continue to weaken. (Hint: There is no fever like gold fever.)
  • It is clear that other countries increasingly dislike the U.S. dollar, U.S. treasury debt, and the current policies of the U.S. administration. How much will the prices for imported oil, gold, and silver increase as a consequence of the above?
  • What will a dollar collapse do to the prices of gold and silver?
  • Knowing the policies of the Fed, the congress, the administration, and the inevitability of QE, do you own enough gold, silver, platinum, land, diamonds, collectible art and other non-paper assets such that you can sleep well at night?

CONCLUSIONS

The U.S. government has spent itself into the “no-win” position whereby more QE is both necessary and dangerous. Most current policies, such as congressional gridlock, inability to pass a budget for five years, Obamacare, weakening economy and tax receipts, declining relations with foreign nations, massive deficits, declining total employment, inability to reduce spending, ongoing wars, probability of future wars, and more, suggest that QE must continue and probably increase.

Stocks may protect you  but gold and silver are the safer choice given the inevitability of more QE and a potential dollar collapse.

You decide!

GE Christenson
aka Deviant Investor (see full article here)

The Top 10 Biggest Gold Producing Countries in the World

pygmy-possum-coinThe Perth Mint presents a neat infographic on the world’s top 10 gold producing countries.

China, which loves gold more than anything, came in as the number one producer with annual output of 370 metric tons.  According to the latest official numbers from the IMF, China holds the world’s fifth largest reserves of gold with holdings of 33.9 million ounces.  Unofficially, many analysts say that actual gold reserves held by China are far larger than the “officially” reported numbers.

The second largest gold producer in the world is Australia (home of the Perth Mint) which produced 250 metric tons of gold in 2012.

The United States came in at third place with annual production of 230 metric tons.  As a dubious consolation for those who hate to see the U.S. come in third, keep in mind that the United States still reigns supreme in the number one spot for production of paper currency.

The Perth Mint, which has been producing gold coins since 1899 has produced (in my opinion) some of the world’s most artistic gold and silver coins.

Gold’s Bad Luck With the Number 13

red deerGold has been on a rampage since the early 2000’s with yearly gains for 12 years in a row. Nothing lasts forever and the number 13 is starting to look very unlucky for gold. Barring a major upset in the world financial system, it looks increasing likely that gold will decline in the 13th year of its long rally in the year 2013.

Bloomberg’s Julie Hyman and Michael Purves, chief global strategist at Weeden & Co. take an interesting look at the factors impacting gold prices on Bloomberg Television.

Mr. Purves notes that the “flash crash” of gold in April correlated to a stronger dollar in the first half.  The strong dollar in the first half of the year has reversed and we have seen a weaker dollar so far in the second half of the year with a rebound and stabilization in gold prices.

Further evidence of healthy consolidation in gold prices can be seen by gold’s refusal to break to new lows as was widely predicted by consensus analysts.  Mr. Purves expects that the current consolidation in gold prices is building a base for a future advance.  As to the impact of a more restrained Federal Reserve monetary policy, Mr. Purves expects any tapering to be “measured and conditional.”

A strategy recommended by Mr. Purves to take advantage of expected continued volatility in gold prices is the option strategy of selling a November 127 put on the GLD and buying the 133 call.

The consensus opinion for gold remains one of bearishness or guarded optimism – and everyone knows that when the crowd is leaning in one direction, don’t be surprised if the consensus turns out to be wrong.

Courtesy: kitco.com

Courtesy: kitco.com