April 25, 2024

New Gold and Silver Baseball Commemorative Coins Highlight Lack Of Innovation By U.S. Mint

How Congress Stifles Innovative Coin Designs By U.S. Mint

Ever wonder why the U.S. Mint shows a lack of innovation in coin design compared to other world mints?  Here’s part of the reason as detailed by Mint News Blog:

Many coin related bills are introduced each year, but only a small number become law. In order for a bill to become law, it must be passed by both the House and Senate and then signed into law by the President. Under Congressional rules, two-thirds of each body must co-sponsor a bill before it is even put up to a vote, which is the hurdle that many bills cannot meet. Another rule limits the number of commemorative coin programs to only two per year.

The most recent bill to become law was the National Baseball Hall of Fame Commemorative Coin Act. The bill H.R. 2527 was introduced on July 14, 2011, passed in the House of Representatives on October 26, 2011, passed by the Senate on July 12, 2012, and signed by the President on August 3, 2012.

The program calls for the minting and issuance of up to 50,000 $5 gold coins, 400,000 silver dollars, and 750,000 clad half dollars in recognition and celebration of the National Baseball Hall of Fame. These coins will be issued only during the one-year period beginning on January 1, 2014.

Mint New Blog goes on to discuss how the coin design will be unique with the reverse of the coin made convex and the obverse concave to enhance the resemblance to a baseball.  The coin may resemble a recently produced dome shaped coin issued by the Royal Australian Mint as shown below.
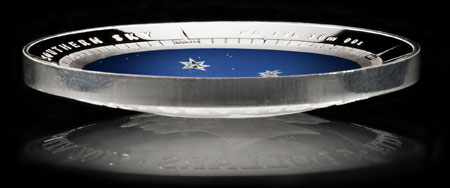
The commemorative baseball coin would represent the first innovation in coin design by the U.S. Mint since 2000 when the Library of Congress $10 coin was produced, which was the first and only US Mint bimetallic coin.  While the new baseball coin will certainly increase public interest in precious metal coins, Congress should grant the U.S. Mint more latitude to produce a wide variety of innovative coins without an onerous legislative process.
Platinum Soars $78 On Week As Bodies Pile Up In South Africa

South Africa continues to be wracked by violence as striking platinum mine workers clash with police.   In a confrontation between police and striking mine workers, a gunbattle resulted in the shooting deaths of 34 miners.
The center of the violence is at the Lonmin mine which suspended most production earlier this week when violence between rival labor unions resulted in the deaths of 10 miners.  The Lonmin mine is the world’s third largest producer of platinum.  South Africa is virtually the world’s sole source of platinum accounting for over 75% of total production.

As discussed in a previous post, the initial strike and violence at the Lonmim mine had virtually no impact on the price of platinum.  The majority of demand for platinum comes from the automobile and jewelry industries, both of which have seen weak demand due to a slowing world economy and outright recession in most of Europe.   In addition, a surplus stockpile of 4.5 million ounces of platinum, representing almost a year’s worth of demand has served to depress prices.

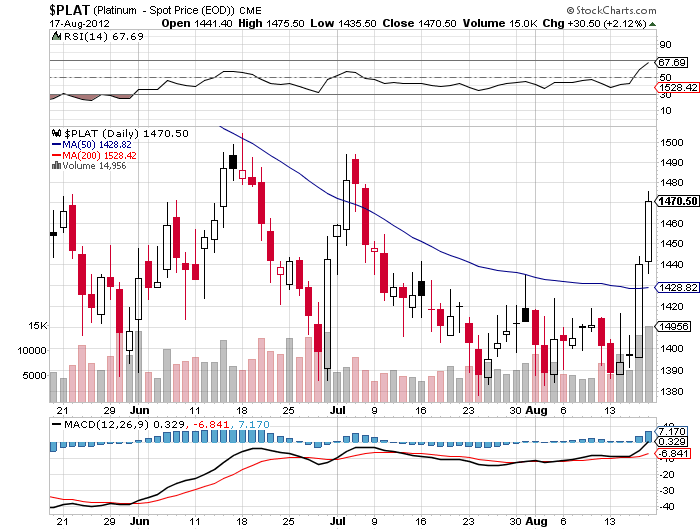
The time to buy often comes when there is no apparent reason to buy.   In “Platinum Perspectives – Time to Buy or Will The Bears Win?“, we argued that the steep $500 per ounce price decline since last year had already discounted reduced demand for platinum as well as the surplus stockpiles. Despite the apparently worsening fundamentals, platinum refused to drop decisively below $1,400 and rallied every time the price dipped below $1,400.

courtesy stockcharts.com

Even more intriguing was the fact that hedge funds had established the largest short positions is history in the futures market.  The crowd was definitely leaning in one direction.  Any news of further supply disruptions or an increase in demand for platinum would force bearish shorts to cover, resulting in sharply higher prices.  That is exactly what happened this week as fears spread that the increasing violence between police and striking platinum miners would result in further mine shutdowns.

Platinum soared by $78 on the week to close in New York trading at $1,479.

Will the unrest in South Africa spiral out of control?  As the world economy continues to get worse, social unrest has spread from one country to another resulting in toppled leaders, bloodshed and civil wars.  South Africa is a potential hotbed for social unrest and violence with a 25% unemployment rate, 50% of the population living below the poverty line and 50% of those under the age of 35 unemployed.

Prior to the violence at the Lonmin mine, miners had been on strike earlier this year for six weeks at Impala Platinum mine resulting in lost production of 120,000 ounces of platinum.  Unless the authorities and mine management can quickly contain the violence at the platinum mines, unrest could quickly spread to other mining operations and throughout South Africa.

South Africa is also a major gold producer ranking 5th in the world.  Although South African gold production recently declined to a 90 year low, annual production during 2011 was 190 tonnes, representing almost 8% of total worldwide annual gold production of about 2,500 tonnes.  South Africa’s annual production of gold declined from 400 tonnes in 2001 to only 190 tonnes in 2011, due to lower grade ore deposits and depletion of existing mines.

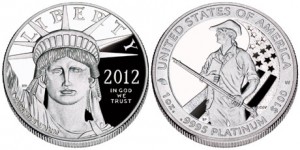
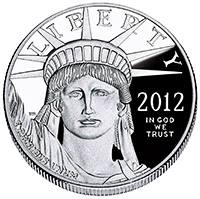
Proof American Platinum Eagles can be purchased by consumers directly from the U.S. Mint.  The U.S. Mint recently announced that production of the 2012 Proof American Platinum Eagles will be set at 15,000 coins.  The Mint has been producing the proof platinum eagle coins since 2009.  Initial pricing per coin for the Proof American Platinum Eagles was set at $1,692.

Two Masterpiece Gold and Silver Medals

Precious metal investors who have a deep appreciation for the artistry of gold and silver coins are likely to be blown away by the latest medals issued by the Royal British Mint.

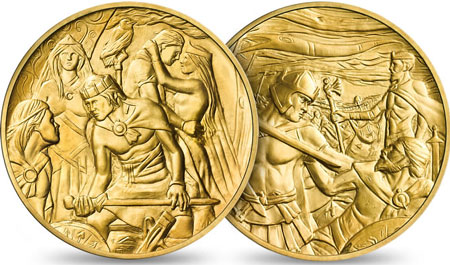
As reported by World Mint News Blog, the Royal Mint has issued two magnificent gold and silver medals that showcase the skill and craftsmanship of mint engravers.  Both coins have extremely limited mintage with the gold medal issue limit set at only 25.  The purchase price of the gold medal is £23,500.00 or $36,843.  I would expect both of these low mintage medals to be priced substantially higher in the secondary market if they ever become available for sale.

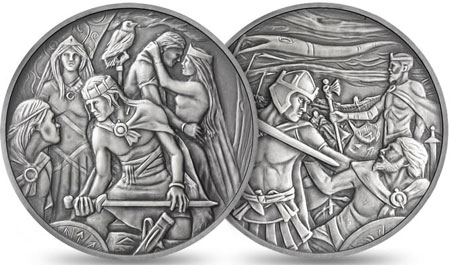
The obverse of the medal depicts Arthur as a Warrior King defeating the Saxons as Merlin stands in the background. The battlefield is shown with mist and smoke rising into the air and the dragon flags planted by the cavalry symbolizing victory. The reverse depicts Arthur as a wounded and defeated King offering his sword Excalibur to his Knight Bedivere. In the background appear Arthur’s wife Guinevere embracing Lancelot and Arthur’s half sister Morgana holding her staff with a raven atop.

Both the gold and silver medals feature the same intricate design and are struck in high relief. Both are oversized to provide a large canvas for the work. The .999 silver coin has a weight of 250 grams (8.04 troy ounces) and diameter of 80 mm. The .999 gold coin has a weight of 313 grams (10.06 troy ounces) and diameter of 65 mm.

As might be expected, these are extremely limited in mintage and premium priced. The silver medal has an issue limit of 500 and is £695.00, and the gold medal has a limit of just 25 and is priced at £23,500.00. The product pages can be found here and here.

The U.S. Mint should pay attention to the artistry of coins produced by other world mints.  Imaginative new gold and silver coin designs by the U.S. Mint would not only be appreciated by numismatists but would probably broaden investor interest in standard gold and silver bullion coins.

Platinum Perspectives – Time To Buy Or Will The Bears Win?

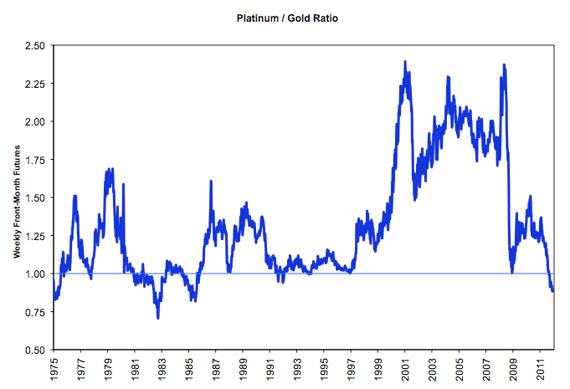
We last examined the dynamics of the platinum market in February when the platinum to gold ratio had declined to levels last seen over two and a half decades ago.

Platinum has extremely volatile price fluctuations due to the fact that 90% of platinum demand is fueled by industrial use and jewelry sales.  A weak economy can send the price of platinum plunging as was the case in 2008 when the metal lost almost two thirds of its value.   Purchases of jewelry and cars (which require platinum for catalytic converters) are two of the most readily postponed purchases by consumers during a steep recession.

Besides its traditional uses, it now seems that platinum is taking on a new role as a way to profit from further weakness in the European economy.  Bearish hedge funds are betting on further declines in platinum prices due to worsening economic conditions in Europe.   The Wall Street Journal reports that hedge funds have established the largest short positions ever in the future markets with the expectation that falling car sales will drive the price of platinum lower.   The Journal notes that new car registrations have declined by almost 8% this year.  Since almost a quarter of annual platinum demand comes from Europe, hedge fund managers have concluded that weak demand will result in lower platinum prices.

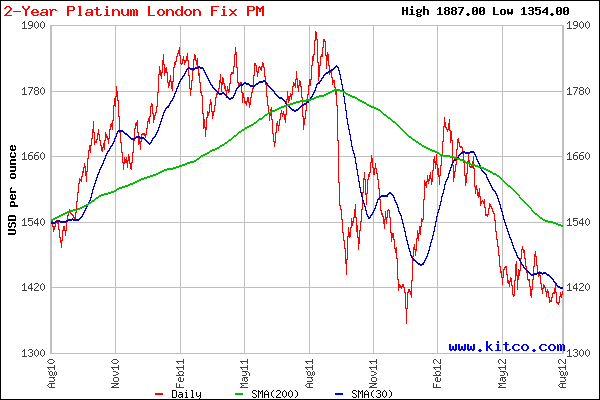
With almost everyone leaning in the same direction, will the sudden epiphany by hedge funds on platinum’s future price direction prove correct?  Europe’s deep economic problems are old news and if we examine the price charts, declining platinum demand may already be discounted.  Last summer, when Wall Street finally took serious notice of Europe’s crumbling economic prospects, the price of platinum plunged from a high of almost $1,900 to $1,354 by the end of 2011.

Courtesy: kitco.com

Here’s where the price action in platinum gets interesting.   The economy in Europe has become remarkably worse since last year, with country after country in outright depression (think Greece, Portugal, Spain) and the rest of Europe sliding into recession.  Despite the rapid deterioration of Europe’s economy during 2012, the price of platinum has not broken through the lows set last year.

Here are some pros and cons to consider before joining the bearish crowd on platinum.

  • The vast majority of platinum deposits are in South Africa and annual production is only about 30 tonnes per year.  By way of comparison, gold mining production is about 2,800 tonnes per year.
  • Investment demand for platinum constitutes only about 10% of annual demand.
  • The gold to platinum ratio is at the lowest since 1985, which may or may not mean very much.  Platinum is primarily an industrial metal whereas gold is a currency substitute or monetary metal.  Probably the only conclusion one may draw by viewing the long term platinum to gold ratio is that, on a long term basis, platinum turned out to be a good investment in the 1:1 ratio range.

  • By the time the average investor hears from the mainstream press about hedge funds betting en masse against platinum, it is probably a safe bet that you are late to the party.
  • Although platinum demand is expected to be lower than supply this year, this fact is already well known and discounted.
  • The Journal notes that Europe may at some point start to recover as the European Central Bank opens the monetary floodgates with oceans of quantitative easing.
  • Platinum is difficult and expensive to mine and at the current price, mining companies are barely breaking even.  In June, the fourth largest platinum producer, Aquarius Platinum, suspended mining operations due to low platinum prices.
  • Platinum’s lower price may encourage an increase in investor demand for a precious metal that has unique properties and is available in limited quantities.

The U.S. Mint has been producing the Proof American Platinum Eagle since 2009.  According to MintNewsBlog, the entire 2009 production of 8,000 Proof Platinum Eagles sold out in a week.  During 2010, the U.S. Mint produced 10,000 Proof Platinum coins which also quickly sold out.  During 2011, the mintage was set at 15,000 coins but the sales pace slowed considerably with pricing set at $2,092 and the coin has still not sold out with total sales of 14,760 as of the last U.S. Mint report.  On August 9th, the U.S. Mint announced that production of the 2012 Proof American  Platinum Eagles will be set at 15,000 coins.  Orders are limited to 5 per household with initial pricing at $1,692.

Gold Bullion Coin Sales Plunge 50% In July, Silver Sales Off 20%

The latest sales figures from the U.S. Mint show that sales of both gold and silver bullion coins declined dramatically during July.  While sales of silver bullion coins have remained at historically high levels, sales of the gold bullion coins have been in a steep decline since 2009.

American Eagle Gold Bullion Coin Sales

Sales of the American Eagle Gold Bullion coins during July totaled 30,500 ounces, a 49.2% decline from June sales of 60,000 ounces.  Two previous months of the year had lower gold coin sales than July.  During February 21,000 ounces of gold bullion coins were sold and in April only 20,000 ounces were sold.   The year to date average monthly sales figures for gold bullion coins total 53,428 compared to a monthly average of 83,333 during 2011.

The all time yearly sales record for the American Eagle gold bullion coins was set during 2009 when it looked as if the entire U.S. banking system was about to collapse.  Sales in each subsequent year have been lower than 2009 despite the increase in the price of gold since then.  In 2009 gold closed the year at $1,087.50 per ounce, subsequently hit a high of $1,895 on September 5, 2011 and closed today at $1,615.90 in New York trading.  If sales during 2012 are annualized, total gold bullion coin sales will reach approximately 641,000 ounces, the lowest amount since 2007 when yearly sales came in at 198,500 ounces.

Listed below are yearly sales figures for the American Eagle gold bullion coins since 2000.  Sales for 2012 are through July 31st.

Gold Bullion U.S. Mint Sales By Year
Year Total Sales Oz.
2000 164,500
2001 325,000
2002 315,000
2003 484,500
2004 536,000
2005 449,000
2006 261,000
2007 198,500
2008 860,500
2009 1,435,000
2010 1,220,500
2011 1,000,000
2012 374,000
Total 7,623,500

The graph below shows gold bullion coins sales since 2012, with sales annualized for 2012.

American Eagle Silver Bullion Coin Sales

According to the U.S. Mint, sales of the American Eagle silver bullion coins totaled 2,278,000 ounces during July, a decline of 20.3% from June’s total of 2,858,000.   The highest monthly sales of the silver bullion coins during 2012 was 6,107,000 ounces recorded in January followed by the lowest monthly sales of 1,490,000 ounces in February.  Average monthly sales of the silver bullion coins through July was 2,810,000.

The silver bullion coins have showed resilient demand despite the drop in silver prices since mid 2011.  Based on year to date sales figures, total sales of the silver bullion coins could approach 34 million ounces, not far below the record sales figure recorded in 2011 when almost 40 million ounces were sold.

Total annual sales by the U.S. Mint of the silver bullion coins since 2000 are shown below.  Sales for 2012 are year to date totals through July.

American Silver Eagle Bullion Coins
YEAR OUNCES SOLD
2000 9,133,000
2001 8,827,500
2002 10,475,500
2003 9,153,500
2004 9,617,000
2005 8,405,000
2006 10,021,000
2007 9,887,000
2008 19,583,500
2009 28,766,500
2010 34,662,500
2011 39,868,500
Jul-12 19,670,000
TOTAL 218,070,500

The American Eagle gold and silver bullion coins are sold by the U.S. Mint only to Authorized Purchasers who in turn resell the coins to the general public and other dealers.  Numismatic versions of the American Eagle series gold and silver coins can be purchased by the public directly from the U.S. Mint.

Gold Bullion Coin Sales Up 13% In June, Silver Bullion Coin Sales Remain Steady

According to the latest report from the U.S. Mint, sales of gold bullion coins increased by over 13% during June, while total sales of the silver bullion coins were essentially unchanged from May.
Monthly sales of the American Eagle gold bullion coin have fluctuated considerably during 2012 with sales reaching a monthly high of 127,000 ounces in January and a monthly low of 20,000 ounces in April.  Sales rebounded strongly in May to 53,000 ounces and continued higher in June with the sale of 60,000 ounces.

Sales of the American Eagle gold bullion coin can vary dramatically from month to month based on many factors.  The all time yearly sales record for the gold bullion coins of 1,435,000 ounces was reached in 2009  when many people feared that the financial system would collapse.  Sales volume of the gold bullion coins have not, however, had a direct correlation to the price of gold.  Gold closed 2009 at $1,087.50 per ounce and subsequently went on to hit a 2011 high of $1,895 on September 5th.  Despite the fact that gold increased by over 74% since year end 2009, total gold bullion coin sales declined in both 2010 and 2011.

If the European financial storm continues to unwind into a collapse similar to what we experienced in 2008, sales of the gold bullion coins could easily expand dramatically over the record levels seen in 2009.  With each passing day, there seem to be fewer reasons to maintain confidence in the paper money system as central bankers and governments attempt to prop up a debt burdened world economy with additional debt and money printing.

Listed below are the yearly sales of the American Eagle gold bullion coins since 2000.  The total for 2012 is through June 30th.

Gold Bullion U.S. Mint Sales By Year
Year Total Sales Oz.
2000 164,500
2001 325,000
2002 315,000
2003 484,500
2004 536,000
2005 449,000
2006 261,000
2007 198,500
2008 860,500
2009 1,435,000
2010 1,220,500
2011 1,000,000
2012 343,500
Total 7,593,000

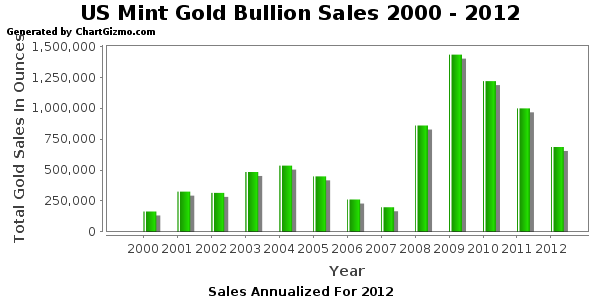
If the sales trend of American gold bullion coins continues on the pace it has been on thus far, 2012 may turn out to be the fourth year in a row of lower sales.  The graph below shows gold bullion coin sales since 2000 with figures for 2012 annualized based on sales through June 30th.

U.S. Mint sales of the American Eagle silver bullion coin continued strong in June at 2,858,000 ounces, down slightly from the May total of 2,875,000 ounces.  After a strong start in January with sales of over 6 million ounces, sales dipped below 2 million ounces in February and April.  Year to date sales through June 2012 of the silver bullion coins total 17,392,000 ounces, down by 22% from the comparable sales period in 2011 when 22,303,500 ounces were sold.

If sales of the silver bullion coins continue at the same pace for the remainder of 2012, total sales could exceed 34 million ounces, not far below the record set during 2011 of 39.9 million ounces.   Considering that silver has corrected in price from $48.70 reached during April of 2011, the volume of silver bullion coin sales is very robust, with buyers taking advantage of lower prices.

In addition to gold and silver bullion coins, the U.S. Mint sells numismatic series of both gold and silver American Eagle coins which the public can purchase directly from the U.S. Mint.  Bullion versions of the gold and silver American Eagles are only sold to Authorized Purchasers who in turn resell the product to the general public and other dealers.

Total annual U.S. Mint sales of the American Silver Eagle bullion coins since 2000 are shown below.  Sales totals for 2012 are through June 30th.

American Silver Eagle Bullion Coins
YEAR OUNCES SOLD
2000 9,133,000
2001 8,827,500
2002 10,475,500
2003 9,153,500
2004 9,617,000
2005 8,405,000
2006 10,021,000
2007 9,887,000
2008 19,583,500
2009 28,766,500
2010 34,662,500
2011 39,868,500
2012 17,392,000
TOTAL 215,792,500

Gold and Silver Bullion Coin Sales Rebound Strongly In May

According to the latest report from the U.S. Mint, sales of both gold and silver bullion coins rebounded strongly during May.
Sales of the American Gold Eagle bullion coins during April had declined to only 20,000 ounces, the lowest monthly sales since June 2008 when 15,500 ounces were sold.  During May, the U.S. Mint sold 50,000 ounces of gold bullion coins, up 150% from April sales of 20,000 ounces.

The monthly sales figures for bullion coins can vary dramatically for a number of reasons, but support for the increase in demand during May may be due to the recent pullback in gold prices.  During May, the closing London PM Fix Price for gold declined by 6.3% from $1,664 to $1,558 per ounce.  Through the end of May, gold has declined by $40 from $1,598 at the beginning of 2012.  Gold reached a 2012 high of $1,781 on February 28th.

Sales of the American Eagle gold bullion coins hit a record high during the financial turmoil of 2009 as investors eagerly purchased 1,435,000 ounces of gold.  Ironically, sales of gold declined during the next two years despite the fact that the financial system has become more unstable as sovereign governments worldwide continue to borrow and print fiat money on an unprecedented scale in an effort to prop up a world economy burdened by unsustainable debt levels and nonexistent economic growth.  The ongoing simultaneous collapse of the banking systems and economies of the Eurozone is the most obvious trigger for the next phase of the financial crisis.  As confidence in paper money evaporates, expect gold to soar as investors stampede into the only currency that governments cannot debase.

Gold Bullion U.S. Mint Sales By Year
Year Total Sales Oz.
2000 164,500
2001 325,000
2002 315,000
2003 484,500
2004 536,000
2005 449,000
2006 261,000
2007 198,500
2008 860,500
2009 1,435,000
2010 1,220,500
2011 1,000,000
2012 280,500
Total 7,530,000
Note: 2012 totals through May 31, 2012

Sales by the U.S. Mint of the American Silver Eagle bullion coins for May almost doubled from the previous month.  Total sales of  silver bullion coins for May totaled 2,750,000 ounces, up 81% from sales of 1,520,000 ounces in April.  Year to date sales of the American Silver Eagle bullion coins through May 31st came in at 14,409,000, down by 23.8% from the first five months of 2011.  Sales of the silver bullion coins reached all an all time high during 2011.   Since reaching a multi decades high of $48.70 during April of 2011, silver has since corrected, closing out the month of May 2012 at $28.10.

Total annual U.S. Mint sales of the American Silver Eagle bullion coins since 2000 are shown below.  Sales totals for 2012 are through May 31.

In addition to gold and silver bullion coins, the U.S. Mint also sells numismatic versions (uncirculated and proof) of gold and silver American Eagle coins which can be purchased by the public directly from the U.S. Mint.  Gold and silver bullion coins are sold by the U.S. Mint only to authorized purchasers who in turn resell them to the general public and secondary retailers.

American Silver Eagle Bullion Coins
YEAR OUNCES SOLD
2000 9,133,000
2001 8,827,500
2002 10,475,500
2003 9,153,500
2004 9,617,000
2005 8,405,000
2006 10,021,000
2007 9,887,000
2008 19,583,500
2009 28,766,500
2010 34,662,500
2011 39,868,500
2012 14,409,000
TOTAL 212,809,500

Gold And Silver Bullion Coin Sales Plunge In April – What Is John Q Public Thinking?

The latest sales figures from the U.S. Mint show a continuing trend of lower gold bullion coin sales. Sales of American Gold Eagle bullion coins hit an all time high in 2009 when the Mint sold 1,435,000 ounces. During 2010, sales declined to 1.2 million ounces and in 2011 only 1 million ounces of gold bullion coins were sold.
Sales of the American Gold Eagle bullion coins in April totaled only 20,000 ounces, the lowest monthly sales figure since June 2008 when 15,500 ounces were sold.  Total year to date gold bullion sales of 230,500 ounces through April 2012 are down a substantial 43% from the first four months of 2011 when the U.S. Mint sold 407,500 ounces.

If sales of the American Eagle gold bullion coins continue at their present pace, 2012 could turn out to be the fourth year in a row of declining sales.

Gold Bullion U.S. Mint Sales By Year
Year Total Sales Oz.
2000 164,500
2001 325,000
2002 315,000
2003 484,500
2004 536,000
2005 449,000
2006 261,000
2007 198,500
2008 860,500
2009 1,435,000
2010 1,220,500
2011 1,000,000
2012 230,500
Total 7,480,000
Note: 2012 totals through April 30, 2012

Total sales of the American Silver Eagle bullion coins for April 2012 totaled 1,520,000 ounces, down from 2,542,000 ounces in March.  Year to date sales of the Silver Eagle coins through April 30 totaled 11,659,000 ounces, down by 23.5% from total sales of 15,248,000 ounces in the first four months of 2011.  Sales of the American Silver Eagle bullion coins reached an all time record high of 39,868,500 ounces during 2011.

Shown below are the U.S. Mint sales figures for the American Silver Eagle bullion coins since 2000.  Sales totals for 2012 are through April 30th.

American Silver Eagle Bullion Coins
YEAR OUNCES SOLD
2000 9,133,000
2001 8,827,500
2002 10,475,500
2003 9,153,500
2004 9,617,000
2005 8,405,000
2006 10,021,000
2007 9,887,000
2008 19,583,500
2009 28,766,500
2010 34,662,500
2011 39,868,500
2012 11,659,000
TOTAL 210,059,500

The American Gold and Silver Eagle bullion coins cannot be purchased by the public directly from the U.S. Mint. Instead, the Mint sells the coins to a network of authorized purchasers who in turn resell them to the public and secondary retailers.

Sales figures shown above do not include U.S. Mint sales of gold and silver Eagle numismatic coins.  The public is allowed to purchase numismatic versions (uncirculated and proof) of gold and silver coins directly from the U.S. Mint and sales of these coins have also been declining during 2012.

According to Mint News Blog, sales of the 2011 Proof Gold Eagles declined by about 50% from 2010 and sales of the 2012 Proof Gold Eagles have declined by over 60% from the previous year.  The same trend has been seen in the proof version of the American Silver Eagle with 2012 sales down 19% through April.

There are a number of factors likely contributing to the drop off in sales. Over the past few years, the US Mint has caught up with demand for bullion coins, allowing more certainty for the numismatic offerings. The sense of urgency and pent up demand that characterized the product return in 2010 has greatly diminished. There also seems to be a shift away from precious metals in recent months, with some moving back to collector coins. Sales of the US Mint’s Gold Eagle bullion coins were down 30% in the first quarter.

Gold prices may also be having an impact in various ways. For the past two years, the Proof Gold Eagles were released in an environment of rising prices. For the current year, prices have fallen over the past two months leading up to the release. Despite this recent drop, the initial prices for this year’s offerings were higher by the equivalent of $200 per troy ounce compared to last year, possibly making affordability a factor for some collectors. Finally, some collectors may have been delaying orders in anticipation of the price decrease which will take place later today.

With the world economy on the brink of collapse in 2008, Americans decided that they needed to prepare for a financial hurricane and subsequently purchased record amounts of both gold and silver.  Perhaps the public has not noticed that a financial crisis potentially worse than 2008 (and certain to impact the U.S. economy) is brewing “across the pond” with European governments and banks tottering on the brink of insolvency and many countries already in full blown depressions.

With the global economy drowning in debt and facing unprecedented financial problems, it is almost comical that many Americans are avoiding the only asset class able to preserve their wealth.

Gold and Silver Bullion Coin Sales Rise In March

Production figures from the U.S. Mint for March show a sharp increase in the sale of both gold and silver bullion coins from the previous month.

Total sales of the American Gold Eagle bullion coins increased in March to 62,500 ounces, up from 21,000 ounces in February.  Total sales of the American Silver Eagle bullion coins totaled 2,542,000 ounces in March, up from 1,490,000 ounces in February.  Sales of both bullion coins for the first quarter of 2012, however, declined from the prior year.

Sales of the American Gold Eagle bullion coins totaled 210,500 ounces for the first quarter of 2012, down 29.7% from the 299,500 ounces sold in the first quarter of 2011.  Total sales of the American Silver Eagle bullion coins amounted to 10,139,000 ounces during the first quarter of 2012, down by 18.4% from the 12,429,000 ounces sold in the prior year’s first quarter.

The all time record year for sales of the American Gold Eagle bullion coins occurred in 2009 with 1,435,000 ounces sold.  The all time high record for sales of the American Silver Eagle bullion coins was in 2011 when a total of 39,868,500 one ounce coins were sold.

Gold Bullion U.S. Mint Sales By Year
Year Total Ounces Sold
2000 164,500
2001 325,000
2002 315,000
2003 484,500
2004 536,000
2005 449,000
2006 261,000
2007 198,500
2008 860,500
2009 1,435,000
2010 1,220,500
2011 1,000,000
2012 210,500
Total 7,460,000
Note: 2012 totals through March 31, 2012

The amount of physical gold bullion purchased purchased from the U.S. Mint over the past 12 years remains relatively small compared to the amount of gold invested in the two largest gold trust ETFs.  The SPDR Gold Shares ETF (GLD) is the world’s largest physically backed gold exchange traded ETF fund with current holdings of 41.4 million ounces of gold.  The iShares Gold Trust ETF (IAU) currently holds 6.2 million ounces of gold.

The total sales of gold and silver bullion coins detailed above do not include U.S. Mint gold and silver numismatic coin sales which are directly sold to the public.  American Gold and Silver Eagle bullion coins are only sold to a network of authorized purchasers  who in turn resell the coins to secondary retailers and the public.  The U.S. Mint decided that using  Authorized Purchasers to sell gold and silver bullion coins to the public was the most efficient means of selling the coins to the public at competitive prices.

Shown below are the U.S. Mint sales figures for the American Silver Eagle bullion coins since 2000.  Sales totals for 2012 are through March 31st.

American Silver Eagle Bullion Coins
YEAR OUNCES SOLD
2000 9,133,000
2001 8,827,500
2002 10,475,500
2003 9,153,500
2004 9,617,000
2005 8,405,000
2006 10,021,000
2007 9,887,000
2008 19,583,500
2009 28,766,500
2010 34,662,500
2011 39,868,500
2012 10,139,000
TOTAL 208,539,500

U.S. Treasury Wants To Eliminate The Only Currency That Still Has Intrinsic Value

News that Canada will stop production of the penny has fueled speculation that the United States will also eliminate production or change the composition of both the penny and the nickel.  According to Bloomberg, Canada will withdraw the penny from circulation this year due to high production and transaction costs.  The Canadian penny currently costs 1.6 cents to produce.

The Royal Canadian Mint, which has produced 35 billion pennies since it began production in 1908, will cease distribution this fall due to the coin’s low purchasing power. Production and handling cost for the one-cent coin are a C$150- million drag on the economy, according to a 2006 study by Desjardins, a Levis, Quebec-based financial institution.

“Pennies take up too much space on our dressers at home,” Finance MinisterJim Flaherty said in the text of his budget speech in Ottawa. “They take up far too much time for small businesses trying to grow and create jobs.”

A story in the Wall Street Journal (Treasury to Cut Cost By Remaking Coins) seemed to suggest that a change in the composition of both the penny and the nickel were imminent.

Treasury Secretary Tim Geithner outlined how his department will find savings, including $286 million in the next fiscal year, by changing the materials that go into coins, replacing paper with electronic communications and consolidating internal agencies.

“Currently, the costs of making the penny and the nickel are more than twice the face value of each of those coins,” Geithner said in his remarks.

Treasury Secretary Geithner, in testimony to Congress this week, further pressed the argument that the penny and nickel should be made with cheaper materials.

The Budget also proposes legislation to provide Treasury with the ability to change the composition of coins to utilize more cost-effective materials.  Currently, the costs of making the penny and the nickel are more than twice the face value of each of those coins.  In addition to this proposal, Treasury is implementing measures to improve the efficiency of coin and currency production, including improved manufacturing practices and administrative cost reductions, which will save more than $75 million in FY 2013.

Is the long and rich history of the penny and nickel about to disappear from the American landscape?  It may not happen as soon as some seem to think.  Obama’s 2013 budget proposal was resoundingly rejected by Congress along with the request to  transfer authority over coinage composition from Congress to the Treasury.  According to Coin Update,

President Obama’s recently submitted 2013 Budget includes a proposal to provide the United States Mint with greater flexibility in the material composition of circulating coins. Specifically, the Budget seeks to enable the Treasury Department to explore, analyze, and approve new, less expensive metals for all circulating coins.

Currently, the authority to establish the composition of coins rests with Congress. In December 2010, the Coin Modernization, Oversight, and Continuity Act of 2010 was signed into law, which provided the Secretary of the Treasury with the authority conduct research and development activities for alternative metallic coinage materials. Within a required report due to Congress by December 2012, the Secretary may make recommendations for changes to the composition for circulating coins, however any changes would still need to be accomplished through an act of Congress. By contrast, the proposal included in the 2013 Budget would bypass Congress and provide the Secretary with direct authority to alter coin compositions.

The Budget provides justification for the change based on “volatile metal prices” which have contributed to negative margins on both the penny and nickel. During the 2011 fiscal year, the United States Mint’s unit cost to produce and distribute the cent was 2.41 cents and the unit cost for the nickel was 11.18 cents.

Since 2006, it has cost the US Mint more than the respective face value to produce the cent and the nickel. In the latest fiscal year, the losses generated from producing cents and nickels was $116.70 million. Since 2006, total losses from producing the two denominations has reached $359.80 million.

As a monetary unit, the penny and nickel are relics of the past, costly to produce and almost irrelevant as a unit of value.  Nonetheless, the penny and the nickel represent the only remaining general circulation U.S. “money” that still has an intrinsic value based on the metal content.  If Congress decides to retain their control over the composition of U.S. coins, Mr. Geithner may never get his chance to debase the penny and nickel.