April 26, 2024

The Hard Facts About Gold, the Fed, and the U.S. Government

gold & barLet’s back away from the “smaller” questions like:

  • Will the Fed taper or not?
  • Is Obamacare a disaster or just a huge problem?
  • Is the S&P 500 index due for a correction?
  • Is the U.S. economy improving?
  • Why is most of the rest of the world angry with the U.S.?
  • If inflation is so low, why are my expenses increasing so rapidly?
  • Is the NSA spying on everyone’s cell phone and computer?

Let’s look at the really big picture!

  • The Fed wants higher stock prices. The Fed serves the needs of the wealthy and the wealthy have a large chunk of their wealth invested in stocks.
  • The Fed wants low interest rates, which keep bond prices high, because the wealthy are heavily invested in bonds.
  • The Fed and the U.S. government need low interest rates so the U.S. government’s debt service costs remain low, real estate is attractive, credit is inexpensive, and investors are forced to reach for yield, buy stocks, and maintain the bond and dollar bubbles.
  • The U.S. government wants to spend money, lots of money, and avoid the consequences. Congress lives to buy votes, increase their power, and collect “contributions.” Lobbyists want a piece of the action for themselves. Corporations want to “influence” legislation to increase their profits. Business as usual. Spend. Spend. Spend!
  • Central banks, especially the Fed, and western governments want lower gold prices, so their unbacked paper money still appears valuable, so the U.S. dollar retains relative value against other currencies, and so the world will continue sending goods and commodities to the U.S. in exchange for paper dollars and T-bonds.

Can the Fed and the U.S. government manage the markets to achieve low interest rates, higher stocks, low inflation, low gold prices, and a strong dollar, all while spending much more than revenues support and thereby running the national debt up to insane levels? My assessment is NO!

What does the data indicate?

  1. Assume that the world changed around the 9th month of 2001. Stocks had peaked and crashed, the Twin Towers came down, government expanded, and the U.S. declared a War on Terror. There were bubbles to be inflated, massive debts to be incurred, no-bid contracts to be awarded, huge profits to be generated, and stories to tell.
  2. Assume that the spending, increasing debt, bubble blowing, and military-industrial profit generating machine have been operating more intensely since 2001.
  3. Assume that “this time is NOT different” and that our current fiscal and monetary trends will continue for several more years.

Gold and the S&P 500 Index

american-gold-eagle

Graph 1 shows 25 years of the smoothed* monthly price of gold divided by the smoothed value of the S&P 500 index. The ratio went down from the 1980s to about 2001 and rose thereafter. Until 2001 investors wanted financial assets more than real assets like gold and silver. Since then the price of gold has risen more rapidly than the S&P 500 index. The Fed wants the S&P to keep rising and so we should expect QE will continue in the hope that it will levitate the stock markets. Unless this time is different, gold will continue to rise.

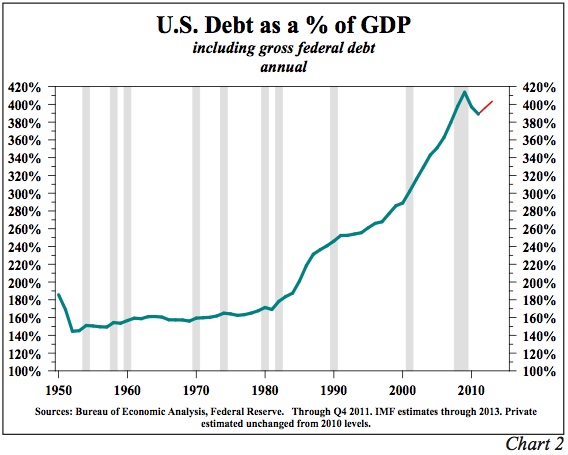
Gold and the National Debt

Graph 2 shows 25 years of the smoothed* monthly price of gold divided by the official national debt in tens of $Billions. The ratio went down from the 1980s to about 2001 and then started rising. Even though debt has been increasing rapidly since 9-11, the price of gold has increased even more rapidly since its bear market lows in 1999/2001. Knowing that politicians, corporations, and banks need the spending and debt to continue increasing, we should expect massive deficits and ever-increasing national debt – growing about 10 – 12% per year. Unless this time is different, gold will also continue to rise.

Gold and the Dollar Index

Graph 3 shows 25 years of the dollar index multiplied by smoothed monthly gold prices. In broad terms a higher dollar usually goes with lower gold prices (when priced in dollars) and vice-versa. The product removes most of the currency variation and shows the big picture trend for gold. Since about 2001 the trend has been upward. Unless this time is different, gold will continue to rise.

The Fed has incentive to continue QE – to levitate the stock and bond markets and keep interest rates low. But QE will eventually weaken the dollar with excess supply, reduced demand and reduced value. Expect gold to rise in price.

The politicians want to spend money, lots of money, and will borrow and print until they can’t. The national debt and the price of gold will increase.

Summary

Unless the financial world has materially changed, we can expect that an increasing S&P index will correlate with higher gold prices, and an increasing national debt will correlate with higher gold prices. Similarly, continued QE will correlate with a lower dollar and higher gold prices.

They say “don’t fight the Fed” and “don’t fight the administration.” Even if it looks like a train wreck during amateur hour, the incentives motivating both the Fed and the government all align with higher gold prices.

Maybe the Fed and the politicians can’t get everything they want, but we expect they will be happy with strong bond prices, higher stock prices, and more spending. Those conditions will co-exist with higher gold prices. Consequently we expect the Fed and the politicians understand that the price of gold must go much higher. Sacrifices, such as higher gold prices, must be made to maintain the “full steam ahead” status of our national train wreck in progress – deficit spending, ever-increasing debt, QE-forever, more wars and currency debasement.

Do you own a sufficient quantity of physical gold and silver?

More Thoughts:
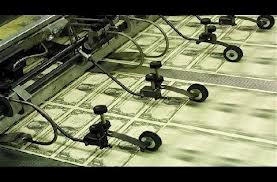
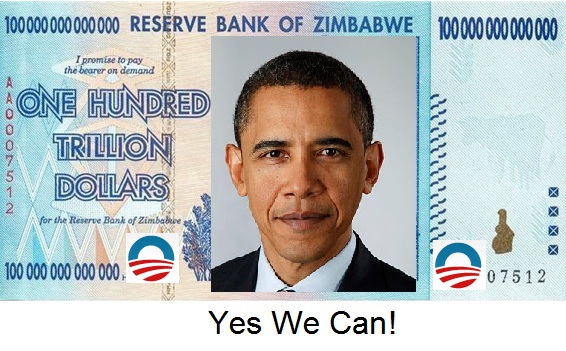
Created Currencies…Are NOT GOLD

GE Christenson
aka Deviant Investor

U.S. Mint Gold Coin Sales Soar 273% in October

gold-bullion
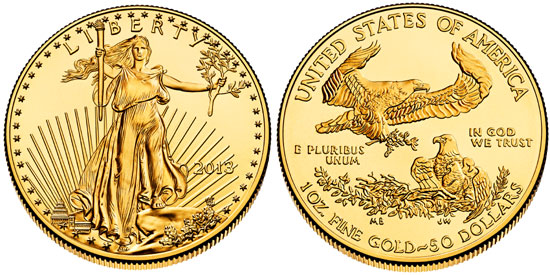
Although sales totals vary from month to month, annual sales of the U.S. Mint American Eagle gold bullion coins are running at triple the levels prior to 2008 when the wheels came off the world financial system and central banks began an orgy of money printing.

From 2000 to 2007 the average yearly purchases of the American Eagle gold bullion coins totaled 341,500 ounces per year.  From 2008 to 2013 annual purchases of the gold coins have spiked by 300% to an average annual rate of 1,011,000 ounces.

After lackluster sales of gold coins in the slow months of August and September sales soared in October as investor demand for physical gold surged.  Total sales of the American Eagle gold coins for October 2013 came in at 48,500 ounces, an increase of 273% over the September total of 13,000 ounces.   October sales of gold bullion coins for the comparable prior year period totaled 59,000.

The U.S. Mint American Eagle gold bullion coins remain the premier method of building wealth through periodic purchases.  The American public can’t seem to get enough of the bullion coins and the desperate actions of global central banks to keep the financial system afloat with a deluge of paper money can only cause more financial anxiety and more gold purchases going forward.

2013 sales through October 2013

With two months still remaining in 2013, investors have already purchased almost the same amount of gold bullion coins that were sold for all of 2012.   Year to date sales of the American Eagle through October total 752,500 ounces compared to 753,000 ounces for all of 2012.


Gold Bullion U.S. Mint Sales Since 2000
         Year                           Total Ounces
2000 164,500
2001 325,000
2002 315,000
2003 484,500
2004 536,000
2005 449,000
2006 261,000
2007 198,500
2008 860,500
2009 1,435,000
2010 1,220,500
2011 1,000,000
2012 753,000
2013 752,500
 TOTAL                               8,755,000
(above 2013 totals through October 2013)

The American Eagle gold bullion coins cannot be purchased by individuals directly from the U.S Mint.  The coins are sold only to the Mint’s network of authorized purchasers who buy the coins in bulk based on the market value of gold and a markup by the U.S. Mint.  The authorized purchasers sell the gold coins to coin dealers, other bullion dealers and the public.  The Mint’s rationale for using authorized purchasers is that this method makes the coins widely available to the public with reasonable transaction costs.

gold-buffalo

The public is allowed to purchases numismatic versions of gold coins directly from the U.S. Mint.   One of the most popular numismatic gold coins is the American Buffalo, available in both one ounce gold reverse proof and one ounce gold proof.

Gold and Silver Are the Answer to Endless Fed Printing

gold-buffaloBy: GE Christenson

THE SETUP

A century ago bankers created the plan for a U.S. central bank, bought enough votes to get it passed into law, encouraged deficit spending, government debt, and extracting the interest payments from taxpayers. The process has worked well for the bankers.

After several expensive wars and the expansion of social programs the U.S. had created considerable debt. In fact, debt and the money supply had increased so much that inflation became a serious problem in the 1960s. Further, the U.S. trading partners no longer wanted dollars but wanted gold instead since they could see that dollars were being created indiscriminately and were losing their value. Nixon (August 15, 1971) did what was good for the financial industry, severed the remaining connection between the dollar and gold, allowed the money supply and debt to increase to never-seen-before levels, and planted the seeds of self-destruction for the dollar and the US economy.

THE CRASH

The process continued until 2008 when the debt and derivatives bubbles had grown so massive that the economy could no longer sustain them. The economy and stock market crashed and financial and political leaders stared “into the abyss” of deflationary collapse, reduced Wall Street income and bonuses, loss of votes, and did what they perceived as necessary: printing money, Quantitative Easing (QE), injecting liquidity, bond monetization, extend and pretend, and so on.

Courtesy: coinupdate.com

Courtesy: coinupdate.com

THE “SOLUTION”

The choice was made to “solve” an excessive debt problem by creating more debt – Quantitative Easing (QE) and increased deficit spending. Deficits were increased to a $Trillion or so per year while the government bailed out the bankers and politicians and the public watched Reality TV. It appeared to work, somewhat, for a while.

So the economy (financial industry) and government are desperate for QE, and similar to being hooked on “meth,” they find it difficult to kick the habit and get off the “drugs” of QE, money printing, and central banking. As Gold Stock Bull says,

The economy is addicted to QE and reliant on central bank stimulus to stay afloat. The world now understands that the FED cannot end the bond-buying program and has no intention of doing so anytime soon. If anything, we are likely to see increased quantitative easing in the future, just as a drug addict must up their dosage in order to have the same impact. This monetization of debt increases the bullish outlook on gold, as the gold price has historically trended higher along with the FED balance sheet.

Marc Faber and Deepcaster:

“The question is not tapering. The question is at what point will they increase the asset purchases to say $150 [billion], $200 [billion], a trillion dollars a month…”

“The Fed has boxed itself into a position where there is no exit strategy (and created) a colossal asset bubble…”

Continue QE and you get hyperinflation…”

“Halt, or even taper, QE and the markets crash.”

The picture, sans Fed propaganda, is increasingly clear. QE is necessary to supplement the financial industry and the voracious appetite of the U.S. government for more spending. Merely slowing QE will probably cause markets to crash, interest rates to rise, the government’s expense for interest on past debt will increase while tax revenues decline, and consequently the government needs more, not less, QE.

US debt to gdp

Of course there is always a way out – the “nuclear” option – let it crash and burn! But no one wants a crash as everyone will be hurt by that choice. Consequently the Fed and the U.S. government (the powers that be – TPTB) scramble desperately. What are the options?

  • More QE buys time. Less QE might well cause a crash. So TPTB choose more QE.
  • More spending keeps the big corporations (who make LARGE donations to congress) happy. If the government spends less, “everyone” complains. So TPTB choose more spending, more deficits, and more QE.
  • Higher interest rates mean that the interest expense for the U.S. government increases. More interest expense means larger deficits and so TPTB are forced to choose more QE.
  • Foreign purchases (China, Japan, Russia, etc.) of newly issued U.S. treasury debt are decreasing while some countries are actually reducing their current holdings of treasury debt. This forces the Fed to be the “buyer of last resort” and purchase, via more QE, the debt that normally would have been purchased by China, Japan, Russia and others. Fewer foreign purchases necessitate more QE.
  • A weaker economy and fewer people employed means less economic activity, diminished tax receipts and larger deficits. Those larger deficits guarantee more borrowing and more QE.
  • Obamacare will create more government expenses and less disposable income for average Americans, which means less consumer spending and therefore less tax revenue for federal, state, and local governments. There is no choice here – it is already law and we are going DOWN that road to much higher consumer costs, lower government revenue, and more government control. The result will be a government desperate for more revenue and more QE.

It does indeed look like a “QE trap.” So ask yourself:

  • More QE will weaken the dollar, on average, because more supply indicates less value for each dollar. What will that do to consumer prices for food and energy when the inevitable inflation works its way into the consumer economy?
  • What will happen to the prices for gold and silver when the realization finally hits the populace that interest rates are rising, QE is here forever, congress will never balance the budget, and the dollar will continue to weaken. (Hint: There is no fever like gold fever.)
  • It is clear that other countries increasingly dislike the U.S. dollar, U.S. treasury debt, and the current policies of the U.S. administration. How much will the prices for imported oil, gold, and silver increase as a consequence of the above?
  • What will a dollar collapse do to the prices of gold and silver?
  • Knowing the policies of the Fed, the congress, the administration, and the inevitability of QE, do you own enough gold, silver, platinum, land, diamonds, collectible art and other non-paper assets such that you can sleep well at night?

CONCLUSIONS

The U.S. government has spent itself into the “no-win” position whereby more QE is both necessary and dangerous. Most current policies, such as congressional gridlock, inability to pass a budget for five years, Obamacare, weakening economy and tax receipts, declining relations with foreign nations, massive deficits, declining total employment, inability to reduce spending, ongoing wars, probability of future wars, and more, suggest that QE must continue and probably increase.

Stocks may protect you  but gold and silver are the safer choice given the inevitability of more QE and a potential dollar collapse.

You decide!

GE Christenson
aka Deviant Investor (see full article here)

The Top 10 Biggest Gold Producing Countries in the World

pygmy-possum-coinThe Perth Mint presents a neat infographic on the world’s top 10 gold producing countries.

China, which loves gold more than anything, came in as the number one producer with annual output of 370 metric tons.  According to the latest official numbers from the IMF, China holds the world’s fifth largest reserves of gold with holdings of 33.9 million ounces.  Unofficially, many analysts say that actual gold reserves held by China are far larger than the “officially” reported numbers.

The second largest gold producer in the world is Australia (home of the Perth Mint) which produced 250 metric tons of gold in 2012.

The United States came in at third place with annual production of 230 metric tons.  As a dubious consolation for those who hate to see the U.S. come in third, keep in mind that the United States still reigns supreme in the number one spot for production of paper currency.

The Perth Mint, which has been producing gold coins since 1899 has produced (in my opinion) some of the world’s most artistic gold and silver coins.

Gold’s Bad Luck With the Number 13

red deerGold has been on a rampage since the early 2000’s with yearly gains for 12 years in a row. Nothing lasts forever and the number 13 is starting to look very unlucky for gold. Barring a major upset in the world financial system, it looks increasing likely that gold will decline in the 13th year of its long rally in the year 2013.

Bloomberg’s Julie Hyman and Michael Purves, chief global strategist at Weeden & Co. take an interesting look at the factors impacting gold prices on Bloomberg Television.

Mr. Purves notes that the “flash crash” of gold in April correlated to a stronger dollar in the first half.  The strong dollar in the first half of the year has reversed and we have seen a weaker dollar so far in the second half of the year with a rebound and stabilization in gold prices.

Further evidence of healthy consolidation in gold prices can be seen by gold’s refusal to break to new lows as was widely predicted by consensus analysts.  Mr. Purves expects that the current consolidation in gold prices is building a base for a future advance.  As to the impact of a more restrained Federal Reserve monetary policy, Mr. Purves expects any tapering to be “measured and conditional.”

A strategy recommended by Mr. Purves to take advantage of expected continued volatility in gold prices is the option strategy of selling a November 127 put on the GLD and buying the 133 call.

The consensus opinion for gold remains one of bearishness or guarded optimism – and everyone knows that when the crowd is leaning in one direction, don’t be surprised if the consensus turns out to be wrong.

Courtesy: kitco.com

Courtesy: kitco.com

Marc Faber’s Surprising Gold Forecast

remembranceIn an interview with Barron’s, Marc Faber, editor of The Gloom, Boom & Doom report gives his take on where the gold market is headed and why certain investments related to gold might be very risky.

Marc Faber, never at a loss for a good soundbite, says gold is “in a correction mode” but seemed at a loss to explain why gold has dropped by over $400 per ounce over the past two years.

Faber talks about the paradox of weak physical gold prices even as demand for physical gold remains robust.  Although gold has declined in price and commentary on the gold market is extremely bearish, Faber notes that countries such as China is buying 2,600 tons of gold per year “which exceeds annual production.”  The gold market is currently in a “bottoming out process” and gold will see higher prices in the future according to Faber.

Courtesy: kitco.com

Courtesy: kitco.com

Many of the senior gold mining stocks represent good values but in a surprising comment Faber warns investors that many exploration companies “won’t make it so buy companies with cash reserves.”  Current gold prices mean that “few projects will get done.”  Faber’s bearish commentary on the smaller exploration companies seems to imply that he does not foresee a rapid short term recovery in the price of gold.

With central banks printing money at a rate that would have been unimaginable five years ago and huge demand for physical gold in Asia, the price of gold may recover to new highs faster than Faber expects.

Selling Climax in Gold and Silver Stocks Is a Classic Buy Signal

chart
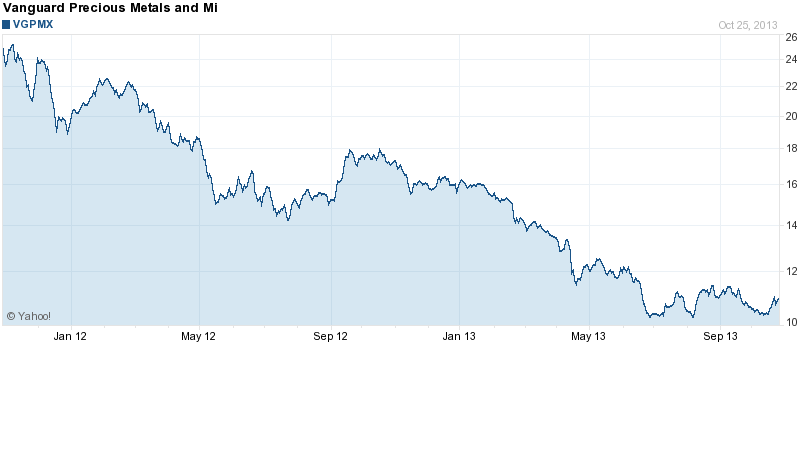
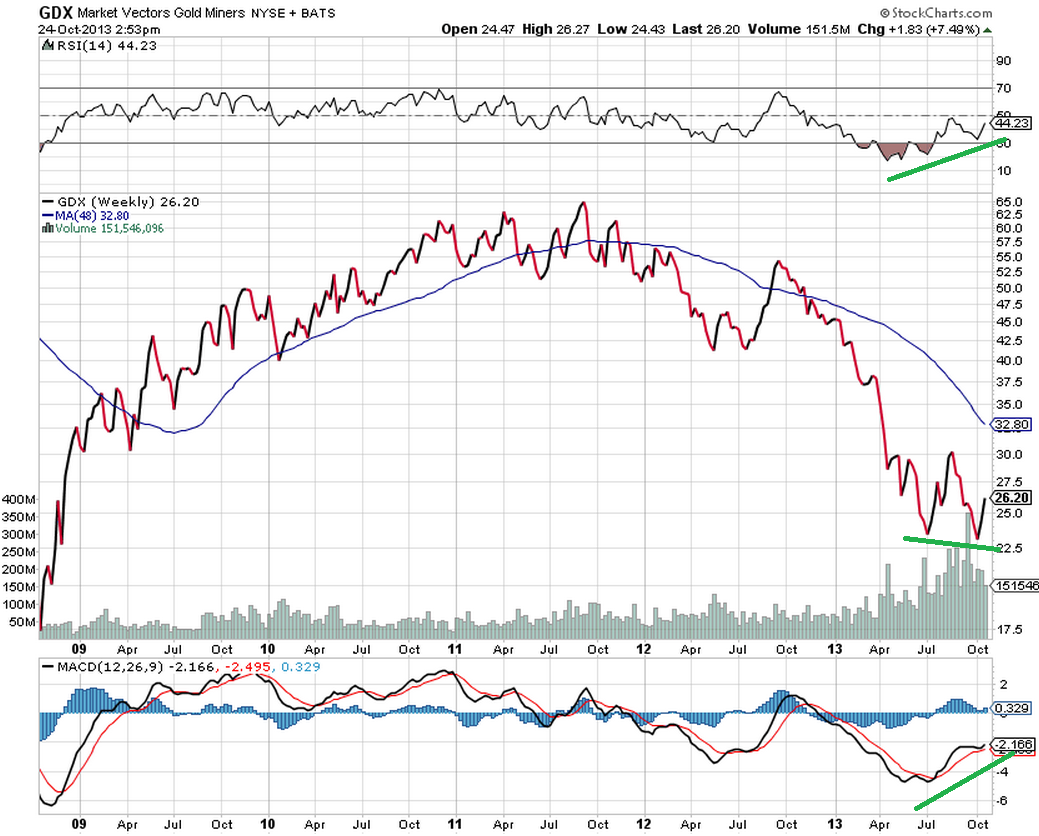
The bear case for gold and silver stocks is well known and investors have reacted by dumping mining stocks indiscriminately.  The staggering decline in gold and silver stocks over the past two years now exceeds the decline that occurred during the crash of 2008 when the financial system was at the brink of collapse.
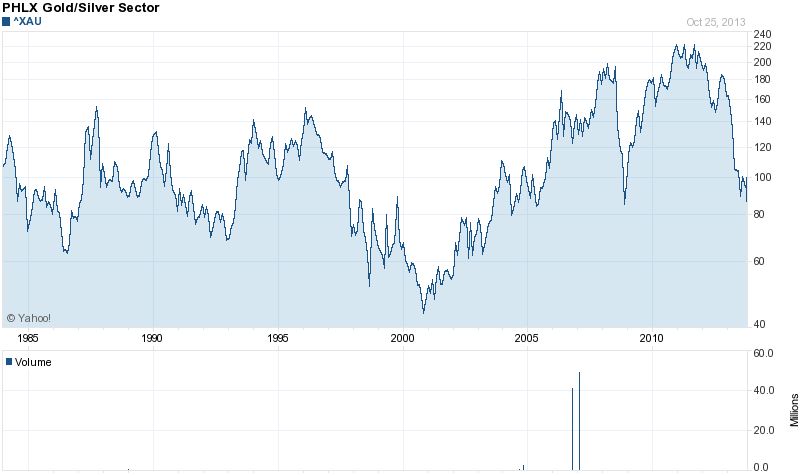
The Philadelphia Gold and Silver Index (XAU) is an index comprised of sixteen major precious metal mining companies. During the crash of 2008 the XAU declined by 58.5%.  From the peak of 226.58 in December 2010 to the low of 90.15 in June 2013, the XAU has collapsed by 60.2%.

Courtesy Yahoo Finance

Courtesy Yahoo Finance

Has the sell off of the past two years been so extreme as to constitute a selling climax which usually signals a major reversal from the lows?  According to John J. Murphy, an acknowledged technical analyst, a selling climax is “usually a dramatic turnaround at the bottom of a down move where all the discouraged longs have finally been forced out of the market on heavy volume.  The subsequent absence of selling pressure creates a vacuum over the market, which prices quickly rally to fill.”

It is too early to tell if prices have reached a capitulation bottom but investors who haven’t sold out positions in the precious metal miners after a 60% decline are probably thinking more about buying than selling.  Another factor that impedes future selling is the fact that investors are now getting paid to wait for a turnaround in the mining industry.

Historically, precious metal miners have never paid out large dividends but this metric has changed.  The stock price declines in  senior gold and silver producers have been so severe that the dividend yields on some gold mutual funds now approaches 4%.

The $2.4  billion Vanguard Precious Metals and Mining fund (VGPMX) currently yields 3.76% and holds a well diversified portfolio of seasoned mining companies.  The Vanguard fund holds investments in both domestic and foreign companies involved in activities related to gold, silver, platinum, diamonds, and rare minerals.

The chart on VGPMX looks like a reason for precious metal investors to commit suicide but if a selling climax has occurred, the losses of the past two years may be quickly recouped.  In addition, the chart of the Vanguard fund has made a triple bottom over the past six months.

VGPMX

Courtesy: Yahoo Finance

Another classic sign of a bottom in precious metal stocks was discussed by Mebane Faber who has drawn an analogy to the bottom of stock prices in early 2009 to the current chart of the Market Vectors Gold Miners (GDX).  In 2009 the S&P 500 kept hitting new lows even as the RSI and the MACD were making higher lows which is a classic bull signal.  A similar situation exists today with the GDX.

Courtesy: mebanefaber.com

Courtesy: mebanefaber.com


Global Debt Bubble Will Push Gold and Silver Prices Higher

money printingBy: GE Christenson

To paraphrase William Shakespeare, “the debt ceiling drama is a tale told by idiots, full of sound and political fury, signifying nothing.” We now have a reprieve for three months – the 11th hour deal, complete with payoffs and the usual corruption, will keep the world safe for more ineptitude, deficit spending, administrative hypocrisy and the guarantee of a sequel. All is well! Celebration! Champagne! Cut to a prime-time commercial promoting big government and Obamacare…

And back in the real world where people work and support their families, life goes on, few noticed the lack of government “services,” and in three months we will be blessed with another episode of our “Congressional Reality Show.”

Gold, Silver, and National Debt

Examine the following graph. It is a graph of smoothed* annual gold and silver prices and the official U.S. national debt since 1971 when the dollar lost all gold backing and was “temporarily” allowed to float against all other unbacked debt based currencies. All values start at 1.0 in 1971.

The legend does not show which line represents gold, silver, or the national debt. Why? Because it hardly matters! Government spends too much money to perform a few essential services and to buy votes, wars, and welfare, and thereby increases its debt almost every year, while gold and silver prices, on average, match the increases in accumulated national debt.

Our 435 representatives, 100 senators, and the administration listened to their corporate backers and chose to increase the debt ceiling, continue spending as usual, not “rock the boat,” and carry on with the serious business of politics and payoffs for another three months. It is safe to say that, on average, gold and silver will continue rising, along with the national debt, as they all have for the past 42 years. Further, like the national debt, both gold and silver (and probably most consumer prices) will increase substantially from here, until some traumatic “reset” occurs. What sort of reset?

  • A “black swan” event that is unpredictable, by definition.
  • Middle East war escalation.
  • Derivative melt-down.
  • A dollar collapse when foreigners say “enough” to the dollar debasement policies pursued by the Fed and the US government.
  • A collapse of the Euro or Yen for any number of reasons.
  • A banker admits that most of the official gold supposedly held in New York, London, and Fort Knox is gone and has been sold to China, India, and Russia.
  • You name the false flag operation.

My guess: Gold and silver prices will rise gradually for a while, and then quite rapidly after one of the above “financial icebergs” smashes into our “Titanic” world monetary system. Further, we will have difficulty locating physical gold available for sale after such an event occurs, even at much higher prices. Now would be a good time to purchase physical gold and silver for storage in a secure storage facility. Paper gold will not be safe…

Congress has acted. The President has spoken. The Federal Reserve will continue “printing” dollars to increase banker profitability, fund the government, and fight the forces of deflation. This is business as usual – as it has been for the past 42 years.

Here is the second version of the graph with gold, silver, and national debt labeled. Note how relatively undervalued silver is at the present time! Dashed lines indicate guesses for the future normalized values for gold, silver, and the national debt.

The debt ceiling drama and “Congressional Reality Show” will return to prime time in January and February, right after “Dancing with the Senators” and just before “House Wives of Salt Lake City.” Expect sound and fury signifying nothing.

Further commentary on the case for gold and silver:

The Reality of Gold and the Nightmare of Paper Silver: The Noise is Deafening
GE Christenson
aka Deviant Investor

* Gold and silver prices were smoothed by taking monthly closing prices and a 24 month simple moving average. Annual prices graphed are the average of the 12 average monthly prices per year.

The Term “Easy Janet” Is About to Become Part of the American Lexicon

By: Axel Merk

courtesy: www.michaelianblack.net

courtesy: www.michaelianblack.netBy: Axel Merk

While Democrats and Republicans fight with water pistols, the President may be readying a bazooka by nominating Janet Yellen to succeed Ben Bernanke as Fed Chair. You may want to hold on to your wallet; let me explain.

Our reference to water pistols refers to our assessment that bickering over discretionary spending is distracting from the real issue, entitlement reform. For details as to what we believe will happen if we don’t get entitlement reform done, please read our recent Merk Insight “The Most Predictable Economic Crisis”.

Bernanke Fed

Central banks in developed countries are generally considered independent, even if their members are appointed by politicians. In the U.S., however, there’s an added element: aside from a mandate for price stability, the Federal Reserve is tasked with promoting maximum sustainable employment. This simple concept might have been put in place with the best of intentions – who wouldn’t want to have maximum employment? Central banks that have a single focus on price stability, such as the European Central Bank, point out that the best way to foster sustainable growth is by keeping inflation low. The U.S., even with an employment mandate, had pursued the same practice.

That is, until Ben Bernanke appeared to run out of options to lower borrowing costs. Bernanke’s frame of reference had been the Great Depression; he had frequently cautioned that the biggest mistake during the Great Depression was to raise interest rates too early. After a credit bust, as central banks push against deflationary market forces, premature tightening might undo the progress to reflate the economy. In today’s world, it’s not just short term, but also longer-term interest rates that Bernanke has been concerned about – partially because Bernanke has always considered it important to keep mortgage rates low. To achieve his goal, the Bernanke Fed:

  • Talked down interest rates;
  • Lowered interest rates;
  • Purchased Treasury and Mortgage-Backed Securities
  • Engaged in Operation Twist
  • Introduced an employment target

Introducing an employment target was nothing but an extension of existing policies, as it signals the Fed might keep rates low independent of where inflation might be.

Yellen Fed

With Janet Yellen coming in, the concept of promoting employment is raised to a new level. Long gone is the Great Depression, but what remains may be a conviction that monetary policy should make up for the shortfalls of fiscal policy. That’s problematic for a couple of reasons:

  • When the Fed meddles with fiscal policy, Congress will want to meddle with monetary policy. For example, when the Fed buys mortgage-backed securities it allocates money to a specific sector of the economy (favoring the housing market); that’s not what the Fed ought to do – it’s the role of Congress to channel money through tax and regulatory policy. One can disagree whether even Congress should be picking winners and losers in an economy, but that’s a political determination to be made by elected officials.
  • When the Fed keeps rates low to promote employment, there’s a fair risk that important cues are removed from the market that would encourage Congress to show fiscal restraint. Congress has always loved to have a printing press in the back yard, but an employment target suggests that this printing press is going to be moved into the kitchen. The Eurozone may be proof that policy makers only make the tough decisions when forced to do so by the bond market; if, however, the Fed works hard to prevent this “dialogue” between the bond market and politicians, the most effective incentive to show fiscal restraint might be gone.
  • Inflation is a clear risk when the Fed emphasizes employment. In our assessment, inflation may well be the goal rather than the risk in the eyes of some policy makers, as inflation lowers the value of outstanding government debt.

Hold on to your wallet

In a democracy, it’s all too tempting to introduce ever more entitlements. As obligations mount, however, servicing these obligations might become ever more challenging. It’s nothing new that governments tax their citizens. But when deficits are no longer sustainable, governments may be tempted to engage in trickery. Structural reform, that is taking away entitlements, to lower expenditures would be the most prudent path to regain fiscal sustainability. Raising taxes is all too often the preferred alternative; while politically difficult, raising taxes is a strategy that’s all too often politically viable. Yet the path of least resistance may well be to inflate the debt away. Central banks ought to be independent to take this option away from policy makers. We have seen in the Eurozone that it can be most painful when the printing press is not at the disposal of politicians.

In our assessment, a central bank pursing an employment target is a central bank that has given up its independence. It’s only ironic that outgoing Fed Chair Bernanke recently praised Mexico’s central bank for gaining “independence.”

Whatever happened to the government being the representative of the people? Interests of the government and its citizens are no longer aligned when a government has too much debt. The government’s incentive will be to debase the value of the debt. The U.S. may have an easier time debasing the value of its debt than some other countries, as much U.S. debt is held by foreigners who can’t vote in the U.S. Differently said, promoting a weaker dollar is another potential avenue for U.S. policy makers to kick the can down the road. But fear not, whatever policy is coming to a neighborhood near you shall be done in the name of fostering maximum employment.

Axel Merk
Axel Merk is President and Chief Investment Officer, Merk Investments, Manager of the Merk Funds.

More on this topic:

After getting rid of their crazed central bankers, Zimbabwe Achieves Economic Growth by Destroying Ability of Government to Print Money.

obama_zimbabwe

So the good news is that once the economic collapse kicks in and the dollar becomes worthless preventing Hillary Chelsea Clinton Obama III, our 79th President from just printing more money, we too can have an actual economic recovery. Just like Zimbabwe.

“Having a multi-currency economy with no Zimbabwe dollars is primarily good news for Zimbabwe because government can’t print its way out of a deficit,” said John Robertson, an independent economist, in an interview from Harare. “They can’t just print more if they need it, as was happening in 2008.”

So there’s hope for America yet. Our current dictator could learn some lessons from the plight of Zimbabwe, but I suppose destroying the economy is a better means of wealth redistribution, than actually repairing the economy. Until then we’ll go on printing imaginary money.

US Mint Gold and Silver Bullion Coin Sales Decline in September

silver, gold
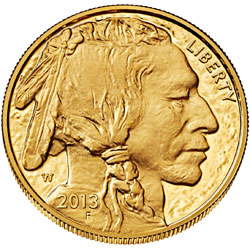
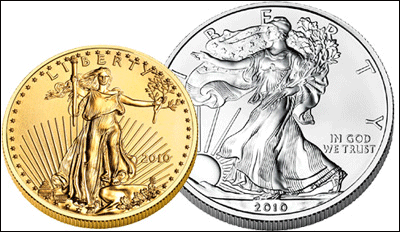
Demand for American Eagle gold and silver bullion coins remained sluggish in September according to the latest figures from the U.S. Mint.

Sales of the American Eagle gold bullion coin totaled 13,000 ounces in September, off a considerable 77% from the previous year but up 13% from last month.  Sales of the gold bullion coin in August were only 11,500 ounces, the lowest monthly sales of the year.

The slowdown in gold coin sales marks a turnaround from the beginning of the year when demand for physical gold seemed insatiable.  April sales of the American Eagle gold coins came in at 209,500 ounces which was the largest sales month since December 2009 when 231,500 ounces were sold.

Despite the frenzy of money printing by banks around the world, gold bullion coin sales have declined every year since 2009 as the financial system stabilized.  Gold sales soared during the financial panic in 2009 to an all time high as nervous buyers sought safe haven in gold.

Yearly sales of the gold bullion coins are shown below.  The 2013 total is through September 3o.

Sales of the American Eagle silver bullion coins declined for the second month in a row.  During September the U.S. Mint sold 3,013,000 silver coins, down 7.4% from last year and down 16.9% from August.

Despite the soft sales in September, demand for the silver bullion coins has been robust this year.  If sales continue at the 3 million coins per month rate through year end, 2013 will turn out to be a record sales year with annual estimated silver bullion coin sales of 45 million.

Sales of the American Eagle silver bullion coins by year are shown below.  The 2013 sales total is through September 30.