May 19, 2024

2013 Silver Eagle Bullion Sales Open at 3,937,000

Sales of the United States Mint’s American Silver Eagle bullion coins started the year in impressive fashion. For the opening day of availability for 2013-dated coins, the US Mint received orders for 3,937,000 coins from authorized purchasers.

This amount exceeds the opening day sales levels for recent years, which had seen 3,197,000 coins ordered to start 2012; 2,085,000 coins ordered to start 2011; and 2,440,000 coins ordered to start 2010.

The strong opening for the 2013 Silver Eagles has been driven by pent up demand for the popular one ounce silver bullion coins. The US Mint sold out of the 2012-dated coins in mid-December, creating a three week period during which no coins were available for authorized purchasers to order. The pent up demand supplemented the already typically high demand for the first release of the newly dated coins.

To put yesterday’s numbers in perspective, the sale of nearly 4 million one ounce silver coins represents more than one-tenth of annual silver production within the United States. Since the start of the program there have been two years (1996 & 1997) where annual Silver Eagle sales measured in ounces have been lower than yesterday’s sales which occurred in a single day. Measured in dollar terms, yesterday’s sales of approximately $120 million worth of Silver Eagles were higher than the annual sales total for each individual year from 1986 to 2005.

Gold Will Benefit From The Coming Currency Turmoil

By:  Axel Merk, Merk Investments

Sidetracked by the discussion over the “fiscal cliff” and possibly a New Year’s hangover, it’s time to face 2013 in earnest. Is the yen doomed? Will the euro shine? What about Asian and emerging market currencies? Will gold continue its ascent? And the greenback, will it be in the red?

Before we look too far forward, let’s get some context:

  • “Central banks hope for the best, but plan for the worst” was our theme a year ago. With everyone afraid of the fallout from the Eurozone, printing presses in major markets were working overtime. We argued this would benefit currencies of smaller countries – be that the so-called commodity currencies or select Asian currencies – that feel less of a need to “take out insurance.”
  • While we were positive on the euro when it approached 1.18 versus the U.S. dollar in 2010, arguing the challenges are serious, but ought to be primarily expressed in the spreads of the Eurozone bond market. Then in the fall of 2011, we grew increasingly cautious because of the lack of process: just as it is difficult to value a company if one doesn’t know what management is up to, it’s difficult to value a currency if policy makers have no plan. In the spring of 2012, when we were most negative about the euro, we lamented the lack of process in a Financial Times column. European Central Bank (ECB) chief Mario Draghi appeared to agree with our concerns, imploring policy makers to define processes, set deadlines, hold people accountable. After his “do whatever it takes” speech in July 2012, he took it upon himself to impose a process on European policy makers in early August 1. We published a piece “Draghi’s genius” where we called for a bottom in the euro. We were inundated with negative feedback in the immediate aftermath of our analysis from professional and retail investors alike, confirming that were not following the herd, nor buying something that’s too expensive.
  • While we liked commodity currencies in the first half of the year because of printing presses in larger economies working overtime, we grew a little cautious as the year moved on, partly because of valuations. Each commodity currency has its own set of dynamics, as well as their own Achilles heel: in the case of the Australian dollar, we had some concerns about its two tier domestic economy (not all of Australia was benefiting from the commodity boom), but also about the perceived slowdown in China.
  • We studied the Chinese leadership transition with great interest; while 2012 may have been a year in transition, more on the dynamics as we see them play out below.
  • Back in the U.S., we squandered another year to get the house in order. The fiscal cliff was a distraction; we need entitlement reform to make deficits sustainable. Europeans have no patent on kicking the can down the road. But unlike Europe, the U.S. has a current account deficit, making it more vulnerable should investors demand more compensation to finance U.S. deficits (that is, higher interest rates).
  • Japan: the more dysfunctional the Japanese government has been, the less it could spend, the less pressure it could exert on the Bank of Japan. Add to that a current account surplus, and all this “bad news” was good news for the yen. Countries with a current account surplus don’t need inflows from abroad to finance government deficits; as a result, the absence of economic growth that keeps foreign investors away is of no detriment to the currency. Conversely, countries with current account deficits tend to pursue policies fostering economic growth to attract capital from abroad. However, in late 2012, we published a piece “Is the Yen Doomed?” What happened? Japan was about to have a strong government. More in the outlook below.

We believe the currency markets are well suited for decision-making based on macro-analysis. Just as throughout 2012 the themes were evolving, please keep in mind that our 2013 outlook may be outdated the moment it is published, as we update our views based on new information or a new analysis of old information. Still, those who have followed us over the years are well aware that we like to shift our views within a framework. Please consider our 2013 outlook in this context:

  • We believe the yen is indeed doomed. We remove the question mark. Prime Minister Abe’s new government sets the stage, but key to watch are:
    • Abe’s government will appoint the three top positions at the Bank of Japan, as the governor and both deputy governors retire. Recent appointees have already been more dovish. Japanese culture is said to prefer talk over action, but the time for dovish talk may finally be over (despite their dovish reputation, the Bank of Japan barely expanded its balance sheet since 2008; in many ways, of the major central banks, only the Reserve Bank of Australia has been more hawkish).
    • Japan’s current account is sliding towards a deficit. That means, deficits will start to matter, eventually pushing up the cost of borrowing, making a 200%+ debt-to-GDP ratio unsustainable.
    • Abe’s government is as determined as it is blind. Abe believes a major spending program is just what Japan needs. As far as the yen is concerned, Abe may be getting far more than he is bargaining for.
    • But isn’t everyone negative on the yen already? Historically, it’s been most painful to short the yen; as such, many have not walked their talk. We expect some fierce rallies in the yen throughout the year. Having said that, the yen looks a lot like Nasdaq in 2000 to us. Not as far as technicals are concerned, but as far as the potential to fall without much reprieve.
  • The euro may be the rock star of 2013. Boring is beautiful. Sure, there are plenty of problems, but the euro is morphing into yet another currency, but is still priced as if it had a contagious disease. While the Fed, the Bank of England, the Bank of Japan are all likely to engage in further balance sheet expansion (we refer to it as “printing money” as assets are purchased by central banks, paid for by entries on computer keyboards, creating money out of thin air), there’s a chance the ECB balance sheet may actually shrink. That’s because some banks have indicated they will pay back early part of the €1 trillion in 3-year loans taken from the ECB. Some suggest the ECB might print a boatload of money should the “Outright Monetary Transaction” (OMT) program be activated to buy the debt of peripheral Eurozone countries. Keep in mind that the OMT program would be sterilized, likely by offering interest on deposits at the ECB. As such, the OMT would lower spreads in the Eurozone and, through that, act as a massive stimulus. In our assessment, however, such a stimulus is far less inflationary than central bank action in other regions. It’s no longer a taboo to be positive on the euro, but most we talk to are at best “closet bulls.”
  • The British pound sterling. The Brits are getting a new governor at the Bank of England (BoE) in the summer, the current head of the Bank of Canada (BoC), Carney. One of the first speeches Carney gave after his appointment was made public was about nominal GDP targeting. Carney will have a chance to replace many of the current BoE board members. That’s the good news, as the old men’s club is in need of a makeover. The not-so-good news is for the sterling. British 10 year borrowing costs have just crossed above those of France. We’ll monitor this closely.
  • As the head of the BoC, Carney was particularly apt at talking down the Loonie, the Canadian dollar, whenever it appeared to strengthen. If Macklem, his current deputy, is appointed, we may get a real hawk at the helm of the BoC. We are positive on the Loonie heading into 2013, but will monitor developments closely, as there are economic cross-currents that, for now, Canada appears to be handling very well.
  • Staying with commodity currencies, we are cautiously optimistic on the Australian dollar (China better than expected; monetary policy more hawkish than priced in) and New Zealand dollar (more hawkish monetary policy on better than expected growth). We continue to stay away from the Brazilean real and leave it for masochistic speculators looking for excitement.
  • We are positive on Norway’s currency (joining the above mentioned rock star, with greater volatility), yet cautious on Sweden’s (priced to perfection is not ideal when things are not perfect, even in Sweden).
  • China: the new leadership has indicated that liquidity for the Chinese yuan may be their top currency priority. That’s great news, as we believe it implies policies that attract investment, not just from the outside, but also with regard to a development of a more vibrant domestic fixed income market. We are more positive on China than many; more on that, in an upcoming newsletter (click to sign up to receive Merk Insights)
  • Korea, Malaysia, Taiwan: all positive, benefiting from both internal forces, but also beneficiaries of actions in other large economies. If we have to pick a favorite today, it would be Korea, but keep in mind that the Korean won is the most volatile of these currencies.
  • Singapore: we continue to like the Singapore dollar. A year ago, we started using it as a substitute for the euro (rather than using the U.S. dollar as the safe haven currency). The currency may well lag the euro’s rise, but the lower risk profile of the currency makes it a potentially valuable component in a diversified basket of currencies.
  • Gold. We expect the volatility in gold to be elevated in 2013, but consider it good news, as it keeps the momentum players at bay. We own gold not for the crisis of 2008, not for the potential contagion from Europe, but because there is too much debt in the world. We think inflation is likely a key component of how developed countries will try to deal with their massive debt burdens, even as cultural differences will make dynamics play out rather differently in different countries. Please see merkinvestments.com/gold for more in-depth discussion on our outlook on gold.

And what about the U.S. dollar? While much of the discussion above is relative to the U.S dollar, the greenback itself warrants its own analysis:

  • Investors in the U.S. should fear growth. The spring of 2012 saw the bond market sell off rather sharply as a couple of economic indicators in a row came out positively. Bernanke wants to keep the cost of borrowing low, but can only control the yield curve so much. That’s why, in our assessment, he is emphasizing employment rather than inflation, in an effort to prevent a major sell-off in the bond market before the recovery is firmly established. Growth is dollar negative because the bond market would turn into a bear market: foreigners’ love for U.S. Treasuries might wane, just as it historically often does during early and mid-phases of an economic upturn as the bond market is in a bear market.
  • Good luck to Bernanke to raising rates in 15 minutes, as he promised he could do in a 60 Minutes interview. Sure he can, but because there’s so much leverage in the economy, any tightening would have an amplified effect. At best, we might get a rather volatile monetary policy. But we are promised by the Fed that this is not a concern for 2013.
  • Both of these, however, suggest volatility will rise in the bond market. Remember what got the housing bubble to burst? An uptick in volatility. That’s because leveraged players, momentum players run for the hills when volatility picks up. And a lot of money has chased Treasuries, praised as the best investment for over two decades. We don’t need foreigners to sell their U.S. bonds for there to be a rude awakening in the bond market; we merely need a return to historic levels of volatility. Why is this relevant to a dollar discussion? Because a bond market selloff makes it more expensive for the U.S. to finance its deficits. Please see our recent analysis of the risks posed to the dollar by a bond market selloff for a more in-depth discussion on this topic.

Axel Merk is President and Chief Investment Officer, Merk Investments. Merk Investments, Manager of the Merk Funds.

THE ONGOING COLLAPSE IN THE PURCHASING POWER OF THE DOLLAR IS IRREVERSIBLE – TEN STEPS TO PROTECT YOURSELF

By GE Christenson

  • Our financial system, as it currently operates, is unsustainable. Unproductive debt cannot exponentially increase forever. I assume this is obvious to almost everyone. Jim Sinclair says, “The financial system is simply FUBAR. It is that simple. The reason to own all things gold is that simple.” FUBAR has several meanings, but my interpretation of FUBAR is: “Fiscally Unbalanced Beyond Any Reconciliation.”
  • The U.S. government deficits are, on average, larger every year. This means that the total (official) national debt is not only increasing each year but also that the rate of increase is accelerating. Since 10/1/2000 the national debt has increased about 9.1% per year, but since 10/1/2007 it has increased 12.2% per year. Worse, this is only the official debt and does not even consider the net present value of unfunded Social Security, Medicare, Medicaid, and government employee pensions and liabilities. Depending on who is calculating the liabilities, the total unfunded liability is approximately $100 Trillion to $230 Trillion and the annual increase is perhaps $7 – $11 Trillion. (The entire U.S. GDP is about $15 Trillion per year – for comparison.) This will not end well.
  • In essence, the above two facts are incompatible – hence an economic train wreck is in process. What could happen? Follow the logic here.
  • When there is too much of something, it loses value. If we have too many eggs, the price drops. If too many autos are for sale, there will be lower prices for autos. Central banks around the world are currently producing amazing quantities of dollars, euros, yen, and most other unbacked paper currencies. Hence, their value will decrease against the commodities we need for survival – food, energy, and so forth.
  • There is too much debt in our financial system, whether measured in nominal value or as a percentage of GDP. Hence the value of that debt will decline. Some debts will default, bonds will decline in value as interest rates inevitably rise, and other debt will drop in value and purchasing power.
  • Politicians have made excessive guarantees for future benefits to Social Security recipients, Medicare recipients, government pensions, and others. Those guarantees cannot all be delivered as promised, hence they will decline in value and purchasing power, or the promises will not be fulfilled.

Why are the following ten steps necessary?

  1. The best time to start preparing was about a decade ago. The second best time is today. Make a plan and act. Start by reducing living expenses and eliminating credit card debt.
  2. Expect sweeping changes! I hope the inevitable currency collapse is slow and gentle, not rapid and destructive, but history suggests rapid and painful are more likely.
  3. Phase out of paper assets and into something real. Gold, silver, diamonds, farm land, rental property, and buildings come to mind.
  4. Perspective – Perspective – Perspective! It is better to be early than late. It is better to trust yourself than to depend upon a government agency for your food and shelter. To whatever extent you can, take charge of your own financial affairs, savings, and retirement.
  5. Plan on huge inflation in consumer prices for food, energy, transportation, medical costs, and more.
  6. The middle class will be hurt the most. Those who plan and prepare will, as always, survive and prosper. Make a plan!
  7. Government control over the economy will increase. Surveillance on individuals will increase; there will be much less personal and financial privacy. Act accordingly!
  8. Social change will follow a currency collapse. It might be violent. The government is preparing in many ways for social violence. Are you?
  9. Currency induced cost-push inflation appears inevitable. When? As a guess, well before 2016. Gasoline costing $8.99 or more per gallon is a distinct possibility. Don’t discount this just because it sounds extreme. It might be a low estimate.
  10. Economic manipulations, mal-investments, and unsustainable policies will self-correct. Plan on corrections and adjustments that will bring painful consequences. The bigger the bubble, the more catastrophic the collapse and the larger the collateral damage. The sovereign debt and paper money bubbles appear VERY large and ready to pop.

Summary

Unproductive government debt cannot increase forever, but our financial system currently depends upon ever increasing expenditures and debt. There are far too many dollars in circulation, more debt than can be repaid, and massive unfunded liabilities have been created by the promises made by politicians. The purchasing power of the dollar must decline, many debts will not be repaid, and many promises for future benefits will be reduced in value or will simply disappear. Hence, the FUTURE income stream from debt-based assets is increasingly risky. A few to consider are:

  • Social Security benefits. The government must borrow or print to pay current benefits. The value (purchasing power) of future benefits will almost certainly decline.
  • Municipal and state bonds and pension promises are increasingly risky. Will more cities and states default on their bonds? Why are their pension plans, on average, increasingly underfunded? Will your pension plan remain safe? Consider moving your IRA into physical gold and silver safely stored outside the banking system.
  • US government 30 year bonds and 10 year notes will decline in price as interest rates rise, and will also decline in purchasing power as the dollar devalues. Why would you lend money (long-term) to an insolvent government at less than 3% interest per year when that government has assured you it will debase the currency and reduce the value of the debt you bought? Is this a financial train wreck in process?
  • Mutual funds and money markets based on bonds and other debt are at risk. If the underlying debt defaults, the value of the mutual funds and money markets will decline. Counter-party risk is real.

Why is debt based future income increasingly risky? The payoff will be delayed, defaulted or executed in mini-dollars after inflation and counter-party defaults have ravaged the purchasing power of those paper debts. We have Been Warned!

Would you prefer hard assets with no counter-party risk? Reread the Ten Steps To Safety, and then take charge of your financial life to whatever extent you can.

GE Christenson
aka Deviant Investor

Gold Bullion Coin Sales Drop For Fourth Straight Year, 2013 Sales Off To Strong Start

According to the latest U.S. Mint report, sales of the American Eagle Gold bullion coins for December 2012 totaled 76,000 ounces, up 16% from December 2011 when 65,500 ounces were sold.  Sales for the month were down 44.3% from November sales which totaled 136,500 ounces.

Sales of the gold bullion coins can vary dramatically from month to month.  The highest sales month was November with sales of 136,500 ounces and the lowest sales month was April when only 20,000 ounces were sold.  Average monthly sales of the gold bullion coins for 2012 was 62,750 ounces with total sales for the year coming in at 753,000.   The gold bullion coins are available in one ounce, one-half ounce, one quarter ounce and one-tenth ounce.

Sales of the American Eagle Gold bullion coins have now declined for four straight years in a row.  The all time record sales year was 2009 when the U.S. Mint sold 1,435,000 ounces.   The value of the gold bullion coins purchased since 2000 totals almost $13.5 billion.

The U.S. Mint only sells the gold bullion coins to a network of authorized purchasers who buy the coins in bulk based on a markup and the market gold value.  The primary distributors who buy the coins then resell them to other bullion dealers, coin dealers and the public.  By using this type of distribution channel, the U.S. Mint believes that the coins can be made widely available to the public with reasonable transaction costs and at premiums in line with other bullion programs.

The 2013 American Gold Eagle bullion coins were first available to authorized purchasers on January 2, 2013.  Demand for the newest gold bullion coins was very strong with 50,000 ounces sold on the first day.  For the entire month of January 2012, a total of 127,000 ounces of the coins were sold.

Gold Bullion U.S. Mint Sales By Year
Year Total Sales Oz.
2000 164,500
2001 325,000
2002 315,000
2003 484,500
2004 536,000
2005 449,000
2006 261,000
2007 198,500
2008 860,500
2009 1,435,000
2010 1,220,500
2011 1,000,000
2012 753,000
Total 8,002,500

After a volatile year, gold ended with a strong note for 2012, up by 7.1% and rising for the 12th year in a row as global central banks ramped up the printing presses in an attempt to “stimulate” the world economy.  In his annual “10 Surprises ” list for 2013, Byron Wien, Chairman of Blackstone Group’s advisory unit predicted that gold would reach $1,900 as “central bankers everywhere continue to debase their currencies and the financial markets prove treacherous.”  Based on the way things are going and the speed at which central banks are joining the money printing race, Mr. Wien’s forecast is likely to prove extremely conservative.

American Silver Eagle Bullion Coin Sales For 2012 Tops 33 Million Ounces – Mint Runs Out Of Coins

According to the U.S. Mint, total sales of the American Silver Eagle bullion coins for December 2012 totaled only 1,635,000 ounces, down by 18.6% from 2,009,000 coins sold during December 2011.  The lowest monthly sales for the year occurred in February when 1,490,000 Silver Eagle Bullion coins were sold.  The highest monthly sales of the Silver Eagles occurred in January when 6,107,000 coins were sold.

Demand for the Silver Eagle bullion coins has been robust this year and the low sales for December do not reflect reduced demand but rather reduced U.S. Mint production.   As reported by Coin Update, the Mint reported in mid December that all Silver Eagle bullion coins had sold out and no additional coins would be struck during 2012.  The Mint announced that the 2013 Silver Eagle bullion coins should be available to authorized purchasers on January 7, 2013.

As with other bullion programs, the US Mint does not sell Silver Eagle bullion coins directly to the public, but distributes them through a network of authorized purchasers. The primary distributors are able to purchase the coins in bulk quantities at a price based on the market price of silver plus a fixed mark up. The coins are then resold to other bullion dealers, coin dealers, and the public.

The US Mint originally began accepting orders for the 2012 Silver Eagles from authorized purchasers on January 3, 2012. After a strong January, monthly sales trailed the levels of the prior year until October when demand started to move higher. In November, bullion sales continued their renewed strength, with sales of American Gold and Silver Eagles more than doubling the figures from the year ago period.

The strong sales in November caused the United States Mint to adjust their production plans for one ounce and one-tenth ounce American Gold Eagle bullion coins in order to avoid selling out prior to the end of the year. Apparently, the Mint did not adjust production plans for American Silver Eagle bullion coins.

The sales figures for December would likely have exceeded 3 million ounces if the Mint had produced enough silver bullion coins to meet demand.  Nonetheless, total sales of the Silver Eagle bullion coins for 2012 were the third highest on record with a total of 33,742,500 coins sold.  All time record sales of the Silver Eagle coins occurred during 2011 when almost 40 million coins were sold.


Demand for the Silver Eagles has soared since the financial crisis began in 2008 and recent announcements by the Federal Reserve and other central banks pledging unlimited money printing is certain to increase investors demand for safe haven precious metals.

Since 2000, investors have purchased an astonishing 232,143,000 American Silver Eagle one ounce coins worth over $7 billion at current market prices.

Gold Has Outperformed Housing By 600% Since 2001

Anyone predicting that gold would outperform housing in 2001 would likely have been viewed as being seriously deranged.  After all, housing prices had increased for decades and by the peak of the housing market in 2007, real estate was believed to be a “can’t lose investment.”  The mantra that housing values only go up proved to be disastrous for many Americans as the over-leveraged real estate market imploded, shattering the wealth dreams of both naive homeowners and investors.

Despite the trillions of dollars of direct support from both the Federal Reserve and Congress, real housing values have yet to recover a fraction of their losses.  Mainstream press reports of a solid recovery in housing markets usually neglect to mention, that according to the Case-Shiller National Index, housing prices are still lower than they were at the turn of the century.

Courtesy: calculatedriskblog.com

Gold, meanwhile, unloved and ignored by most Americans is set to make its 12th straight annual gain.  From a yearly low of $255 per ounce during 2001, gold settled in New York trading on Thursday at $1,663.90, up 653% over the past 12 years.

Chart of the Day has some interesting data on the performance of gold versus housing, as represented by the Home Price/Gold Ratio.  Based on current prices, 105 ounces of gold will buy you the median priced single family home.  In 2001, a home buyer would have needed 601 ounces of gold to buy the same house.  Housing, when priced in gold, in down 80% from 2001.

Courtesy: chartoftheday.com

Despite gold’s proven ability to preserve wealth over time, most Americans still seem indifferent to allocating part of their portfolios into gold – something to think about as central banks ramp up the printing presses at an increasingly furious pace.

The Fed Is Confiscating The Wealth Of The Middle Class By Destroying The Value Of The Dollar

Americans need to take a serious look at how the purchasing power of the dollar is being destroyed.  Rampant poverty, declining real incomes and higher prices are all the guaranteed results of a Federal Reserve that remains committed to destroying the value of the dollar.   A dollar saved today that has less purchasing power a year from now equates to the “silent” destruction of the dollar, an event which has gone virtually unnoticed and unprotested by the American public.

Act #4 of the Fed’s endless money printing campaign directly monetizes over a half a trillion dollars of U.S. deficit spending annually.  In addition to financing the Federal debt with printed dollars, the Fed has also explicitly endorsed  an inflation rate of 2.5% as being “acceptable.”

Impact Of 2.5% Inflation

Even a relatively “benign” inflation rate of 2.5% rapidly erodes the purchasing power of savings. Over a short 5 years, the purchasing power of $100,000 in savings is reduced to $88,110 at an inflation rate of 2.5%.  At a 5% inflation rate, the value after 5 years is only $77,378.  We don’t even want to look at how much purchasing power would be lost over a decade.

Both consumers and especially savers need to become aware of the wealth depletion caused by purchasing power loss.  From my experience, most people find it conceptually difficult to see a real loss (in purchasing power) when there has been no change in the principal amount of savings.  As John Maynard Keynes wrote in 1920, “By a continuing process of inflation, governments can confiscate, secretly and unobserved, an important part of the wealth of their citizens.  By this method they not only confiscate, but they confiscate arbitrarily; and while the process impoverishes many, it actually enriches some.  And not one man in a million will detect the theft.”

Incredibly, the desperate attempts of central banks to prop up the over-indebted financial system via inflation and money printing is viewed as beneficial by some misguided economists.  Japan’s decision to go all in with “unlimited quantitative easing” was applauded in a recent Slate commentary.

That’s because Shinzo Abe, the overwhelming favorite to lead the Liberal Democratic Party to victory, is running on a bold platform of unlimited quantitative easing and more inflation. If this works—and the odds are that it will—Abe will not only cure a great deal of what ails Japan, he’ll light a path forward for the rest of the developed world.

But if he (Abe) does manage to stick to his guns, the odds are good that it will work. Monetary expansion should reduce the price of the yen and goose exports. More importantly, it will push domestic real interest rates down and spur investment. Creating firm expectations that yen-denominated prices will be higher in the future than they are today should encourage firms and households alike to acquire real goods sooner rather than later. And all this ought to encourage everyone to be investing and spending more.

Bernanke said Japan’s central bankers needed Rooseveltian resolve, but the moral of the story may be that it takes a politician—a Roosevelt—to have the clout and legitimacy to make central banks act decisively when an economy gets firmly mired at the lower bound. If Abe can be that Roosevelt, he’ll not only be a hero of Japan but possibly of the whole world economy. After all, if America’s old advice to Japan turns out to work in practice as well as in theory, then maybe we’ll finally get around to taking our own advice for ourselves.

Does anyone think that Japan’s temporary benefit of a lower currency will not be met with competitive devaluations by other nations?  Exactly how will Japanese consumers be able to spend more if prices increase and wages remain stagnant due to the limiting effects of wage globalization?  The Slate author firmly espouses the lunacy of currency debasement as a wealth enabler despite the fact that no nation in history has ever printed its way to prosperity.

The fact that central banks have firmly committed themselves to money printing on an unimaginable scale is not a cause for hope but rather a clear signal of desperation.  Policy makers have run out of options and in an attempt to forestall the collapse of the financial system, have turned to the last resort option of unlimited money printing.

Gold Demand In Asia Remains Insatiable

As gold demand in Asia soars, vault companies are racing to keep up with storage demand.  In July, Gold and Silver Blog reported on a massive new gold vault being constructed in Hong Kong by Malca-Amit due to unrelenting physical demand for gold in Asia.  The new vault was designed to hold 1,000 metric tonnes of gold and as of July, had already taken in 2,400 tonnes of gold owned by gold exchange traded funds.

It turns out that Malca-Admit should have built a much larger vault.  As demand for physical gold continues to increase, other companies have joined the race to provide secure depositories for wealthy investors.  The Wall Street Journal reports that demand for high-security vault capacity in Asia is soaring in Singapore, Hong Kong and Shanghai.

Brink’s Co., for example, has increased its storage space for precious metals in Singapore more than threefold over the past year, to 200 square meters, and is building a bonded warehouse in Shanghai to store high-value consumer goods and precious metals.

“We are growing, and driving that growth is the storage of precious metals and also bank notes,” said Jos van Wegen, the company’s senior manager of global services in Singapore.

Comprehensive data on the volume of high-security storage capacity in the region isn’t available. But demand for gold is clearly rising.

China’s gold demand in the third quarter of this year was 176.8 tons—16% of global demand and up 47.1% from the same period three years ago, according to the World Gold Council. Hong Kong’s demand totaled 6.9 tons in the third quarter this year, up 56.8% from the third quarter of 2009.

Singapore imported 36.7 tons of gold in the first 10 months of this year, well down from 62 tons in the full year 2011. The government’s announcement in February that, in a bid to become a gold-trading hub, it would scrap a 7% goods and services tax on gold, silver and platinum hurt imports for much of the year. Fourth-quarter gold-import figures for Singapore are expected to be stronger, World Gold Council executives say.

While physical gold requires storage space, it does offer a lot of value in a relatively small package. At around $1,690 a troy ounce, a metric ton of gold is valued at $54.3 million, but would take up only slightly more space than a standard case of 12 wine bottles—though most gold is stored in ingots.

Malca-Amit, a company that stores and transports diamonds and precious metals, has lockups in Hong Kong and Singapore, and is preparing to open one in Shanghai in the first quarter next year. The Shanghai vault will also hold art and luxury goods such as high-value mobile phones and designer handbags.

Malca-Amit’s Singapore vault, capable of holding 600 tons of gold, is almost full, and the company is seeking more space. The amount of gold stored there has increased 200% from a year ago, it says.

Its recently opened Hong Kong vault can hold 1,000 tons of gold, which would be worth more than $54 billion. It is almost large enough to hold the official reserves of China, which total 1,054 tons, according to World Gold Council data.

Malca-Amit has gold-storage sites in New York and Zurich, but the focus of its expansion is firmly on Asia, executive director Joshua Rotbart said. Some Asian investors who are storing their gold in the U.S. and Europe are keen to move it closer to home as more storage space becomes available, he said.

The recent price weakness in gold is apparently viewed as a buying opportunity by sophisticated Asian investors seeking to protect their wealth from the torrential flood of printed money being produced on a global basis by central banks (see Central Banks Pledge Unlimited Money Printing).

On a recent visit to the Chinatown section of Bangkok, I witnessed first hand large crowds of customers in Chinatown’s numerous retail gold stores.  Gold has never defaulted on its promise as a means of wealth preservation, something clearly understood by the citizens of a country whose history goes back thousands of years.

Customers at Bangkok retail gold store

Chinese Gold

Chinese Gold

The Hidden Risks Of Money Printing

By Axel Merk

While Treasuries are said to have no default risk as the Federal Reserve (Fed) can always print money to pay off the debt, hidden risks might be lurking. As oxymoronic as it may sound, the biggest risk to the economy and the U.S. dollar might be, well, economic growth! Let us explain.

The U.S. government paid an average interest rate of 2.046% on the $11.0 trillion of Treasuries outstanding as of the end of November. Treasuries include Bills, Notes, Bonds and Treasury Inflation-Protected Securities (TIPS). At 2.046%, the cost of carrying the Treasury portfolio currently costs the government $225 billion per annum; about 6% of the federal budget was spent on servicing the national debt. 1

While total government debt has ballooned in recent years, the interest rate paid by the government on its debt has continued on its downward trend:

We only need to go back to the average interest rate paid in 2001, 6.19%, and the annual cost of servicing Treasuries would triple, paying more than Greece as a percentage of the budget. Not only would other government programs be crowded out, the debt service payments might likely be considered unsustainable. Except for the fact that, unlike Greece, the Fed can print its own money, diluting the value of the debt. In doing so, the debt could be nominally paid, although we would expect inflation to be substantially higher in such a scenario.

These numbers are no secret. Yet, absent of a gradual, yet orderly decline of the U.S. dollar over the years – with the occasional rally to make some investors believe the long-term decline of the U.S. dollar may be over – the markets do not appear overly concerned. Reasons the market aren’t particularly concerned include:

  • The average interest rate continues to trend downward. That’s because maturing high-coupon Treasury securities are refinanced with new, lower yielding securities.
  • Treasury Secretary Geithner has diligently lengthened the average duration of U.S. debt from about 4 years when he took office to currently over 5 years.

For the U.S. government, a longer duration suggests less vulnerability to a rise in interest rates, as it will take longer for a rise in borrowing costs to filter through to the average debt outstanding. The opposite is true for investors: the longer the average duration of a bond or a bond portfolio one holds, the greater the interest risk, i.e. the risk that the bonds fall in value as interest rates rise.

Debt management by the Treasury only tells part of the story on interest risk. When the Treasury publishes “debt held by the public,” it includes Treasuries purchased in the open market by the Fed. By engaging in “Operation Twist”, the Federal Reserve stepped onto Timothy Geithner’s turf, manipulating the average duration of debt held by the private sector. Notably, the private sector holds fewer longer-dated bonds, as the Fed has gobbled many of them up.

However, investors may still be exposed to substantial interest risk in their overall fixed income holdings as, in the search of yield, many have doubled down by seeking out longer dated and riskier securities.

The Fed, many are not aware of, employs amortized cost accounting, rather than marking its holdings to market, thus hiding potential losses should interest rates go up and its portfolio of Treasuries and Mortgage-Backed Securities (MBS) fall in value.

Quantitative easing to increase interest risk

Whenever there’s a warning that all the money created by the Federal Reserve is akin to printing money, some dismiss these concerns as the money created out of thin air to buy securities has not caused banks to lend, but park excess reserves back at the Federal Reserve. As of December 14, 2012, $1.4 trillion in excess reserves is parked at the Fed. Substantial interest risk might be baked into reserves:

Consider that the Fed has been paying about $80 billion in profits to the Treasury in recent years. Think of it this way: the more money the Fed “prints”, the more (Treasury & MBS) securities it buys, the more interest it earns. That’s why Fed Chair Bernanke brags that his policies have not cost taxpayers a cent, even if the activities may put the purchasing power of the currency at risk. Now, Bernanke has also claimed he could raise rates in 15 minutes. In our assessment, it’s most unlikely he would do so by selling long-dated securities; instead, in an effort to keep long-term rates low, the most likely scenario is that the Fed will pay a higher interest rate on reserves. Up until the financial crisis broke out, the Federal Reserve would have intervened in the Treasury market by buying and selling securities to move short-term interest rates. In the fall of 2008, the Fed was granted the authority by Congress to pay interest on reserves.

As interest rates rise, not only will Treasury pay more for debt it issues, it may also receive less from the Fed. Interest rates would have to rise to about 6% for the entire $80 billion in “profits” to be wiped out assuming a constant $1.5 trillion in reserve balances ($1.4 trillion in excess reserves and $0.1 trillion in required reserves that also receive interest); that assumes, the Fed does not grow its balance sheet in the interim (in an effort to generate more “profits” for the Fed) and would not reduce its payouts in the interim as a precaution because bonds held on the Fed’s books may be trading in the market at substantially lower levels.

Should interest rates move up, the Treasury may no longer be able to rely on the Fed to finance the deficit (while the Fed denies the purposes of its policies is to finance the deficit, the Fed is buying a trillion dollars in debt as the government is running a trillion dollar deficit).

Biggest risk: economic growth?

In our surveys, inflation tends to be on top of investors’ minds, no matter how often government surveys show us that inflation is not the problem. Should inflation expectations continue to rise – and a reasonable person may be excused for coming to that conclusion given that the Fed appears to be increasingly focusing on employment rather than inflation – bonds might be selling off, putting upward pressure on the cost of borrowing for the government.

But if we assume inflation is indeed not an imminent concern (keep in mind that the Fed is also buying TIPS and, thus, distorting important inflation gauges in the market), we only need to look back at the spring of this year when a couple of good economic indicators got some investors to conclude that a recovery is finally under way. What happened? The bond market sold off rather sharply! A key reason why the Fed is increasingly moving towards employment targeting is to prevent a recurrence, namely a market-driven tightening, pushing up mortgage costs.

The government should be grateful that we have this “muddle-through” economy. Let some of that money that’s been printed “stick;” let the economy kick into high gear. In that scenario, the “good news” may well be reflected in a bond market that turns into a bear market.

Historically, when interest rates move higher in an economic recovery, the U.S. dollar is no beneficiary because foreigners tend to hold lots of Treasuries: should the bond market turn into a bear market, foreigners historically tend to wait for the end of the tightening cycle before recommitting to U.S. Treasuries.

The point we are making is that for bonds to sell off and the dollar to be under pressure, we don’t need inflation to show its ugly head; we don’t need China or Japan to engage in financial warfare by dumping their Treasury holdings. All we may need is economic growth! And while Timothy Geithner has studiously been trying to extend the average duration of U.S. debt, Ben Bernanke at the Fed has thrown him a curveball.

Perception is reality

One only needs to look at Spain to see that a long average duration of government debt is no guarantor against a debt crisis. Spain has an average maturity of government debt of 6 years, yet it does not take a rocket scientist to figure out that borrowing at 6% in the market is not sustainable given the total debt burden. As such, markets tend to shiver when confidence is lost, even if, technically, governments could cling on for a while when the cost of borrowing surges.

History may repeat itself

It was only 11 years ago that the US government paid and average of 6% on its debt. Sure the average cost of borrowing has been coming down. But no matter what scenarios we paint, if the average cost of borrowing can come down to almost 2% from 6%, we believe it is entirely possible to have the reverse take place over the next 11 years. Given the additional risks the Fed’s actions have introduced, the timing could well be condensed. But even if not, we believe it is irresponsible for policy makers to pretend interest rates may stay low forever (except, maybe, Tim Geithner’s steps to increase the average maturity of government debt; but as pointed out, his efforts may be overwhelmed by those of the Fed).

Fiscal Cliff

What’s so sad about the discussion about the so-called fiscal cliff is that even the initial Republican proposal results in approximately $800 billion deficits each year. Financed at an average 2%, this would add over $900 billion in interest expenses over ten years; financed at an average 4%, it would add almost $2 trillion in interest expense over ten years. Mind you, this is a politically unrealistic, conservative proposal. Democrats pretend we don’t even have a long-term sustainability problem, only that the wealthy don’t pay their fair share.

In our humble opinion, both Republicans and Democrats are distracted. In many ways, the simultaneous increase in taxes and cut in expenditures of the fiscal cliff is akin to European style austerity: if the cliff were to take place in its entirety, we would a) suffer a significant economic slow down; b) continue to run deficits exceeding 3% of GDP before factoring in any slowdown; and c) still not have fixed entitlements.

Entitlements

While our discussion focused on $11 trillion in Treasury securities, the so-called “unfunded liabilities” go much further than the $5 trillion in accounting liabilities set aside. Depending on the actuarial assumptions, unfunded liabilities may be as high as $50 trillion to $200 trillion or higher.

In our assessment, the only way to tame the explosion of government liabilities over the medium term is to tame entitlements. But it is very difficult to cut back on promises made. As Europe has shown us, the only language that policy makers understand may be that of the bond market. As such, unless and until the bond market imposes entitlement reform, we are rather pessimistic that our budget will be put on a sustainable footing. Put another way, things are not bad enough for policy makers to make the tough decisions.

Different from Europe, however, the U.S. has a current account deficit. As a result, a misbehaving bond market may have far greater negative ramifications for the dollar than the strains in the Eurozone bond markets had for the Euro. In the Eurozone, the current account is roughly in balance; while there was a flight out of weaker Eurozone countries, that flight was mostly intra-Eurozone towards Germany and Northern European countries.

So while the default risk of U.S. Treasuries may be less than that of Eurozone members, the risks to the purchasing power of the U.S. dollar might be substantially higher. On that note, while the Fed has indicated to buy another approximately $1 trillion in assets over the next year, we would not be surprised to see the balance sheet of the more demand-driven European Central Bank shrink as some banks pay back loans from the Long-Term Refinancing Operation (LTRO) early.

In early January, we will be publishing our outlook for 2013; Please also sign up for our newsletter to be informed as we discuss global dynamics and their impact on gold and currencies. Additionally, please join us for our upcoming Webinar on Tuesday, January 15th, 2013.

Axel Merk

Axel Merk is President and Chief Investment Officer, Merk Investments.

Gold and Stocks Diverge As Central Banks Pledge Unlimited Money Printing

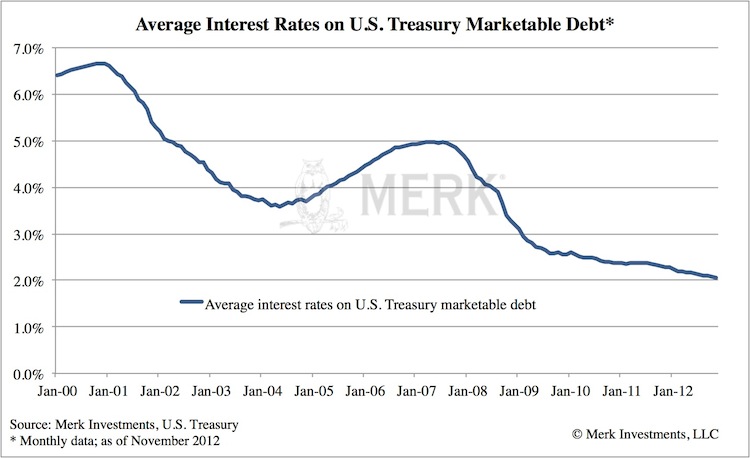
Both the Federal Reserve and the Bank of Japan have gone all in with their attempts to revive weak, debt burdened economies with a pledge of unlimited money printing.

Japan’s incoming Liberal Democratic Party Prime Minister Shinzo Abe, who ran on a platform of unlimited quantitative easing and higher inflation, has quickly forced capitulation by the Bank of Japan to surrender its independence from political influence.

The Bank of Japan pledged Thursday to review its price stability goal, admitting that the move was partly in response to incoming Prime Minister Shinzo Abe’s aggressive calls for the central bank to step up its fight against deflation.

At its two-day policy board meeting, the BOJ decided to expand the size of its asset-purchase program—the main tool of monetary easing with interest rates near zero—and promised to review next month its current inflation goal, something Mr. Abe demanded during Japan’s parliamentary campaign.

Countering speculation that the board’s decision-making process is being driven by politicians, Gov. Masaaki Shirakawa said the bank reviews its price goal every year. But he acknowledged that the policy board had taken Mr. Abe’s request into account.

The Bank of Japan’s quick surrender of monetary policy independence reflected the fact that they had little choice in the matter.  Mr. Abe had previously threatened a  “law revision to take away the BOJ’s independence if it didn’t comply with his demands.  Mr. Abe said the election shows that his views have the support of the people, and, on the night of his victory, he specifically said he expected the BOJ to do something at this week’s meeting.”

The policy of unlimited money printing by Japan came shortly after similar actions were announced by the U.S. Federal Reserve in early December.  Fed Chairman Ben Bernanke, architect of the U.S. “economic recovery” announced that the Fed would purchase $45 billion of US Treasuries every month in addition to the open ended monthly purchase of $40 billion of mortgage backed securities.  The Fed’s expanded “asset purchase programs” will be monetizing over $1 trillion of assets annually, effectively funding a large portion of the U.S. government’s annual deficit with printed money.

The impact of blatantly unlimited money printing by two of the world’s largest economies surprised many gold investors as the price of stocks and gold quickly diverged, with gold selling off and stocks (especially in Japan) gaining.

Why would gold, the only currency with intrinsic value that cannot be debased by governments, sell off as governments pledged to flood the world with freshly printed paper currencies?  Here’s one insight from John Mauldin.

When you reduce the amount of leverage in the system, you’re actually reducing the total money supply. So the Fed can come in and print money, and the money supply – the total amount of credit and leverage and material that’s going through the system – really hasn’t increased.

A lot of monetary economic theories say “the money supply is directly related to inflation.”

It is, but the amount of leverage and credit in the system is also directly related to inflation. It becomes a much more complicated mix. What happens at the end of the debt supercycle, as you’re reducing that leverage, you’re actually in a deflationary world. That is the whole debate between deflation and inflation.

If you read the polls in the United States, we’re just totally dysfunctional. We want to pay less taxes and we want more health care – that doesn’t work. We are going to have to be adults and recognize that problem.

The reason is the Fed is going to do everything they can to fight deflation. The only thing they can do is to print money. They’re going to be able to print more money than any of us can possibly imagine and get away with it without having inflation.

Mr. Mauldin may have a valid point, but a more likely explanation is the suppression of gold prices by governments and central banks as voluminously documented by GATA.

“Those who follow GATA may not be surprised when the monetary metals markets don’t make sense, since they really aren’t markets at all but the targets of constant intervention by governments.”